Divergence dashboard
- Indicators
-
Jan Flodin
 Hello, my name is Jan and I have been developing automated trading tools for the last 9 years. I am originally from Sweden but have lived in the Czech Republic since 2003.
PRODUCTS - Version: 2.5
- Updated: 6 July 2025
- Activations: 10
I recommend you to read the product's blog (manual) from start to end so that it is clear from the beginning what the indicactor offers.
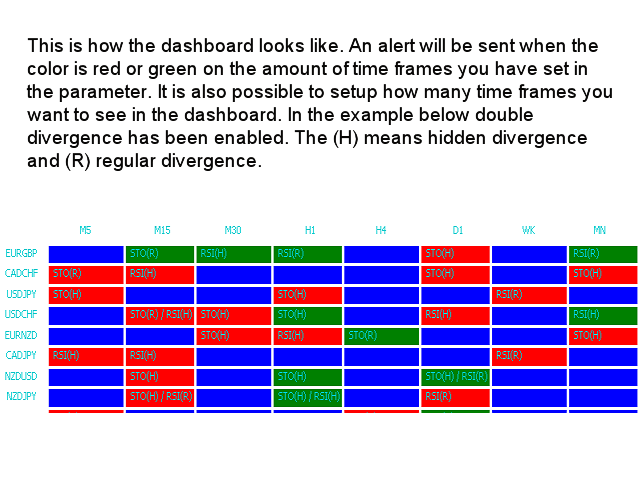
This multi time frame and multi symbol divergence dashboard indicator sends an alert when one or two different divergences have been identified. It can be used with all time frames from M1 to MN. It is possible to enable moving average or RSI trend filter to filter out only the strongest setups. It should be combined with your own confirmation rules, techniques and indicators. Then this indicator will allow you to create (or enhance) your own powerful system.
Features
- Can detect divergences for following oscillators/indicators: MACD (signal line or main line (histogram)), Stochastics, OsMA, RSI, CCI, Awesome, OBV, ADX, ATR, MFI, Momentum and Accelerator.
- It is possible to select the time frames to be visible in the dashboard.
- Continuously performs a divergence rank sorting within the dashboard. It is possible to disable this sorting though to make it easier finding a specific symbol. The symbols will then be visible in the same order as they have been entered in the Symbols parameter or in the order they are visible in the Market Watch window.
- By clicking inside a rectangle a new chart will be opened with the symbol and time frame in question.
- The indicator can write the signals to global variables which can be used by an Expert Advisor for auto trading.
It is enough to place the indicator on one chart and you will receive an alert from any symbol of your choice. All Metatrader native alert types are supported.
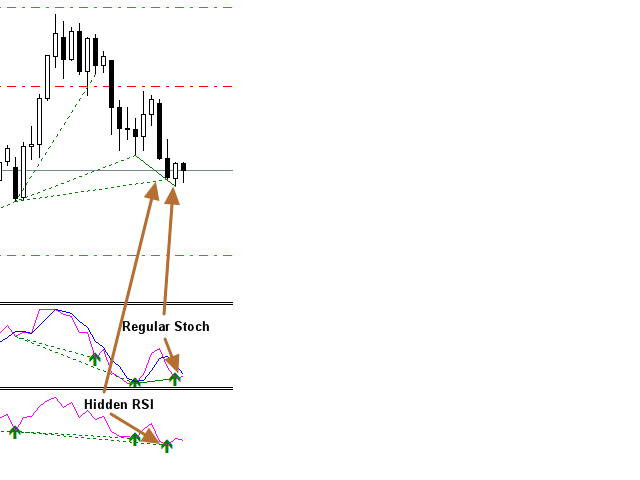
Both regular/classical (trend reversal) and hidden (trend continuation) divergences will be taken into consideration. Hence there could be a regular divergence and at the same time a hidden divergence on another time frame. Please see screenshot #3 below. The example is showing divergences from 2 indicators but it could also be from one and the same indicator. It is possible though to set if to use only regular or only hidden divergences by changing a parameter.
Input parameters
Please find the description and explanation of the input parameters here.
Important
Please note that this indicator is not supported in the strategy tester. It will also not draw lines and arrows or sell and buy advice on any chart. For this purpose you will need my free divergence indicator. The indicator must be put on a M5 chart, a clean (empty) chart without any other indicators or Expert Advisors on it which could interfere with the dashboard. The dashboard will be loaded in an indicator window which you can then expand to cover the whole chart.


All I can say is WOW!!!!! This is the ABSOLUTE BEST divergence scanner on the market. I hope every trader finds this divergence scanner. This has turned my losing divergence trades into 100% winning trades. Yes, I said 100%. Who gets to say 100% winning trades, whilst trading forex. At this price I feel guilty, as I feel like I'm cheating Jan out of the money he deserves for this indicator. I have paid a lot more and basically lost money. This is not my first purchase from Jan, as he creates EXCELLENT!!! products. Jan, I cannot thank you enough. I'm about to go and make a bazillion pips and retire, lol and it's all thanks to you. Jan THANKS A MILLION!!!