Double top bottom scanner with RSI filter
- Indicatori
-
Jan Flodin
 Hello, my name is Jan and I have been developing automated trading tools for the last 9 years. I am originally from Sweden but have lived in the Czech Republic since 2003.
PRODUCTS - Versione: 2.9
- Aggiornato: 8 dicembre 2023
- Attivazioni: 10
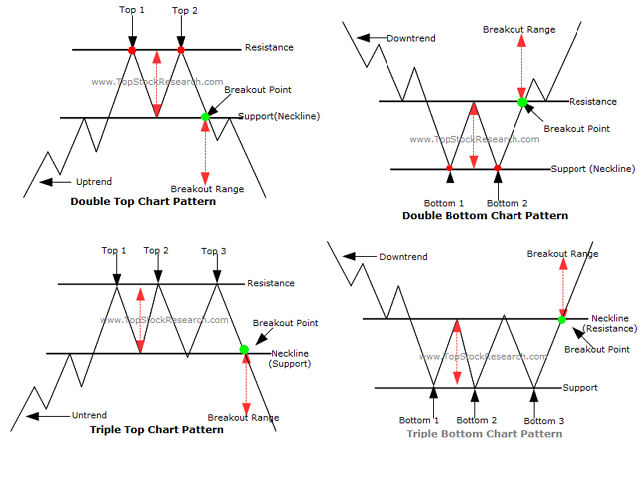
Questo indicatore multi time frame e multi simbolo identifica formazioni alto/basso doppie o triple o un successivo breakout della scollatura (confermato alto/basso). Offre filtri RSI, pin bar, engulfing, tweezer, stelle del mattino/sera, nonché MACD, Awesome (AO) o filtri divergenza RSI che consentono di filtrare solo le configurazioni più forti. L'indicatore può essere utilizzato anche in modalità grafico singolo. Si prega di leggere di più su questa opzione nel prodotto blog. Combinato con le tue regole e tecniche, questo indicatore ti permetterà di creare (o migliorare) il tuo potente sistema.
Caratteristiche
- Può monitorare contemporaneamente tutti i simboli visibili nella finestra Market Watch. Applica l'indicatore a un solo grafico e monitora istantaneamente l'intero mercato.
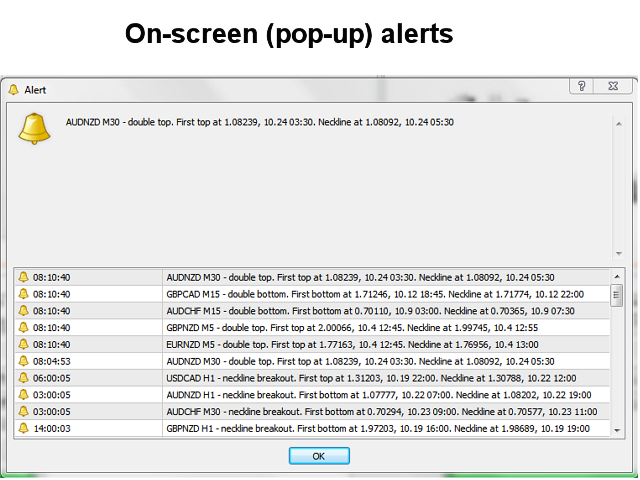
- Può monitorare ogni intervallo di tempo, da M1 a MN, e ti invia un avviso in tempo reale quando viene identificato il secondo o il terzo alto/basso o al breakout della scollatura. Sono supportati tutti i tipi di avvisi nativi di Metatrader.
- Può utilizzare RSI, una selezione di diversi modelli di candele e divergenze per identificare correttamente potenziali inversioni.
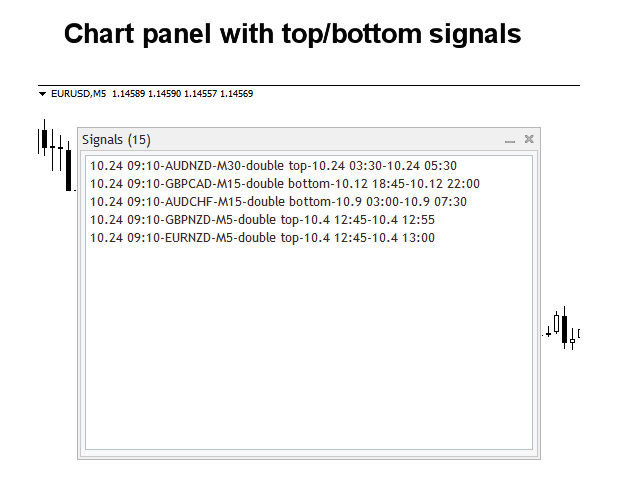
- L'indicatore include un pannello interattivo. Cliccando su un elemento verrà aperto un nuovo grafico con il simbolo e l'intervallo di tempo in questione.
- L'indicatore scrive i segnali in un file di testo che può essere utilizzato anche da un Expert Advisor (EA) per il trading automatico. Ad esempio questo prodotto.
Parametri di input
La descrizione e la spiegazione dei parametri di input si trovano qui.
Importante
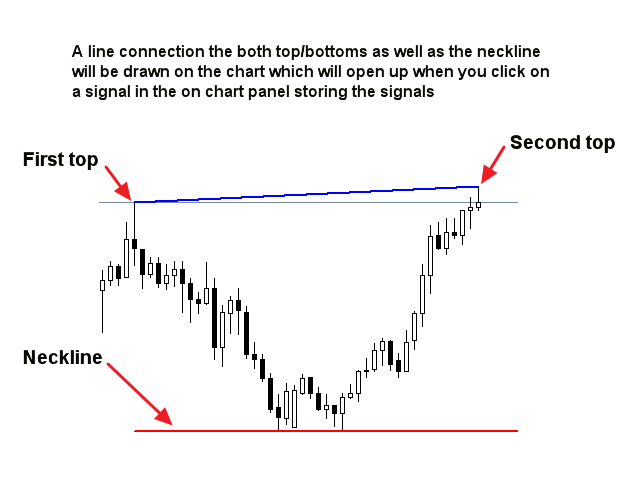
Si prega di notare che, a causa della multifunzionalità, né i consigli di acquisto e vendita né le linee e le frecce verranno tracciate sul grafico in cui è stato installato l'indicatore. Sul grafico che può essere aperto dal pannello verrà tracciata una linea tra gli estremi e la scollatura.
È altamente consigliabile posizionare l'indicatore su un grafico pulito (vuoto) senza altri indicatori o consulenti esperti su di esso che potrebbero interferire con lo scanner.


It's not just a simple scanner for DB & DT. It has the ability to notify early, allowing for processing time. It becomes very powerful when you apply the provided filters. On this note, I would like some confirmed settings... The fact that the signals are recorded and remain in the MT4 window is a fantastic idea. The way the indicator operates is close to the trader and deviates from the mindset of simple programming. Kudos to the creator. Excellent work!!! The best in its category. I will also purchase the scanner for S&R. It saves me from tasks I've been doing for years on my charts.