PivotTide MT5
- Indicators
-
Evgeniy Zhdan
 ➖➖➖➖➖➖➖➖➖➖➖➖➖➖➖➖➖➖➖➖➖➖
Products: https://www.mql5.com/en/users/trendhunter/seller
➖➖➖➖➖➖➖➖➖➖➖➖➖➖➖➖➖➖➖➖➖➖ - Version: 1.0
- Activations: 5
Pivot Tide — Wave Pivots, Auto Trend Lines and Line-Based Trend Direction
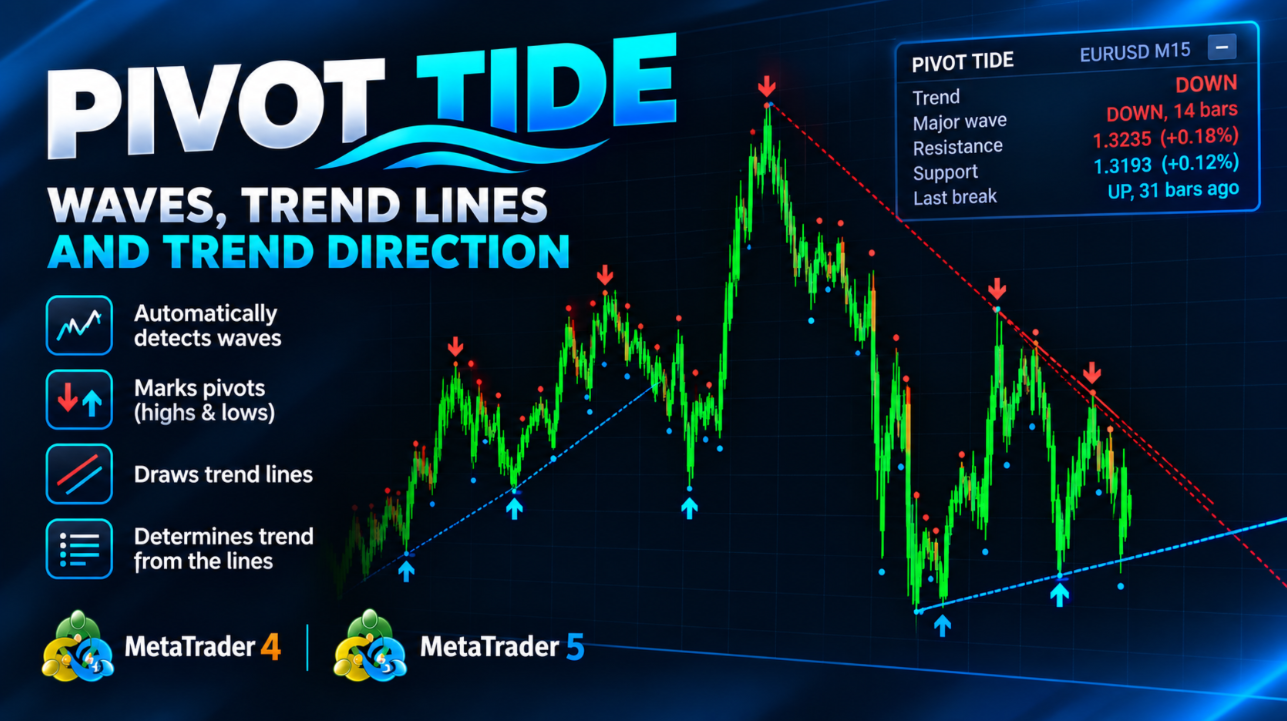
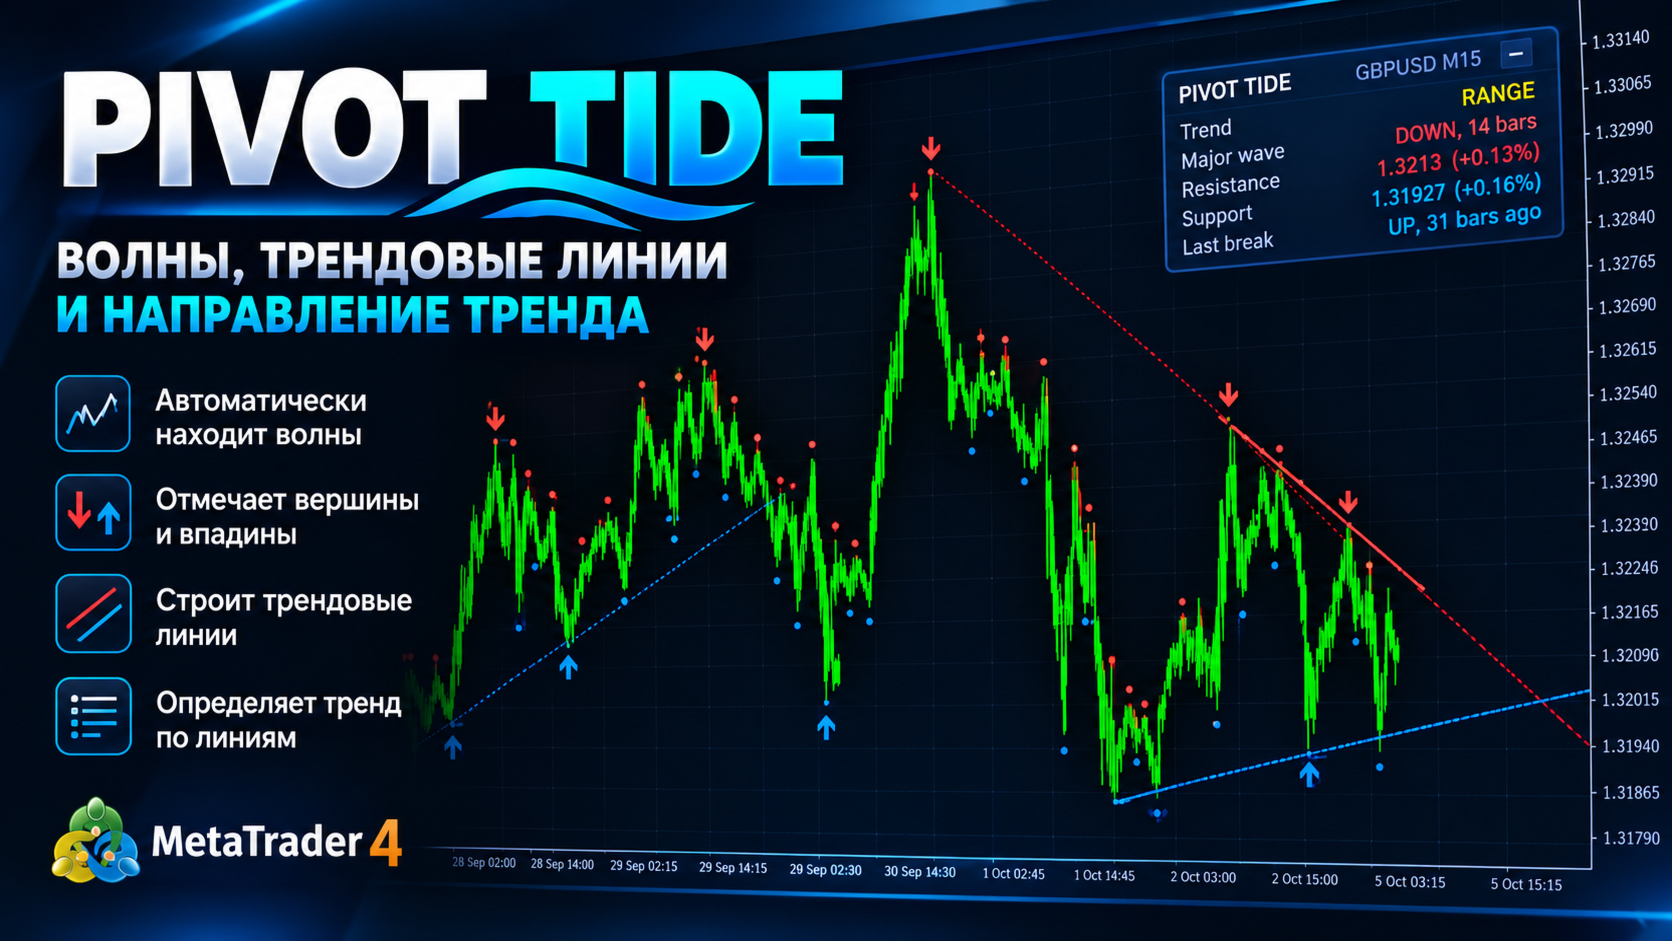
Pivot Tide is an indicator for MetaTrader 4 that automatically splits the chart into waves, marks wave tops and bottoms, builds trend lines through them, and determines the trend direction from the state of those lines. Everything is drawn directly on the chart, together with a compact info panel.
It works on any symbol and any timeframe.
MT4-version: https://www.mql5.com/en/market/product/199656
What it does
- Detects waves. A wave is defined by the relationship between two moving averages: a fast SMA and a slow LWMA. While the fast average is above the slow one, an up-wave is in progress; while it is below, a down-wave is in progress.
- Marks pivots. When a wave ends (the averages cross), the indicator places a marker on its extreme: the high of an up-wave or the low of a down-wave.
- Builds trend lines through pairs of consecutive pivots.
- Tracks line breakouts. If price closes beyond a line, the line is considered broken and is cut at the breakout bar.
- Determines the trend from the lines and shows it on the panel (UP, DOWN or RANGE).
Waves are calculated on two levels: major (large waves, default length 70) and minor (small waves, default length 21).
What you see on the chart
Pivot markers
- Red arrow pointing down above a candle: major peak (local high).
- Blue arrow pointing up below a candle: major trough (local low).
- Small red and blue dots: the same for minor waves (can be turned off).
Trend lines
- Resistance line (red) goes through the last two peaks when the second peak is lower than the first.
- Support line (blue) goes through the last two troughs when the second trough is higher than the first.
- An unbroken line is extended to the right.
- A broken line is cut at the breakout bar and becomes dotted. Such lines stay on the chart as history.
- The main lines are built from major waves. Lines from minor waves can be enabled separately (they are thinner and dashed).
Colors (red for peaks and resistance, blue for troughs and support) can be changed in the settings.
How the trend is determined
The trend is determined from the two current lines, resistance and support, built from the latest pairs of pivots.
| State of the lines | Trend on the panel |
|---|---|
| Both lines are alive (price is squeezed between them) | RANGE: squeeze, consolidation |
| Only the support line is alive | UP: uptrend |
| Only the resistance line is alive | DOWN: downtrend |
| No live lines | Direction of the last line breakout |
The logic is simple: a breakout above a resistance line shows buyer strength, and a breakout below a support line shows seller strength.
Info panel
The panel shows:
- Trend: current trend (UP, DOWN or RANGE);
- Major wave: direction of the current major wave and how many bars it has lasted;
- Resistance: current resistance line level and the distance to it in percent;
- Support: the same for the support line;
- Last break: direction of the last line breakout and how many bars ago it happened.
The panel can be dragged with the mouse (by its top row) and minimized with the - / + button. Its position and state are remembered for each chart. By default it sits at the top center of the chart; the starting coordinates are set in the inputs. The panel can be turned off completely.
Inputs
| Input | Default | Description |
|---|---|---|
| MQL5.com account | author's profile link | Informational field, does not affect the indicator |
| Major wave length | 70 | Length of major waves. Higher value: fewer pivots and larger waves |
| Minor wave length | 21 | Length of minor waves. Lower value: more frequent markers |
| Show minor pivots | yes | Show minor pivots (small dots) |
| Draw trend lines (major) | yes | Draw lines based on major waves |
| Draw trend lines for minor waves | no | Additionally draw lines based on minor waves |
| Lines kept per side | 4 | How many latest resistance and support lines to keep on the chart |
| Extend unbroken lines to the right | yes | Extend unbroken lines to the right |
| Bullish color | blue | Color of troughs and support lines |
| Bearish color | red | Color of peaks and resistance lines |
| Show info panel | yes | Show the info panel |
| Panel X | -1 | Horizontal panel position in pixels (-1 = centered) |
| Panel Y | 22 | Vertical panel position in pixels from the top (-1 = centered) |
| Alert on trend change | no | Pop-up alert when the trend changes |
| Push notification on trend change | no | Push notification to your phone when the trend changes |
| Bars to analyze | 1500 | How many bars of history to analyze (fewer: faster) |
How to use it
- Read the context. Look at the panel: UP and DOWN show the trend direction based on the lines, RANGE means a squeeze and waiting for a breakout.
- Trade around the lines. A live support or resistance line is a zone where price may react. A breakout (a close beyond the line) signals a change in price behavior.
- Breakout entries. Many traders wait for a candle close beyond the line and then for confirmation, for example a retest of the broken line.
- Use it as a filter. The line-based trend can filter your own system: trade only in the direction of UP or DOWN and skip RANGE.
- Tune the sensitivity. Lower Major wave length and Minor wave length values produce more frequent but less significant pivots. Higher values produce fewer and larger waves. Adjust them to your symbol and timeframe.
- Higher timeframes give more reliable lines than lower ones.
- Notifications. Enable Alert on trend change or Push notification on trend change so you don't have to watch the chart all the time.
Good to know
- A pivot is confirmed only after the moving averages cross, so a marker appears with a delay relative to the actual extreme. This is the price for confirmed markers that do not disappear or move.
- The indicator does not provide ready-made trading signals and is not a trading system. It is a tool for analyzing market structure. Use it together with your own entry, exit and risk management rules.
- Calculation is performed once per new bar, so the indicator is light on resources.
- Trading financial markets involves risk of loss.
Data for Expert Advisors (iCustom)
The indicator has 4 buffers:
| Buffer | Content |
|---|---|
| 0 | Major peaks |
| 1 | Major troughs |
| 2 | Minor peaks |
| 3 | Minor troughs |
Empty value: EMPTY_VALUE . A buffer holds a value only on the bar where a pivot is located.