PivotTide MT5

Pivot Tide — Pivots de vagues, lignes de tendance automatiques et direction de la tendance basée sur les lignes

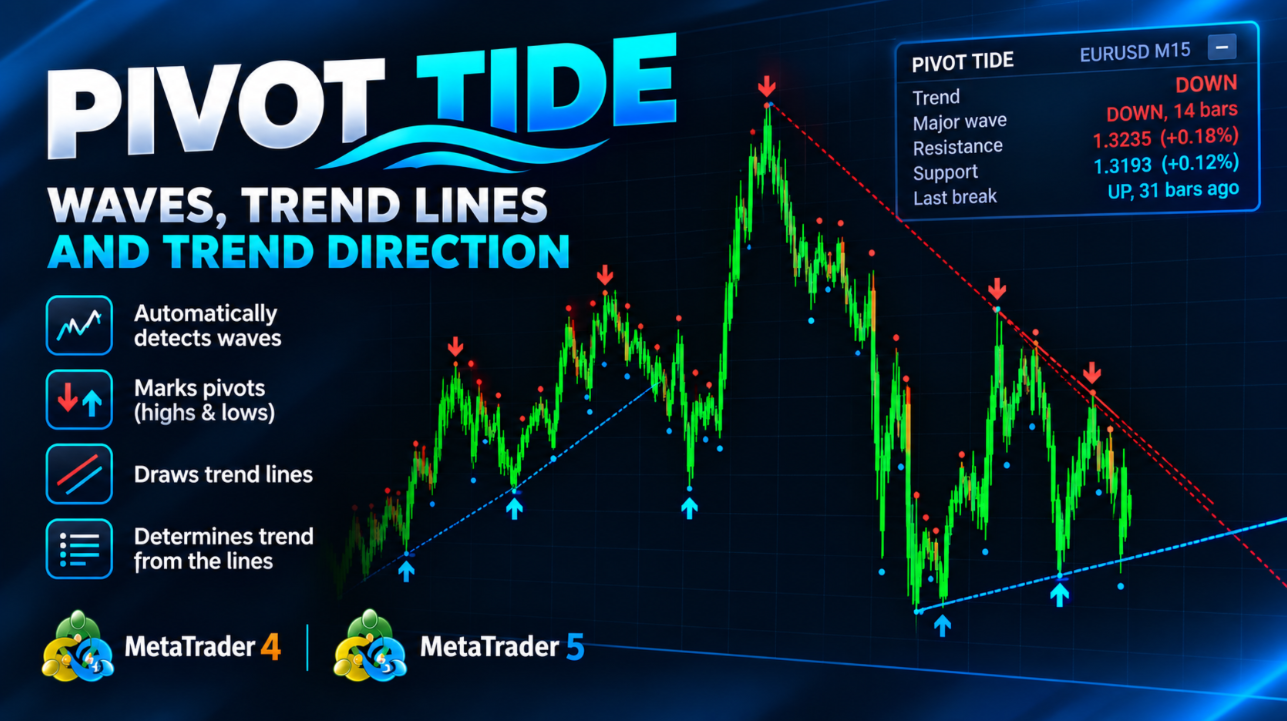
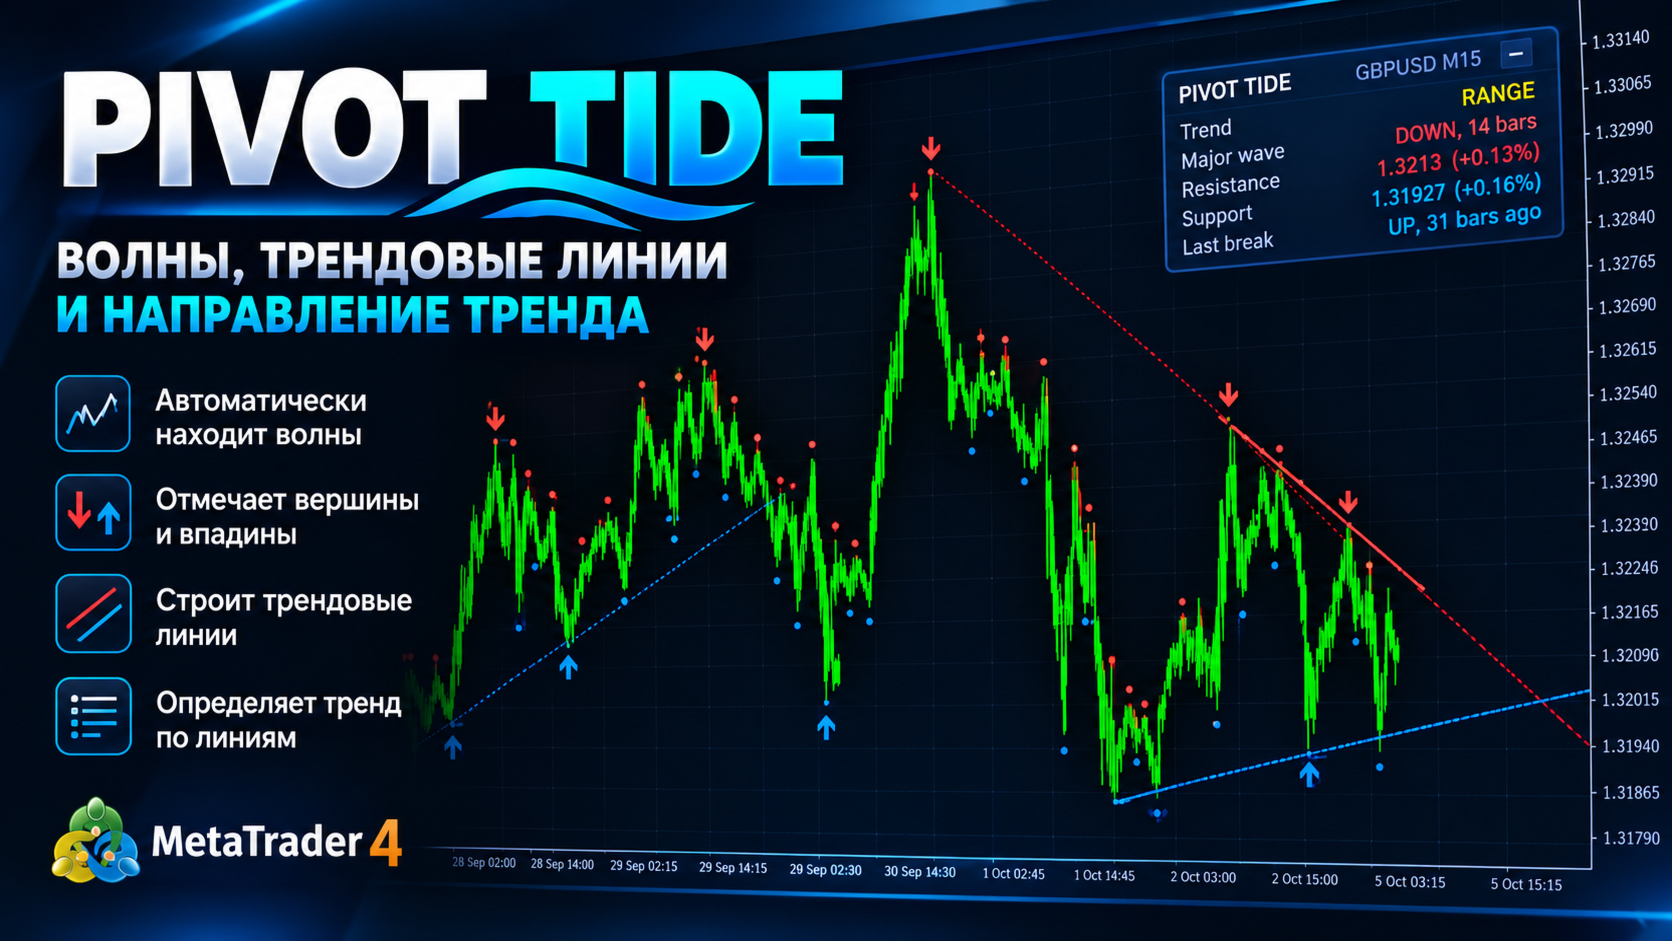
Pivot Tide est un indicateur pour MetaTrader 4 qui découpe automatiquement le graphique en vagues, marque les sommets et les creux de chaque vague, trace des lignes de tendance à travers eux et détermine la direction de la tendance à partir de l'état de ces lignes. Tout est affiché directement sur le graphique, avec un panneau d'informations compact.

Il fonctionne sur n'importe quel symbole et sur n'importe quelle unité de temps.

MT4-version: https://www.mql5.com/en/market/product/199656

Ce qu'il fait

  1. Détecte les vagues. Une vague est définie par la relation entre deux moyennes mobiles : une SMA rapide et une LWMA lente. Tant que la moyenne rapide est au-dessus de la lente, une vague haussière est en cours ; tant qu'elle est en dessous, une vague baissière est en cours.
  2. Marque les pivots. Lorsqu'une vague se termine (les moyennes se croisent), l'indicateur place un marqueur sur son extrême : le plus haut d'une vague haussière ou le plus bas d'une vague baissière.
  3. Trace des lignes de tendance à travers des paires de pivots consécutifs.
  4. Suit les cassures des lignes. Si le prix clôture au-delà d'une ligne, celle-ci est considérée comme cassée et est coupée à la bougie de la cassure.
  5. Détermine la tendance à partir des lignes et l'affiche dans le panneau (UP, DOWN ou RANGE).

Les vagues sont calculées à deux niveaux : majeures (grandes vagues, longueur par défaut 70) et mineures (petites vagues, longueur par défaut 21).

Ce que vous voyez sur le graphique

Marqueurs de pivots

  • Flèche rouge vers le bas au-dessus d'une bougie : sommet majeur (plus haut local).
  • Flèche bleue vers le haut sous une bougie : creux majeur (plus bas local).
  • Petits points rouges et bleus : la même chose pour les vagues mineures (peuvent être désactivés).

Lignes de tendance

  • La ligne de résistance (rouge) passe par les deux derniers sommets lorsque le second sommet est plus bas que le premier.
  • La ligne de support (bleue) passe par les deux derniers creux lorsque le second creux est plus haut que le premier.
  • Une ligne non cassée est prolongée vers la droite.
  • Une ligne cassée est coupée à la bougie de la cassure et devient pointillée. Ces lignes restent sur le graphique à titre d'historique.
  • Les lignes principales sont construites à partir des vagues majeures. Les lignes des vagues mineures peuvent être activées séparément (elles sont plus fines et en tirets).

Les couleurs (rouge pour les sommets et la résistance, bleu pour les creux et le support) peuvent être modifiées dans les paramètres.

Comment la tendance est déterminée

La tendance est déterminée à partir des deux lignes actuelles, résistance et support, construites à partir des dernières paires de pivots.

État des lignes Tendance dans le panneau
Les deux lignes sont actives (le prix est comprimé entre elles) RANGE : compression, consolidation
Seule la ligne de support est active UP : tendance haussière
Seule la ligne de résistance est active DOWN : tendance baissière
Aucune ligne active Direction de la dernière cassure d'une ligne

La logique est simple : une cassure au-dessus d'une ligne de résistance montre la force des acheteurs, et une cassure sous une ligne de support montre la force des vendeurs.

Panneau d'informations

Le panneau affiche :

  • Trend : tendance actuelle (UP, DOWN ou RANGE) ;
  • Major wave : direction de la vague majeure actuelle et depuis combien de bougies elle dure ;
  • Resistance : niveau actuel de la ligne de résistance et distance jusqu'à celle-ci en pourcentage ;
  • Support : la même chose pour la ligne de support ;
  • Last break : direction de la dernière cassure d'une ligne et il y a combien de bougies elle s'est produite.

Le panneau peut être déplacé à la souris (par sa ligne supérieure) et réduit avec le bouton - / + . Sa position et son état sont mémorisés pour chaque graphique. Par défaut, il se place en haut au centre du graphique ; les coordonnées de départ se règlent dans les paramètres. Le panneau peut être complètement désactivé.

Paramètres

Paramètre Valeur par défaut Description
MQL5.com account lien vers le profil de l'auteur Champ informatif, n'affecte pas l'indicateur
Major wave length 70 Longueur des vagues majeures. Valeur plus élevée : moins de pivots et des vagues plus grandes
Minor wave length 21 Longueur des vagues mineures. Valeur plus basse : des marqueurs plus fréquents
Show minor pivots oui Afficher les pivots mineurs (petits points)
Draw trend lines (major) oui Tracer les lignes basées sur les vagues majeures
Draw trend lines for minor waves non Tracer en plus les lignes basées sur les vagues mineures
Lines kept per side 4 Nombre des dernières lignes de résistance et de support conservées sur le graphique (pour chaque côté)
Extend unbroken lines to the right oui Prolonger vers la droite les lignes non cassées
Bullish color bleu Couleur des creux et des lignes de support
Bearish color rouge Couleur des sommets et des lignes de résistance
Show info panel oui Afficher le panneau d'informations
Panel X -1 Position horizontale du panneau en pixels (-1 = centré)
Panel Y 22 Position verticale du panneau en pixels depuis le haut (-1 = centré)
Alert on trend change non Alerte contextuelle lors d'un changement de tendance
Push notification on trend change non Notification push sur le téléphone lors d'un changement de tendance
Bars to analyze 1500 Nombre de bougies de l'historique analysées (moins : plus rapide)

Comment l'utiliser

  • Lire le contexte. Regardez le panneau : UP et DOWN indiquent la direction de la tendance d'après les lignes, RANGE signifie compression et attente d'une cassure.
  • Trader autour des lignes. Une ligne de support ou de résistance active est une zone où le prix peut réagir. Une cassure (une clôture au-delà de la ligne) signale un changement du comportement du prix.
  • Entrées sur cassure. De nombreux traders attendent la clôture d'une bougie au-delà de la ligne, puis une confirmation, par exemple un retest de la ligne cassée.
  • L'utiliser comme filtre. La tendance basée sur les lignes peut filtrer votre propre système : tradez uniquement dans le sens de UP ou DOWN et ignorez RANGE.
  • Ajuster la sensibilité. Des valeurs plus faibles de Major wave length et Minor wave length produisent des pivots plus fréquents mais moins significatifs. Des valeurs plus élevées produisent des vagues moins nombreuses et plus grandes. Adaptez-les à votre symbole et à votre unité de temps.
  • Les unités de temps élevées donnent des lignes plus fiables que les basses.
  • Notifications. Activez Alert on trend change ou Push notification on trend change pour ne pas avoir à surveiller le graphique en permanence.

Bon à savoir

  • Un pivot n'est confirmé qu'après le croisement des moyennes mobiles, le marqueur apparaît donc avec un retard par rapport à l'extrême réel. C'est le prix à payer pour des marqueurs confirmés qui ne disparaissent pas et ne se déplacent pas.
  • L'indicateur ne fournit pas de signaux de trading prêts à l'emploi et n'est pas un système de trading. C'est un outil d'analyse de la structure du marché. Utilisez-le avec vos propres règles d'entrée, de sortie et de gestion du risque.
  • Le calcul est effectué une fois par nouvelle bougie, l'indicateur est donc peu gourmand en ressources.
  • Le trading sur les marchés financiers comporte un risque de perte.

Données pour les Expert Advisors (iCustom)

L'indicateur possède 4 buffers :

Buffer Contenu
0 Sommets majeurs
1 Creux majeurs
2 Sommets mineurs
3 Creux mineurs

Valeur vide : EMPTY_VALUE . Un buffer ne contient une valeur que sur la bougie où se trouve un pivot.
Produits recommandés
Product Name: FXmans Pro SMC Structure Description: Navigate the markets with institutional precision. FXmans Pro SMC Structure is an advanced, algorithmically optimized indicator designed to decode Smart Money Concepts (SMC) directly on your chart. Built on a highly secure and lightweight engine, this tool avoids the lag of standard pivot points by utilizing Bill Williams' Fractal logic for laser-accurate market structure mapping. Whether you are a day trader or a swing trader, this indicator f
The Vix_Fix indicator, or "Vix Fix," is a tool designed to identify potential market bottoms. It operates on the principle of measuring extreme fear or pessimism among the crowd, which are moments when the market often has a high probability of reversing to the upside. Main Purpose: To help traders find high-probability BUY (Long) entry points by identifying when the market is "oversold." How it Works In simple terms, the Vix Fix measures the distance between the current bar's Low and the Highes
FREE
Combo KS Fibonacci Trendline & Price Alarm Il s'agit d'un indicateur d'alerte multifonction pour MetaTrader 5 qui regroupe trois types d'outils de tracé en une solution pratique : Caractéristiques principales Trois outils de tracé en un (tous dotés d'alertes intégrées au contact du prix) : Lignes de prix horizontales (alertes classiques de support/résistance) Lignes de tendance (déplaçables, inclinables) Outils de retracement/extension de Fibonacci (avec niveaux personnalisables) Alertes
Holiday Sales Zones Indicator The Zones Indicator is your everyday Trading tool that  leverages advanced algorithms, including ICT institutional concepts like order blocks , engulfing candle patterns , and Level interactions , to identify critical levels of supply and demand (Resistance & Support). Visual signals are generated and clearly marked on the chart, providing a straightforward guide for traders to spot key opportunities. Key Features Advanced Algorithmic Analysis : Identifies supply
It's a self-learning indicator. You need to set a starting time and download the relevant historical data for it to learn. Learn as few rules as possible and give the maximum freedom to the indicators. Therefore, the principle of choosing the best outcome during the learning period does not guarantee that every transaction is profitable. In general, the longer the study, the more reliable the results. In the strategy tester, you need to set the time parameter before the test starts so that the i
White label available. contact us for more info. dushshantharajkumar@gmail.com Chart Walker Smart Lines (CWSL)    by Chart Walker Smart Lines is a MetaTrader 5 (MT5) indicator that revolutionizes technical analysis by offering a suite of powerful features to enhance your trading experience. This intelligent tool is designed to automate various aspects of chart analysis, providing traders with valuable insights and saving time on manual tasks. Key Features Automatic Channel Drawing: Smart Lines
ZnalgoAiTrend
Zamin Mujtaba Zaidi
Here is a professional and compelling product description you can use directly for the MQL5 Market. It highlights the advanced mathematical logic under the hood while keeping it accessible for everyday traders. Znalgo Ai Trend: Advanced Dynamic Trend Tracker Znalgo Ai Trend is a professional-grade trend-following indicator engineered to track market momentum using a highly responsive, recursive ATR-stepping algorithm. Originally adapted from advanced quantitative TradingView models, this indica
LevelSketch Color Levels Drawing Tool LevelSketch Color Levels Drawing Tool est un indicateur professionnel de marquage manuel des graphiques pour MetaTrader 5. Il est conçu pour les traders qui souhaitent tracer rapidement et proprement des niveaux colorés , des zones de support et de résistance ainsi que des règles de mesure directement sur le graphique. Fonctions principales Cinq zones de couleur personnalisables Segments horizontaux courts de support et de résistance Règles de mesure bleues
Opening Range Breakouts MT5
Thushara Dissanayake
4.5 (4)
L'   indicateur Opening Range Breakouts   est un outil de trading basé sur les sessions, conçu pour les traders qui suivent les concepts de trading institutionnel, tels que   l'ICT (Inner Circle Trader), le Smart Money Concepts (SMC)   et les stratégies basées sur   le volume   ou   le flux d'ordres   . Cet indicateur trace les principaux intervalles d'ouverture de session, permettant aux traders d'identifier les potentiels   mouvements de liquidité, les zones de cassure, les fake outs   et   le
Unlock the power of Fibonacci with our advanced indicator! This tool precisely plots Fibonacci levels based on the previous day's high and low, identifying the next day's key support and resistance levels. Perfect for day trading and swing trading, it has consistently generated weekly profits for me. Elevate your trading strategy and seize profitable opportunities with ease. NOTE: In the Input section make sure the draw labels are set to "True" so you can see each levels.
WT Vwap Bands
Ricardo Almeida Branco
The WT Vwap Bands indicator is an indicator that combines price and volume, helping to show whether the price is within the "fair price", overbought or oversold. The indicator code was designed for performance and has already been tested in a real trading account. In addition to the visual inputs (color, thickness and line style), the user can define a% value that depends on the price. The default values work with the most distant band at 1% of the price and then dividing this distance in
Liquidity Magnet Map
Johan Adrian Nieto Resendiz
Liquidity Magnet Map Liquidity Magnet Map is a visual liquidity analysis indicator for MetaTrader 5. It identifies unswept liquidity pools around confirmed swing highs and swing lows, evaluates their relative importance and highlights the zone currently showing the strongest attraction potential. The indicator combines market structure, proximity, pool maturity, tick volume and momentum alignment into a composite scoring model. Each active zone receives a relative probability percentage, making
Candle Smart Range
Gianny Alexander Lugo Sanchez
5 (1)
Candle Smart Range (CSR) pour MetaTrader 5 Candle Smart Range est un indicateur technique conçu pour l'identification automatique des plages de prix sur plusieurs unités de temps. Cet outil analyse la structure du marché en se basant sur les formations de bougies et l'interaction du prix avec les plus hauts et plus bas précédents. Caractéristiques principales : Détection de Plages : Identifie les zones de consolidation avant les mouvements impulsifs. Identification des Fausses Cassures : Marque
Ultimate Double Top & Bottom (Pro Volume Matrix) Stop trading retail breakouts. Start trading Institutional Traps. The   Ultimate Double Top & Bottom   is not a standard, lagging pattern scanner. It is a highly advanced, non-repainting structural engine equipped with a proprietary   3-Leg Volume Matrix . Designed exclusively for Smart Money Concepts (SMC) and order flow traders, this indicator mathematically dissects the tick volume inside M and W patterns to reveal true institutional intent:  
LT Renko de Litoral Trading est une solution professionnelle complète pour la génération de graphiques Renko, intégrée à un panneau de trading visuel avancé. Conçu pour les traders qui souhaitent éliminer le bruit des graphiques temporels (chandeliers traditionnels), ce produit associe la précision d’un mouvement basé uniquement sur le prix à la rapidité d’exécution d’un panneau d’ordres professionnel haute performance. Avec deux modes de fonctionnement intégrés, LT Renko vous permet de générer
WT Vwap 5 Bands
Ricardo Almeida Branco
WT Vwap 5 Bands The WT Vwap Bands indicator is an indicator that combines price and volume, helping to show whether the price is within the "fair price", overbought or oversold. The indicator code was designed for performance and has already been tested in a real trading account. In addition to the visual inputs (color, thickness and line style), the user can define a% value that depends on the price. The default values work with the most distant band at 1% of the price and then dividing
SharperTrader Sync Indicator
Valeri Colisse Dos Santos Dieizo
SharperTrader Sync Indicator SharperTrader Sync Indicator was developed for traders seeking a professional and organized interface. It allows you to keep your price chart completely clean in one window while distributing your indicators and oscillators across separate windows, keeping them all 100% synchronized. Key Features: Clean Chart Focus: Trade with a clutter-free price chart by moving your oscillators to secondary windows without losing the connection between them. Symbol & Timeframe Sync
Rossi Campos Arrows Indicator
Heber Henrique Penow Campos
Rossi Campos Arrows Indicator – Tradez avec un indicateur qui fonctionne vraiment Si vous recherchez plus de clarté pour vos entrées et sorties de marché, cet indicateur est fait pour vous. J’ai développé un indicateur exclusif pour MetaTrader 5 qui combine deux des filtres techniques les plus respectés : les Bandes de Bollinger et le RSI — simultanément. L’algorithme fait tout le travail à votre place : Lorsqu’une véritable opportunité d’achat apparaît, une flèche verte s'affiche sur le graphiq
We often look for support and resistance points on the chart. One of the techniques that can be used is through the quantity of lots offered in the order book. This indicator searches for the largest lots in the order book and draws them on the graph in the form of lines, thereby obtaining where is the greatest concentration of lots offered on the centralized stock market at that time, thus configuring possible support and resistance lines. - The number of lines to draw can be defined by the u
The Rocket Trend indicator is trending. The indicator draws two-color points connected by lines along the chart. This is a trend indicator, it is an algorithmic indicator. It is easy to work and understand when a blue circle appears, you need to buy, when a red one appears, sell. The indicator is used for scalping and pipsing, and has proven itself well. Rocket Trend is available for analyzing the direction of the trend for a specific period of time. Ideal for novice traders learning the laws o
SBAHiLo
Umri Azkia Zulkarnaen
this is an indicator to clarify seeing Low and High in the market and is very useful for facilitating those who are studying technical price action this is a type of indicator that gives color to the candlestick where the indicator is divided into 3 colors red = bearish green = Bullish Gray = base this indicator can be used on the forex market or the mt5 binary market. https://t.me/SBA_FOREX_SIGNAL
Advanced Fibonacci
Marius Ovidiu Sunzuiana
Fibonacci Advanced Indicator – Precision Meets Intelligence The Fibonacci Advanced Indicator is a cutting-edge technical analysis tool designed for traders who demand more than conventional retracement levels. Built on the foundational principles of Fibonacci mathematics, this indicator transcends tradition by integrating dynamic market behavior , multi-timeframe analysis , and adaptive algorithms to deliver high-probability trading zones with surgical accuracy. 1. Multiple Fibonacci Levels
Un potente indicatore multifunzione progettato per offrire una visione chiara e strutturata della forza del mercato, integrando tre strumenti tecnici in un'unica interfaccia intuitiva:   Caratteristiche principali:   Heikin Ashi RSI Normalizzato Calcolato sul RSI di medie Heikin Ashi, centrato su una scala da -50 a +50 Visualizzazione con candele colorate (blu/rosso) per una lettura chiara della direzione e del momentum   Stocastico Modificato %K e %D convertiti sulla stessa scala -50/+50 Opzion
MFOP Market Forecast
Oscar Josue Pin Bacuzoy
Develop this indicator for periods of 30 minutes or more, focus on getting market trends right and making sure they are met. MFOP v8.1 gets straight to the point: it scans the market and tells you exactly when there is enough strength to enter a trade. This indicator doesn't do magic, it uses mathematical algorithms to filter out market noise, not enter into false breakouts and show you clear BUY (blue arrow) and SELL (red arrow) opportunities. It is designed and optimized specifically to take
Fibonacci Pips MT5 Instant Fibonacci Levels, Prices and Pip Distances Fibonacci Pips MT5 is a practical Fibonacci measurement tool for MetaTrader 5. It displays each Fibonacci level together with its exact price and pip distance, helping traders plan pullbacks, profit targets and stop-loss levels without manual calculations. Instead of seeing only percentages such as 38.2%, 50.0% or 61.8%, traders can immediately understand: The Fibonacci level The exact market price The pip distance from the re
Contact me for instruction, any questions! - Lifetime update free - Non-repaint - I just sell my products in Elif Kaya Profile, any other websites are stolen old versions, So no any new updates or support. Introduction Breakout Trend Scanner indicator works based on the Elliott Wave in technical analysis describes price movements in the financial market that are related to changes in trader sentiment and psychology and finds end of movement and breakout trend. The Elliott Wave pattern that is f
Gann S9 Pro Signals and Star
Mohamed Amr Mohamed Osama Abdelwahab
5 (1)
**Carré de Neuf de Gann 2 — Prévision Avancée Prix et Temps** Le Carré de Neuf est l'un des outils de prévision les plus puissants de W.D. Gann. Cet indicateur est une implémentation complète de deuxième génération pour MetaTrader 5, fondée directement sur le livre de Patrick Mikula. Il ajoute : barre d'outils interactive, panneau de signaux, diagramme étoile de Gann, zones de canal, statistiques d'angles, superpositions de zones moyennes et une interface en 12 langues. À partir d'un seul pri
Unlock powerful breakout opportunities The 123 Pattern is one of the most popular, powerful and flexible chart patterns. The pattern is made up of three price points: a bottom, a peak or valley, and a Fibonacci retracement between 38.2% and 71.8%. A pattern is considered valid when the price breaks beyond the last peak or valley, moment at which the indicator plots an arrow, rises an alert, and the trade can be placed. [ Installation Guide | Update Guide | Troubleshooting | FAQ | All Products  ]
1. Overview The Scalping PullBack Signal indicator is a powerful technical analysis tool designed to help traders identify scalping opportunities based on potential pullback and reversal signals. This tool is particularly useful on lower timeframes (below 15 minutes) but can also be applied on higher timeframes for longer-term trades. This indicator integrates several key analytical components, providing a comprehensive view of trends and potential entry/exit points, helping you make quick and e
FREE
Advanced Line Tools
Felipe Monteiro Rodrigues
Advanced Line Tools est un outil de dessin et de gestion de structures graphiques conçu pour rendre l'analyse dans MetaTrader 5 plus rapide, précise et organisée. Au-delà du simple dessin de lignes, l'indicateur permet de créer des structures interactives capables de reconnaître les bougies, les prix et les points importants du graphique. Grâce à une interface compacte directement sur le graphique, vous pouvez créer, modifier et gérer vos analyses sans devoir constamment passer d'un outil natif
Les acheteurs de ce produit ont également acheté
Trend Sniper X
Sarvarbek Abduvoxobov
4.9 (40)
Trend Sniper X est un indicateur de suivi de tendance multi-unités de temps pour MetaTrader 5 qui aide les traders à identifier la direction de la tendance et les points d'inversion potentiels avec clarté et précision. pour MT4: https://www.mql5.com/en/market/product/193245 Informations sur le prix : Le prix actuel est un prix promotionnel et est susceptible de changer lors des prochaines mises à jour et nouvelles fonctionnalités. Offre bonus : Pour obtenir GRATUITEMENT l'Auto-Trade Assistant E
Smart Trend Trading System — MetaTrader 5 Après votre achat, envoyez-moi un message sur MQL5 pour recevoir GRATUITEMENT Smart Universal Expert Advisor, ainsi que le cours en ligne, le manuel PDF et l’accès au groupe privé. STTS réunit la direction de la tendance, les signaux d’entrée et de sortie, les zones de retournement et les niveaux de prix importants directement sur votre graphique. Suivez le système manuellement ou connectez un EA compatible distinct pour une exécution automatique selon l
Zoryk Gold
Reda El Koutbane
5 (15)
ZORYK — Système avancé de signaux XAUUSD pour MetaTrader 5 Vous connaissez certainement cette sensation. Vous passez du temps à analyser l’or. Vous attendez le bon point d’entrée. Vous ouvrez enfin la position, puis le prix commence immédiatement à évoluer contre vous. Vous fermez trop tôt, déplacez le Stop Loss ou hésitez pendant quelques secondes. Ensuite, le marché atteint exactement l’objectif que vous aviez initialement prévu, mais sans vous dans la position. Le problème n’était pas toujour
SuperScalp Pro
Van Minh Nguyen
4.66 (35)
SuperScalp Pro - Professional Multi-Layer Confluence Scalping System SuperScalp Pro est un indicateur avancé de scalping qui améliore le Supertrend classique grâce à plusieurs filtres intelligents de confirmation. Il aide à identifier des opportunités de Buy/Sell présentant une probabilité plus élevée, tout en réduisant considérablement les faux signaux. Des flèches Buy et Sell claires apparaissent directement sur le graphique, tandis que les niveaux de Stop Loss et Take Profit basés sur l’ATR s
SMC Intraday Formula
VividMind Digital Solutions
5 (26)
Commençons par être honnêtes. Aucun indicateur ne vous rendra rentable à lui seul. Si quelqu’un vous dit le contraire, il vous vend un rêve. Tout indicateur qui affiche des flèches parfaites d’achat/vente peut être rendu impeccable — il suffit de zoomer sur la bonne partie de l’historique et de capturer uniquement les trades gagnants. Nous ne faisons pas cela.  SMC Intraday Formula est un outil. Il lit la structure du marché pour vous, identifie les zones de prix à la probabilité la plus élevée
Gann Made Easy   est un système de trading Forex professionnel et facile à utiliser qui est basé sur les meilleurs principes de trading en utilisant la théorie de mr. WD Gann. L'indicateur fournit des signaux d'ACHAT et de VENTE précis, y compris les niveaux Stop Loss et Take Profit. Vous pouvez échanger même en déplacement en utilisant les notifications PUSH. VEUILLEZ ME CONTACTER APRÈS L'ACHAT POUR RECEVOIR GRATUITEMENT DES INSTRUCTIONS DE TRADING ET D'EXCELLENTS INDICATEURS SUPPLÉMENTAIRES! V
Un nouveau Roi en ville - Indicateur + Gestion des ordres (TP1 + TP2 + TP3) + Envoi optionnel de signaux Telegram INCLUS (GRATUIT) (SYSTÈME COMPLET DE TRADING et DE SIGNAUX) Notre meilleur EA pour l’Or : Gold Slayer Cet indicateur inclut une stratégie avancée, un système de trading avec gestion des ordres personnalisable ainsi qu’un système de retour à la moyenne combinant des extensions d’enveloppes, soutenu par plusieurs filtres intelligents de confirmation comme le RSI afin de détecter des en
GoldenX Entry MT5
VividMind Digital Solutions
5 (16)
GoldenX Entry est un indicateur MT5 doté d’un algorithme adaptatif Smart Entry Trend, d’un système de scoring des signaux, d’un détecteur de régime de marché et d’un filtre de volatilité. Chaque signal inclut un niveau d’entrée calculé, trois niveaux de Take-Profit (TP1, TP2, TP3) ainsi qu’un niveau de Stop-Loss. Il est construit sur plusieurs couches analytiques conçues pour s’adapter à différentes conditions de marché, combinant un système analytique multicouche avec un optimiseur intégré et u
ARIPoint
Temirlan Kdyrkhan
1 (4)
ARIPoint is a powerful trading companion designed to generate high-probability entry signals with dynamic TP/SL/DP levels based on volatility. Built-in performance tracking shows win/loss stats, PP1/PP2 hits, and success rates all updated live. Key Features: Buy/Sell signals with adaptive volatility bands Real-time TP/SL/DP levels based on ATR Built-in MA Filter with optional ATR/StdDev volatility Performance stats panel (Success, Profit/Loss, PP1/PP2) Alerts via popup, sound, push, or email Cu
Auto Optimized SpeedAngle est un système de vectorisation du momentum de niveau institutionnel qui élimine l'ajustement de courbe ( curve-fitting ) grâce à une optimisation continue par avancement ( Walk-Forward Optimization , WFO). Plutôt que de s'appuyer sur des entrées statiques qui se dégradent lorsque les régimes de marché changent, l'indicateur recalibre dynamiquement ses paramètres en utilisant une validation hors échantillon ( Out-of-Sample , OOS), garantissant ainsi que les signaux affi
Neuro Poseidon MT5
Daria Rezueva
4.75 (52)
Neuro Poseidon is a new indicator by Daria Rezueva. It combines precise trading signals with adaptive TP/SL levels - creating best possible trades as a result! Message me and get  Neuro Poseidon Assistant  as a gift to automize your trading process! What makes it stand out? 1. Proven profitability on all assets and timeframes 2. Only confirmed BUY and SELL signals present on the chart 3. Adaptive TP & SL levels generated by the software for each trade 4. Easy to understand - suitable for al
La légende est de retour : Entry Points Pro 10. La relance de l'indicateur légendaire qui s'est maintenu 3 ans dans le Top-3 du MQL5 Market. Des centaines d'avis enthousiastes (589 sur les deux versions), des milliers de traders l'utilisent chaque jour, 31 000+ téléchargements de la démo   MT4+MT5 . J'ai lu chacun de vos avis publiés en cinq ans — et au lieu de promettre, j'ai intégré les réponses directement dans la version 10. Par un auteur présent sur les marchés depuis 1999, qui tient à l'ho
FiboSniper Pro
Van Minh Nguyen
5 (3)
FiboSniper Pro – Multi-Filter Fibonacci System with Auto SL/TP and Control Panel FiboSniper Pro est un indicateur technique qui combine des Fibonacci Envelopes dynamiques avec plusieurs filtres de confirmation afin de générer des signaux Buy et Sell sélectionnés. Les niveaux de Fibonacci sont calculés à partir de Moving Average et ATR, puis filtrés par ADX, EMA, RSI, ATR, Volume, Time et la structure des bougies. L’indicateur affiche directement sur le graphique les niveaux automatiques de Stop
Welcome to ENTRY IN THE ZONE AND SMC MULTI TIMEFRAME  SPECIAL BENEFIT / FOR OUR MQL5 CUSTOMERS FREE ACCESS TO THE NEW TOOL  — COMING SOON — Learn more on our official website  : https://www.fableedge.net Entry In The Zone and SMC Multi Timeframe is a real-time market analysis tool based on Smart Money Concepts (SMC) , designed to analyze market structure, price direction, and key trading zones. It supports both Single-Timeframe and Multi-Timeframe Analysis , providing a clearer view of overall m
Unix Scalper
Issam Kassas
4 (4)
Unix Scalper — MetaTrader 5 Après votre achat, envoyez-moi un message sur MQL5 pour recevoir GRATUITEMENT Smart Universal Expert Advisor, ainsi que le cours en ligne, le manuel PDF et l’accès au groupe privé. Repérez la configuration. Consultez le plan. Choisissez comment intervenir. UNIX Scalper réunit l’analyse du marché, les décisions BUY/SELL/WAIT et les niveaux Entry, Stop Loss, TP1 et TP2 dans un panneau organisé. VISUALISEZ LE SIGNAL ET LE PLAN • Des décisions claires : BUY, SELL ou WAIT.
M1 Sniper MT5
Oleg Rodin
5 (7)
M1 SNIPER   est un système d'indicateurs de trading facile à utiliser. Il s'agit d'un indicateur à flèche conçu pour l'unité de temps M1. Cet indicateur peut être utilisé seul pour le scalping sur l'unité de temps M1 ou intégré à votre système de trading existant. Bien que conçu spécifiquement pour le trading sur l'unité de temps M1, ce système peut également être utilisé avec d'autres unités de temps. Initialement, j'avais conçu cette méthode pour le trading du XAUUSD et du BTCUSD. Cependant, j
Tokyo mt5 Indicator
Vasiliy Strukov
5 (7)
Le Tokyo Indicator offre une vue d'ensemble visuelle et claire de l'orientation de la tendance, des signaux de trading potentiels et des conditions du marché. Sa ligne de tendance en escalier, codée par couleur, distingue les phases haussières (en bleu) des phases baissières (en magenta). Des flèches directionnelles associées mettent en évidence les opportunités d'achat et de vente potentielles lors des changements de tendance. Un tableau de bord intégré regroupe le signal actuel, l'orientation
FX Trend MT5 NG
Daniel Stein
5 (6)
FX Trend NG : La Nouvelle Génération d’Intelligence de Tendance Multi-Marchés Vue d’ensemble FX Trend NG est un outil professionnel d’analyse de tendance multi-timeframe et de surveillance des marchés. Il vous permet de comprendre la structure complète du marché en quelques secondes. Au lieu de naviguer entre de nombreux graphiques, vous identifiez immédiatement quels instruments sont en tendance, où le momentum s’affaiblit et où plusieurs unités de temps sont alignées. Offre de Lancement – Ob
Adaptive Price Action Engine Achetez un indicateur, obtenez l'EA gratuitement Analyse auto-optimisée des tendances et des figures de chandeliers Multi-Timeframe Les marchés évoluent constamment, et tous les modèles de Price Action n’ont pas la même valeur dans toutes les conditions de marché. Adaptive Price Action Engine a été conçu pour s’adapter aux changements du marché en combinant structure de tendance, analyse Multi-Timeframe, figures de chandeliers et optimisation statistique au sein d’un
Smart Price Action Concepts — MetaTrader 5 Après votre achat, envoyez-moi un message sur MQL5 pour recevoir GRATUITEMENT Smart Universal Expert Advisor, ainsi que le cours en ligne, le manuel PDF et l’accès au groupe privé. Observez la structure. Identifiez les zones. Construisez votre plan de trading. Réunissez Smart Money Concepts (SMC), analyse de style ICT et action des prix sur un graphique organisé. Identifiez la structure du marché, les blocs d’ordres, les niveaux de référence de liquidit
Power Candles MT5
Daniel Stein
4.58 (12)
Power Candles V3 - Indicateur de force à optimisation automatique Power Candles V3 transforme la force des devises et des instruments en un plan de trading exploitable sur chaque graphique auquel il est associé. Au lieu de se contenter de colorer les bougies, il effectue une optimisation automatique en temps réel en arrière-plan et vous fournit les meilleurs niveaux de Stop Loss, Take Profit et seuils de signal pour le symbole que vous avez sous les yeux. Un simple clic suffit pour l'adopter en
Market Structure Order Block Dashboard MT5 est un indicateur MT5 conçu pour les traders qui veulent lire la structure de marché et les principales zones de réaction du prix directement sur le graphique. Il combine BOS, ChoCH, Order Blocks, Fair Value Gaps (FVG), Liquidité, Kill Zones, Volume Profile, et un dashboard compact pour une analyse rapide. Cet indicateur s'adresse aux traders qui utilisent la structure de marché, les concepts ICT et Smart Money comme cadre de décision. Il peut aider à r
Scalper Vault   est un système de scalpage professionnel qui vous fournit tout ce dont vous avez besoin pour un scalpage réussi. Cet indicateur est un système de trading complet qui peut être utilisé par les traders de forex et d'options binaires. Le délai recommandé est M5. Le système vous fournit des signaux fléchés précis dans le sens de la tendance. Il vous fournit également des signaux supérieurs et inférieurs et des niveaux de marché Gann. Les indicateurs fournissent tous les types d'alert
Atomic Analyst MT5
Issam Kassas
4.47 (60)
Atomic Analyst — MetaTrader 5 Après votre achat, envoyez-moi un message sur MQL5 pour recevoir GRATUITEMENT Smart Universal Expert Advisor, ainsi que le cours en ligne, le manuel PDF et l’accès au groupe privé. Atomic Analyst réunit l’action des prix, la direction de la tendance, les signaux d’entrée et de sortie, le Stop Loss et plusieurs niveaux de Take Profit directement sur votre graphique. REPÉREZ LE SIGNAL. COMPRENEZ LA CONFIGURATION. Atomic Analyst présente son analyse sous forme d’inform
FX Power MT5 NG
Daniel Stein
5 (33)
FX Power : Analysez la force des devises pour des décisions de trading plus intelligentes Aperçu FX Power est l'outil essentiel pour comprendre la force réelle des principales devises et de l'or, quelles que soient les conditions du marché. En identifiant les devises fortes à acheter et les faibles à vendre, FX Power simplifie vos décisions de trading et révèle des opportunités à forte probabilité. Que vous suiviez les tendances ou anticipiez les retournements à l'aide de valeurs extrêmes de D
Divergence Bomber
Ihor Otkydach
4.89 (94)
Chaque acheteur de cet indicateur reçoit également gratuitement : L’outil exclusif « Bomber Utility », qui accompagne automatiquement chaque opération de trading, fixe les niveaux de Stop Loss et de Take Profit, et clôture les positions selon les règles de la stratégie Des fichiers de configuration (set files) pour adapter l’indicateur à différents actifs Des set files pour configurer le Bomber Utility selon différents modes : « Risque Minimum », « Risque Équilibré » et « Stratégie d’Attente »
Crystal Heikin Ashi Signals
Muhammad Jawad Shabir
5 (4)
Crystal Heikin Ashi Signals—Professional Trend & Signal Detection Indicator Advanced Heikin Ashi Visualization with Intelligent Signal System for Manual & Automated Trading Final Price: $149 ---------> Price goes up $10 after every 10 sales . Limited slots available — act fast . Overview User Guide PDF Crystal Heikin Ashi Signals is a professional-grade MetaTrader 5 indicator that combines pure Heikin Ashi candle visualization with an advanced momentum-shift detection system. Designed for both m
DayTrader PRO
Davit Beridze
5 (4)
DayTrader PRO DayTrader PRO est un indicateur de trading avancé qui combine le filtre Laguerre de John Ehlers avec un puissant moteur d'auto-optimisation. Au lieu d'utiliser des paramètres fixes, l'indicateur recherche automatiquement les meilleurs réglages en fonction des conditions récentes du marché, vous aidant à vous adapter à la volatilité changeante sans ajustements manuels constants. L'indicateur génère des signaux clairs d'ACHAT (BUY) et de VENTE (SELL), accompagnés de niveaux de Stop L
Quant Direction MT5
Georgios Kalomoiropoulos
Quant Direction est un outil d'analyse de marché 3D. Il fournit une analyse de marché parfaitement objective, basée sur un algorithme, en calculant des écarts précis en pourcentage sur différents paramètres. Développé à l'aide d'outils de modélisation avancés basés sur l'IA et soumis à des tests rigoureux, cet algorithme analyse le marché avec une précision inégalée. Vous pouvez analyser n'importe quelle paire de devises ou instrument financier sur la plateforme. Que vous pratiquiez le trading à
Smc Pro ToolKit
Talal N Z Aljarusha
5 (13)
SMC PRO TOOLKIT — SMART MONEY ANALYSIS & STRUCTURED TRADE PLANNING SMC Pro ToolKit is a professional Smart Money Concepts analysis workspace for MetaTrader 5. It combines market structure, multi-timeframe analysis, institutional price zones, setup evaluation, confirmation tools, volume context, alerts, and risk planning inside one organized chart environment. One workspace. Multiple layers of confirmation. One structured trading plan. OPEN COMPLETE USER GUIDE MULTI-CONDITION SETUP ENGINE At
Plus de l'auteur
L'indicateur calcule les zones d'arrêt / d'inversion de tendance les plus probables, les zones de mouvement de tendance confiantes. Le calcul considère : le taux de variation des prix ; l'angle de déviation relative de la carte ; l'amplitude moyenne des mouvements de prix ; le prix sortant de sa « zone de confort » ; les valeurs de l'indicateur ATR. L'indicateur peut générer une alerte lorsque le prix entre dans une zone d'arrêt/d'inversion. Paramètres Dessiner toute la longueur ? - tracer l
Buy and sell zones
Evgeniy Zhdan
5 (2)
Indicator for determining flat and trend. If the price is below any of the two histograms and two lines (red and blue), this is a sell zone. When purchasing this version of the indicator, MT5 version for one real and one demo account - as a gift (to receive, write me a private message)! If the price is above any of the two histograms and two lines (red and blue), this is a buy zone. MT5 version:  https://www.mql5.com/en/market/product/70409 If the price is between two lines or in the zone of
SuperTrend
Evgeniy Zhdan
2.5 (2)
The Supertrend Expert Advisor The Supertrend Expert Advisor with averaging elements. It has been developed during three months until I finally got good results. It is not a scalper. The minimum balance to start trading - 100 $. Is automatically adjusted to the 4 and 5-digit prices. Has an efficient risk management system. The lot and limit on the maximum lot is automatically calculated based on the settings specified in the EA. As a result, you have a complete automated trading system. Download
Stardust
Evgeniy Zhdan
StarDust searches for divergences in the values of several indicators considering them as signs of flat and enters the market if a relatively steady trend is detected. The Expert Advisor trades "basic" symbols with a low spread. The best results are achieved on М15. The EA automatically adjusts to 4 and 5-digit quote flows. Settings Comment_to_orders – comment to a placed order. The field can be left blank if no comment is required. MM – enable money management with automatic setting of a worki
Top Floor
Evgeniy Zhdan
The EA catches the price when it moves against the trend in an effort to open an order in an opposite direction (direction of the main trend). Screenshots illustrate examples of entries and the strategy gist. The EA uses stop losses depending on values of ATR. Settings: Lot_ - if Risk_ = 0, the EA will trade this lot; Risk_ - risk per one trade. Stop loss is taken into account; koeff_ATR - coefficient multiplied by the ATR value to calculate stop loss (the bigger the value, the bigger stop loss
FastBoom
Evgeniy Zhdan
The FastBoom EA finds the most probable points of price pullback/reverse and places an order. It places averaging orders if the price moves further against take profit. Settings of the EA: Lots - initial lot; LotExponent - multiplier for following orders (Martingale). 1 - no multiplier. TakeProfit - take profit in points; Stochastic Settings InpKPeriod - K Period of Stochastic InpDPeriod - D Period of Stochastic InpSlowing - Stochastic Slowing LevHigh - level for sell positions of Stochastic L
The Expert Advisor calculates the double/triple divergence of volumes, and starts trading. It uses a unique formula of lot calculation, which greatly improves stability of trading. Recommended TF - 1h. Currency pair - EURUSD , but the EA can be used on any trading instruments which are not subject to high volatility. Settings mode - trading direction can be set manually; close - order close level (details on the screenshot); Step between orders - step between orders in points; Maximum orders -
OrderOnLine
Evgeniy Zhdan
The Expert Advisor opens orders from the horizontal line, the a trader can set on any level by dragging using the mouse or by changing the line properties. For example, when a horizontal line is above the current price, the EA will open a Buy order once the horizontal line is reached. And vice versa: If the line is below the current price, the EA will open a sell order once the line is crossed. A buy crossover of the line is: opening of the current candlestick below the horizontal line; the curr
SellerATR
Evgeniy Zhdan
5 (1)
The Expert Advisor only sells. Recommended currency pairs : EURUSD; GBPUSD; USDCHF; USDJPY; USDCAD; AUDUSD; EURGBP; EURAUD; EURCHF; EURJPY; GBPCHF; CADJPY; GBPJPY; AUDNZD; AUDCAD; AUDCHF; AUDJPY; CHFJPY; EURNZD; EURCAD; CADCHF; NZDJPY; NZDUSD. Timeframe: H1. Percent% manages closing both loss-making and profitable deals based on the account overall status. Using the EA on 23 symbols mentioned above allows the robot to cope with the drawdown in case of a long trend. While positions on some pairs
Illusion
Evgeniy Zhdan
3 (2)
The Illusion EA uses the probability theory - after a series of consecutive virtual losses - i.e. right during a flat the EA already starts trading in the trend. In addition, the EA considers the ratio of bullish/bearish candles on the higher timeframes to determine the greatest probability of the price movement direction. Only 1 order can be opened at a time. In case of a loss the following order will be placed with an increased lot (the multiplication coefficient is set in the parameters). The
The indicator plots a trend line and determines the levels for opening trades, in case the price goes "too far" away from the trend level. More detailed information is available in the screenshots. Settings Away from the trend line - distance from the trend line to the trades level; Arrow Signal for deals - enable displaying an arrow when the price reaches the trades level; Size of Arrow - size of the arrow; Alert Signal for deals - enable generating alerts when the price reaches the trades lev
Turbina
Evgeniy Zhdan
5 (4)
The axiom of the Forex market is that any trend will be broken. The Expert Advisor determines trend direction (the pink line), and calculates levels for opening opposite orders depending on the settings. The value of Away from the trend line for Deal will be different for each pair and timeframe, depending on the volatility of the trading instrument. Next orders can be opened with an increased lot (a static lot is used by default). See the screenshots to understand the idea of the Expert Advisor
Odysseus
Evgeniy Zhdan
The Expert Advisor determines the moments of strong movements and opens a position in the direction of the most probable price movement. The strategy always uses stop loss and take profit. Several independent orders can be in the market (the maximum number is set in parameters). The goal of the EA's underlying trading system is the quantitative excess of the number of profitable deals over the number of losing ones. Recommended: EURUSD 5m; GBPUSD 5m; USDJPY 5m. The Expert Advisor is able to work
Vise
Evgeniy Zhdan
Vise is a trend indicator. The upper and lower lines follow the price showing the prevailing price direction. Frequent breakthroughs of the upper line indicate a bullish trend, while frequent breakthroughs of the lower line indicate a bearish one. Parameters Points for UpLine - initial number of points for the upper line; Points for DownLine - initial number of points for the lower line. During the breakthrough of the upper level (line), this level shifts upwards by Points for UpLine. If the up
Twinkle
Evgeniy Zhdan
Twinkle is a trend-based scalper using stop loss and take profit invisible to the broker. The EA does not look for trend reversals. The EA catches strong market movements and opens orders in the direction of the trend. Your broker will not see the order closing levels. The EA closes orders independently when reaching the take profit or stop loss levels specified in the settings. Recommended trading symbols: EURUSD M5, GBPUSD M5. ECN accounts with 5 digits quotes are recommended. Expert Advisor
Shine
Evgeniy Zhdan
4.75 (4)
This Expert Advisor implements elements of the Martingale system. Orders are opened at a specified distance from the moving average. The Parabolic SAR indicator and certain technical details are used to ensure the most accurate entries. The EA is highly customizable. It is recommended for simultaneous use on 4 currency pairs: EURUSD M15; GBPUSD M15; USDJPY M15; USDCAD M15. Despite good stability, it is advisable to disable the EA operation during the days rich in news releases. Configurations P
LuckyCase
Evgeniy Zhdan
LuckyCase is an Expert Advisor with martingale elements. The EA strategy is based on a significant "deviation" of the price from SAR inadicator and the Bands levels breakthrough point. The money management system is an essential part of the EA. It starts working after a trade is opened. Trades are closed after accumulating specified points of market orders, by deposit % or after an opposite side of the channel is broken through. The default EA settings are meant for: EURUSD M15; USDJPY M15. The
Elize
Evgeniy Zhdan
The Elize Expert Advisor has been designed to work with the EURCHF currency pair. It considers the peculiarities of this trading instrument, its behavior and dependence on the behavior of other currencies. In particular, when the currencies of the European countries (EURUSD, GBPUSD, EURNOK, EURCHF) move in the same direction, the EA starts its operation and opens a deal in the trend direction of the European currencies. In the event of price rollbacks, the EA uses a unique method for making the
AllTrendLines
Evgeniy Zhdan
4 (1)
Brief Description of the All Trend Lines Indicator The indicator analyzes the wave structure of the market. What it displays on the chart: First. Wave pivots (semaphores) • Red markers – wave highs • Yellow markers – wave lows • Yellow-green markers – additional local extremes Second. Trend lines • Purple/blue lines – trends based on highs (resistance/support) • Beige/green lines – trends based on lows • Lines are built automatically by connecting wave pivots of the same type Third. Main trend
FastTraffic
Evgeniy Zhdan
The Expert Advisor has been specifically developed for trading gold (Spot Gold). The strategy is based on Fibo levels calculated from the previous (first) candle High/Low and the width of the current and lower timeframes channel. If important Fibo levels of different orders are located in a single price channel (within a spread), the EA defines this channel as the target for price movement and starts operation. Martingale and averaging are not used. Each order is independent and is accompanied b
Jazz
Evgeniy Zhdan
The algorithm of this Expert Advisor determines the significant price levels, where the trend often turns into a flat or reverses. Stochastic Oscillator serves as an additional filter of overbought/oversold zones. The EA sets stop loss and take profit after opening an order. The underlying trailing strategy applies a trailing stop. The EA is recommended for simultaneously use on three trading instruments: EURUSD M5, GBPUSD M5, EURCHF M5. Settings: Comment to order - comment to orders. MaxRisk -
Panther
Evgeniy Zhdan
The Expert Advisor looks for technical analysis patterns formed on the higher (hourly) timeframe to start working on the 5-minute chart. Technical analysis patterns used: double top/double bottom, head/shoulders, flag, expanding/narrowing triangles. The Relative Vigor Index technical indicator is used as the filter for opening deals. It is based on the idea that on the bull market the closing price is, as a rule, higher, than the opening price. It is the other way round on the bear market. This
Spook
Evgeniy Zhdan
The Expert Advisor calculates the divergence on the current and higher timeframes. In case the divergences coincide, the EA starts its operation. Deals have strict take profit and stop loss levels. Each deal is managed by trailing stop. The strategy involves the use of a tight stop-loss. Therefore, losing deals and/or series of losing deals are not uncommon. This EA is not suitable for those who have difficulties coping with losing deals. The EA is recommended for simultaneous use on the followi
Grand
Evgeniy Zhdan
The Expert Advisor has been developed specifically for the features of the CHFJPY currency pair. The EA's algorithm determines the direction of the current trend and starts operation. In case of a price reversal within the current trend, the EA adds additional orders. If trend changes, the EA starts to work in the direction contrary to the initial grid of orders. If there were no conditions for closing orders and the trend direction changed again, the EA continues to work with the "first" grid o
Intensive
Evgeniy Zhdan
The Expert Advisor algorithm determines on daily charts those candlestick patterns, which set the intraday trading direction. The trading EA determines how long the price is moving in overbought/oversold zones and starts working in the direction of the expected trend movement. Each position is accompanied with a tight stop loss and take profit. Only one active position can be open in the market. The EA was developed and tested using 99% quality quotes. The Expert Advisor has a built-in news filt
Slender
Evgeniy Zhdan
The strategy of this Expert Advisor is based on a hedging system, which implies placing opposite orders. The EA algorithm determines trend beginning and opens a position in the trend direction. In case of a wrong entry, the EA tries to neutralize the drawdown through opposite (hedging) orders at a preset interval (Coefficient of counter orders). Orders are closed when one of the two values ​​is reached - profit in percent or profit in points. The EA does not use lot increase. The EA wast tested
Dreamer
Evgeniy Zhdan
Советник работает по принципу хеджирования с периодическими "перекосами" в сторону трендовых направлений. Направления тренда советник определяет на основании стандартного индикатора Parabolic Stop and Reverse system (SAR). Уникальная стратегия установки балансирующих позиций позволяет избегать больших просадок даже при самых не благоприятных рыночных условиях. Параметры по умолчанию рекомендуется использовать на торговом инструменте: GBPJPY 15m. Разработка и оптимизация параметров производились
Snoot
Evgeniy Zhdan
5 (1)
This Expert Advisor works using a grid in the direction of a trend movement with the step between opened positions defined in the settings. The positions are closed by the total take profit. The Parabolic SAR standard indicator is used to filter order opening, which comes in the MetaTrader 4 package. The EA has been developed and tested using 99,9% quality of quotes. Operation of the EA in real time can be viewed in the signals . The best trading results have been achieved on CHFJPY M15. Settin
Solipsism
Evgeniy Zhdan
The Expert Advisor builds channels based on the data obtained using ATR and MA indicators according to the equations: Upper channel border = MA + ATR * (FIBO); Lower channel border = MA - ATR * (FIBO), where FIBO has the following values: Style of Trade - Aggressive = 1.61852; Style of Trade - Average = 3.26704; Style of Trade - Calm = 4.85556. Trades are opened inside the channel with the intervals defined in the settings. Long and short positions are opened independently. Positions are closed
The trading statistics indicator notifies the trader of the aggregate income of the trading account for different time intervals. The indicator has wide display settings on the graph. There is a choice of one of the two display languages on the chart- English and Russian. Settings Indicator language (ENG, RUS) - Select the language to display on the chart; To control the magic (-1: any magic) - Entering the Magic for control (-1: any Magic); Angle of indicator tie - Selecting the angle of the c
Filtrer:
Aucun avis
Répondre à l'avis