PivotTide MT5

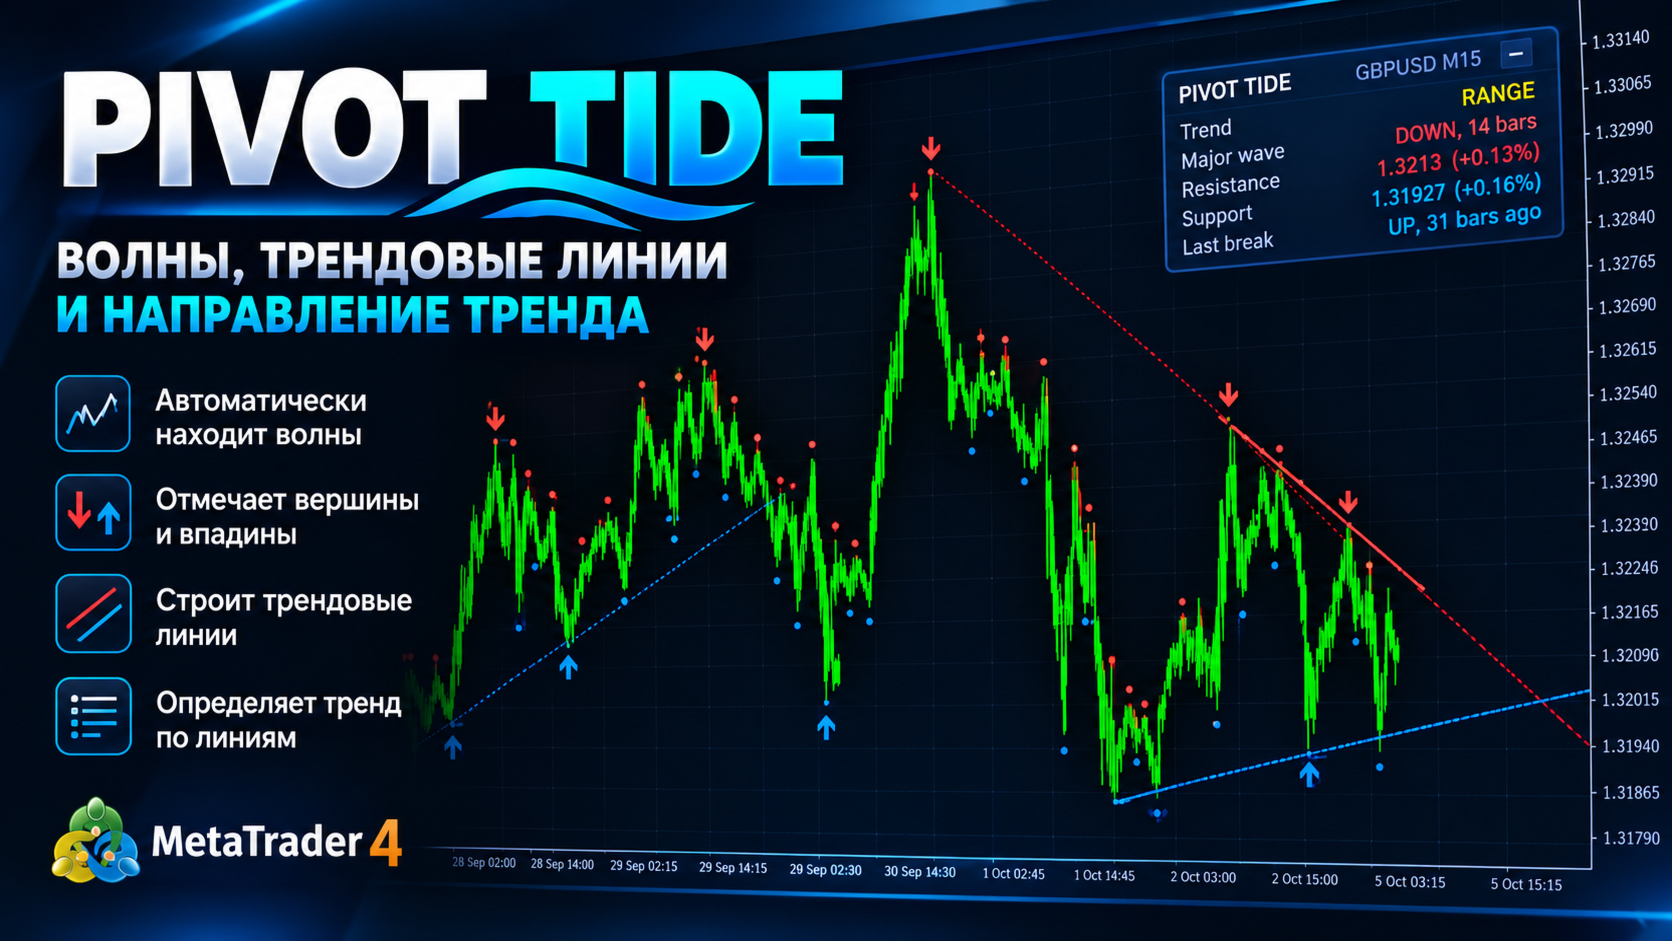
Pivot Tide — ウェーブのピボット、自動トレンドライン、ラインに基づくトレンド方向の判定

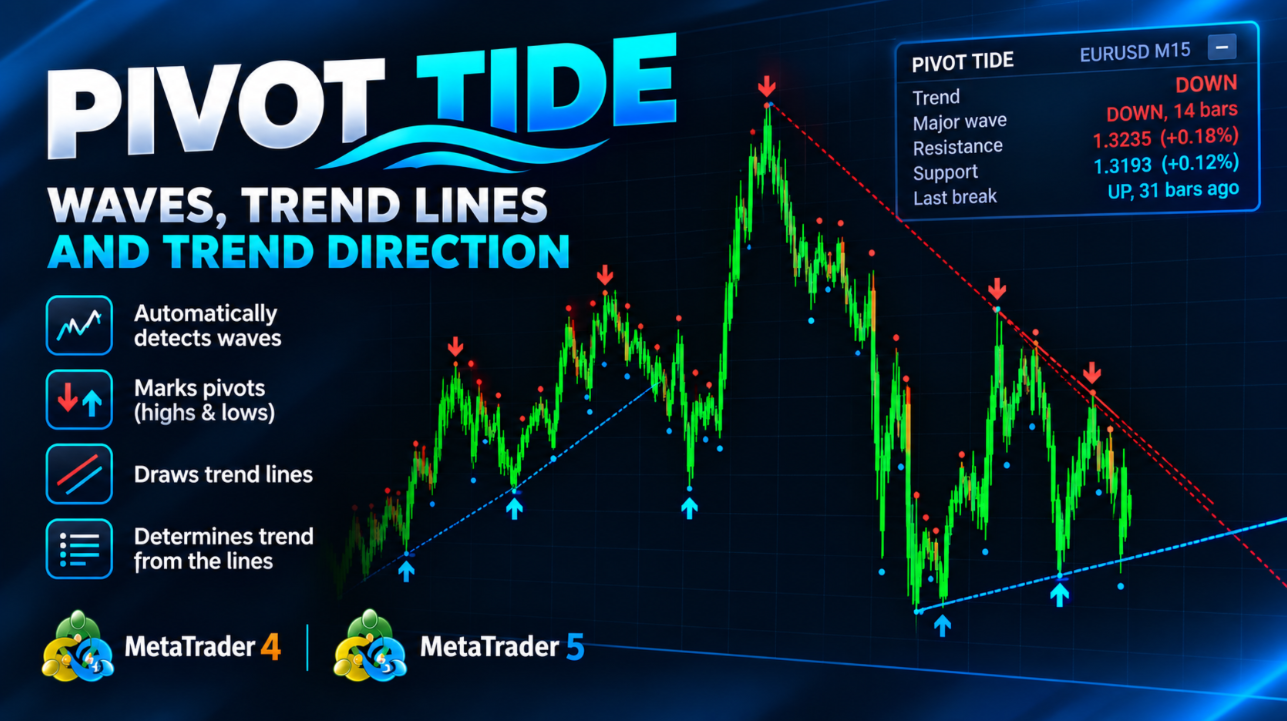
Pivot Tide は MetaTrader 4 用のインディケータです。チャートを自動的にウェーブに分割し、各ウェーブの高値と安値にマーカーを付け、それらを結んでトレンドラインを引き、ラインの状態からトレンドの方向を判定します。すべてチャート上に直接表示され、コンパクトな情報パネルも備えています。

あらゆる銘柄、あらゆる時間足で動作します。

MT4-version: https://www.mql5.com/en/market/product/199656

機能

  1. ウェーブを検出します。 ウェーブは 2 本の移動平均線の関係で定義されます。短期の SMA と長期の LWMA です。短期線が長期線の上にある間は上昇ウェーブ、下にある間は下降ウェーブです。
  2. ピボットをマークします。 ウェーブが終了すると(移動平均線が交差すると)、その極値にマーカーを置きます。上昇ウェーブの高値、または下降ウェーブの安値です。
  3. トレンドラインを引きます。 連続する同種のピボット 2 点を結びます。
  4. ラインのブレイクを監視します。 価格がラインの外側で終値を付けると、そのラインはブレイクされたものとみなされ、ブレイクしたローソク足で切られます。
  5. ラインからトレンドを判定し、パネルに表示します(UP、DOWN、RANGE)。

ウェーブは 2 つのレベルで計算されます。メジャー(大きなウェーブ、デフォルトの長さ 70)とマイナー(小さなウェーブ、デフォルトの長さ 21)です。

チャート上の表示

ピボットマーカー

  • ローソク足の上の赤い下向き矢印:メジャーなピーク(ローカルの高値)。
  • ローソク足の下の青い上向き矢印:メジャーなトラフ(ローカルの安値)。
  • 赤と青の小さなドット:マイナーウェーブの同様のピボット(非表示にできます)。

トレンドライン

  • レジスタンスライン(赤):直近 2 つのピークのうち、2 つ目が 1 つ目より低い場合に、その 2 点を通ります。
  • サポートライン(青):直近 2 つのトラフのうち、2 つ目が 1 つ目より高い場合に、その 2 点を通ります。
  • ブレイクされていないラインは右方向に延長されます。
  • ブレイクされたラインは、ブレイクしたローソク足で切られ、点線になります。こうしたラインは履歴としてチャートに残ります。
  • メインのラインはメジャーウェーブから作られます。マイナーウェーブのラインは個別に有効にできます(細い破線で表示されます)。

色(ピークとレジスタンスは赤、トラフとサポートは青)は設定で変更できます。

トレンドの判定方法

トレンドは、直近のピボットのペアから作られた 2 本の現在のライン(レジスタンスとサポート)から判定されます。

ラインの状態 パネルのトレンド
両方のラインが有効(価格が 2 本の間に挟まれている) RANGE:収束、持ち合い
サポートラインのみ有効 UP:上昇トレンド
レジスタンスラインのみ有効 DOWN:下降トレンド
有効なラインがない 最後のラインブレイクの方向

考え方はシンプルです。レジスタンスラインを上抜けるブレイクは買い手の強さを示し、サポートラインを下抜けるブレイクは売り手の強さを示します。

情報パネル

パネルには次の項目が表示されます。

  • Trend:現在のトレンド(UP、DOWN、RANGE)
  • Major wave:現在のメジャーウェーブの方向と、継続しているバーの本数
  • Resistance:現在のレジスタンスラインの価格と、そこまでの距離(パーセント)
  • Support:サポートラインについての同様の情報
  • Last break:最後のラインブレイクの方向と、何本前のバーで発生したか

パネルはマウスでドラッグでき(最上段をつかみます)、 - / + ボタンで最小化できます。位置と状態はチャートごとに記憶されます。デフォルトではチャートの上部中央に表示され、初期座標はパラメータで設定できます。パネルは完全に非表示にもできます。

パラメータ

パラメータ デフォルト 説明
MQL5.com account 作者のプロフィールへのリンク 情報表示用の欄で、インディケータの動作には影響しません
Major wave length 70 メジャーウェーブの長さ。大きいほどピボットが少なく、ウェーブが大きくなります
Minor wave length 21 マイナーウェーブの長さ。小さいほどマーカーが頻繁に出ます
Show minor pivots はい マイナーピボット(小さなドット)を表示します
Draw trend lines (major) はい メジャーウェーブに基づくラインを描画します
Draw trend lines for minor waves いいえ マイナーウェーブに基づくラインも追加で描画します
Lines kept per side 4 チャートに残すレジスタンスラインとサポートラインの直近の本数(それぞれ)
Extend unbroken lines to the right はい ブレイクされていないラインを右方向に延長します
Bullish color 青 トラフとサポートラインの色
Bearish color 赤 ピークとレジスタンスラインの色
Show info panel はい 情報パネルを表示します
Panel X -1 パネルの水平位置(ピクセル、-1 = 中央)
Panel Y 22 パネルの上端からの垂直位置(ピクセル、-1 = 中央)
Alert on trend change いいえ トレンドが変化したときにポップアップアラートを表示します
Push notification on trend change いいえ トレンドが変化したときにスマートフォンへプッシュ通知を送ります
Bars to analyze 1500 分析する過去のバーの本数(少ないほど高速)

使い方

  • 相場の背景を把握する。 パネルを確認します。UP と DOWN はラインに基づくトレンドの方向を示し、RANGE は収束してブレイクを待っている状態を示します。
  • ライン周辺で取引する。 有効なサポートラインやレジスタンスラインは、価格が反応しやすいゾーンです。ブレイク(ラインの外側での終値)は、価格の動きの変化を示すサインです。
  • ブレイクでのエントリー。 多くのトレーダーは、ローソク足がラインの外側で確定するのを待ち、その後、ブレイクしたラインへのリテストなどの確認を待ちます。
  • フィルターとして使う。 ラインに基づくトレンドを、ご自身のシステムのフィルターとして使えます。UP または DOWN の方向にのみ取引し、RANGE は見送ります。
  • 感度を調整する。 Major wave length と Minor wave length を小さくすると、ピボットは頻繁になりますが重要度は下がります。大きくすると、ウェーブは少なく大きくなります。銘柄と時間足に合わせて調整してください。
  • 上位の時間足のほうが、下位の時間足よりも信頼性の高いラインになります。
  • 通知。 Alert on trend change または Push notification on trend change を有効にすると、常にチャートを見続ける必要がなくなります。

ご注意

  • ピボットは移動平均線が交差した後にはじめて確定するため、実際の極値よりも遅れてマーカーが表示されます。これは、確定したマーカーが消えたり動いたりしないことの代償です。
  • このインディケータはそのまま使える売買シグナルを提供するものではなく、売買システムでもありません。相場の構造を分析するためのツールです。ご自身のエントリー、エグジット、リスク管理のルールと併せてご使用ください。
  • 計算は新しいバーごとに 1 回だけ行われるため、動作は軽量です。
  • 金融市場での取引には損失のリスクが伴います。

EA 向けのデータ(iCustom)

インディケータには 4 つのバッファがあります。

バッファ 内容
0 メジャーなピーク
1 メジャーなトラフ
2 マイナーなピーク
3 マイナーなトラフ

空の値は EMPTY_VALUE です。バッファに値が入るのは、ピボットがあるバーだけです。

おすすめのプロダクト
Product Name: FXmans Pro SMC Structure Description: Navigate the markets with institutional precision. FXmans Pro SMC Structure is an advanced, algorithmically optimized indicator designed to decode Smart Money Concepts (SMC) directly on your chart. Built on a highly secure and lightweight engine, this tool avoids the lag of standard pivot points by utilizing Bill Williams' Fractal logic for laser-accurate market structure mapping. Whether you are a day trader or a swing trader, this indicator f
The Vix_Fix indicator, or "Vix Fix," is a tool designed to identify potential market bottoms. It operates on the principle of measuring extreme fear or pessimism among the crowd, which are moments when the market often has a high probability of reversing to the upside. Main Purpose: To help traders find high-probability BUY (Long) entry points by identifying when the market is "oversold." How it Works In simple terms, the Vix Fix measures the distance between the current bar's Low and the Highes
FREE
KS Fibonacci Trendline Price Alarm Combo これは、3種類の描画ツールを1つの便利なパッケージに統合した、MetaTrader 5(MT5)用の多機能アラートインジケーターです。 主な機能 3-in-1 描画ツール(すべて価格接触アラート機能を内蔵): 水平価格ライン(定番のサポート/レジスタンス・アラート) トレンドライン(ドラッグ移動・傾斜変更が可能) フィボナッチ・リトレースメント/エクステンション・ツール(レベル設定のカスタマイズが可能) 価格がラインやレベルに接触した際のスマートアラート機能: サウンドアラート(MT5標準音またはカスタム.wavファイル) ポップアップアラートウィンドウ モバイルプッシュ通知 視覚的フィードバック(トリガー後にラインやレベルの色がグレーに変化) 主要な機能 すべてのツールを作成・管理するための統合コントロールパネル ワンクリック作成ボタン:「+ 新規アラートライン」「+ 新規トレンドライン」「+ 新規フィボナッチ」 ドラッグによるオブジェクトの完全な移動(MT5標準の操作性)
Holiday Sales Zones Indicator The Zones Indicator is your everyday Trading tool that  leverages advanced algorithms, including ICT institutional concepts like order blocks , engulfing candle patterns , and Level interactions , to identify critical levels of supply and demand (Resistance & Support). Visual signals are generated and clearly marked on the chart, providing a straightforward guide for traders to spot key opportunities. Key Features Advanced Algorithmic Analysis : Identifies supply
It's a self-learning indicator. You need to set a starting time and download the relevant historical data for it to learn. Learn as few rules as possible and give the maximum freedom to the indicators. Therefore, the principle of choosing the best outcome during the learning period does not guarantee that every transaction is profitable. In general, the longer the study, the more reliable the results. In the strategy tester, you need to set the time parameter before the test starts so that the i
White label available. contact us for more info. dushshantharajkumar@gmail.com Chart Walker Smart Lines (CWSL)    by Chart Walker Smart Lines is a MetaTrader 5 (MT5) indicator that revolutionizes technical analysis by offering a suite of powerful features to enhance your trading experience. This intelligent tool is designed to automate various aspects of chart analysis, providing traders with valuable insights and saving time on manual tasks. Key Features Automatic Channel Drawing: Smart Lines
Here is a professional and compelling product description you can use directly for the MQL5 Market. It highlights the advanced mathematical logic under the hood while keeping it accessible for everyday traders. Znalgo Ai Trend: Advanced Dynamic Trend Tracker Znalgo Ai Trend is a professional-grade trend-following indicator engineered to track market momentum using a highly responsive, recursive ATR-stepping algorithm. Originally adapted from advanced quantitative TradingView models, this indica
LevelSketch Color Levels Drawing Tool LevelSketch Color Levels Drawing Tool は、MetaTrader 5 向けの手動チャートマーキング用プロフェッショナルインジケーターです。 カラーレベル、サポート・レジスタンス領域、測定ルーラーをチャート上に素早く見やすく描画したいトレーダー向けに設計されています。 主な機能 5つのカスタマイズ可能なカラーゾーン 短い水平サポート / レジスタンスライン 青色 / 赤色の測定ルーラー コンパクトなオンチャートツールバー 内蔵カラー設定パネル 18色の拡張カラーパレット チャートオブジェクトの表示 / 非表示 最後のオブジェクトを元に戻す LevelSketch オブジェクトをすべて削除 折りたたみ可能なツールバー 水平ラインの固定機能 水平ラインの最小長:20本 カラー設定 Color Settings パネルでは Z1、Z2、Z3、Z4、Z5、L-S、L-R、M-B、M-R の色をすばやく変更できます。 使用方法 カラーゾーンで重要な価格帯をマークし、L-S / L-R で
オープニングレンジブレイクアウトインジケーターは 、ICT(インナーサークルトレーダー)、スマートマネーコンセプト(SMC)、 ボリューム または オーダーフロー ベースの戦略といった機関投資家の取引コンセプトに従うトレーダー向けに設計されたセッションベースの取引ツールです。このインジケーターは重要なセッションオープニングレンジをプロットし、トレーダーが主要な世界為替セッション全体にわたって潜在的な 流動性スイープ、ブレイクアウトゾーン、フェイクアウト、 そして 重要な日中レベル を特定できるようにします。 この戦略は 、オープニングレンジの概念に基づいています。これは、 各セッションの開始後に事前に定義されたタイムボックスであり、トレーダーがマーケットメーカーの意図、短期的なバイアス、日中の方向性を判断するのに役立ちます。このインジケーターは、レンジの高値と安値をマークし、それらのレベルを拡大することで、 スマートマネーブレイクアウト 、 セッションスイープ 、 フォールスブレイクアウト 、 フェアバリューギャップ(FVG)   、 レンジ拡大を 視覚的に監視するのに役立ちます。 こ
Unlock the power of Fibonacci with our advanced indicator! This tool precisely plots Fibonacci levels based on the previous day's high and low, identifying the next day's key support and resistance levels. Perfect for day trading and swing trading, it has consistently generated weekly profits for me. Elevate your trading strategy and seize profitable opportunities with ease. NOTE: In the Input section make sure the draw labels are set to "True" so you can see each levels.
WT Vwap Bands
Ricardo Almeida Branco
The WT Vwap Bands indicator is an indicator that combines price and volume, helping to show whether the price is within the "fair price", overbought or oversold. The indicator code was designed for performance and has already been tested in a real trading account. In addition to the visual inputs (color, thickness and line style), the user can define a% value that depends on the price. The default values work with the most distant band at 1% of the price and then dividing this distance in
Liquidity Magnet Map
Johan Adrian Nieto Resendiz
Liquidity Magnet Map Liquidity Magnet Map is a visual liquidity analysis indicator for MetaTrader 5. It identifies unswept liquidity pools around confirmed swing highs and swing lows, evaluates their relative importance and highlights the zone currently showing the strongest attraction potential. The indicator combines market structure, proximity, pool maturity, tick volume and momentum alignment into a composite scoring model. Each active zone receives a relative probability percentage, making
Candle Smart Range
Gianny Alexander Lugo Sanchez
5 (1)
MetaTrader 5用 Candle Smart Range (CSR) Candle Smart Rangeは、複数のタイムフレームで価格レンジを自動的に識別するためのテクニカル指標です。このツールは、ローソク足の形成と、以前の高値・安値との相互作用に基づいて市場構造を分析します。 主な機能: レンジ検出: 勢いのある動きの前のコンソリデーション(保ち合い)ゾーンを特定します。 だまし(フェイクアウト)の識別: 価格が以前の水準を超えたものの、ローソク足の終値基準でレンジ内に戻った場合をマークします。 マルチタイムフレーム分析: カスタム期間を含む最大19のタイムフレームのデータを1つのチャートに表示します。 内部可視化(ズーム): チャートを切り替えずに、上位足のローソク足内部の値動きを確認できます。 時間フィルター: 主要な市場セッションなど、特定の時間帯で動作するように設定可能です。 履歴確認モード: 過去のデータをステップバイステップで確認し、分析できます。 アラート機能: ローソク足の確定や新しいレンジの検出を通知します。 インターフェース: 視覚的な負荷を管理する画面
Ultimate Double Top & Bottom (Pro Volume Matrix) Stop trading retail breakouts. Start trading Institutional Traps. The   Ultimate Double Top & Bottom   is not a standard, lagging pattern scanner. It is a highly advanced, non-repainting structural engine equipped with a proprietary   3-Leg Volume Matrix . Designed exclusively for Smart Money Concepts (SMC) and order flow traders, this indicator mathematically dissects the tick volume inside M and W patterns to reveal true institutional intent:  
Litoral Trading の LT Renko は、Renko チャート生成機能と高度なビジュアル取引パネルを統合した、完全なプロフェッショナル向けソリューションです。時間足チャート(従来のローソク足)に含まれるノイズを排除したいトレーダー向けに設計されており、価格の動きだけに基づく正確性と、高性能なプロ仕様の取引パネルによる高速執行を組み合わせています。 2つの統合された動作モードにより、LT Renko は最大限の精度でカスタムチャートを生成し、その生成されたチャート上で、クリック執行、キーボードショートカット(ホットキー)、注文の視覚的な配置、リスク管理を直接行うことができます。 実際の動作 Renko ジェネレーターモード(オフライン): ベース銘柄の M1 バー履歴、または実際のティックデータをカスタムオフラインチャートに変換します。チャートはシステムによって自動的に作成・表示され、ティックごとのリアルタイム更 新を維持しながら、形成中のボックス、ヒゲ、そして任意のギャップ補完(ゴーストボックス / ghost boxes)を表示します。 取引モード(トレーデ
WT Vwap 5 Bands The WT Vwap Bands indicator is an indicator that combines price and volume, helping to show whether the price is within the "fair price", overbought or oversold. The indicator code was designed for performance and has already been tested in a real trading account. In addition to the visual inputs (color, thickness and line style), the user can define a% value that depends on the price. The default values work with the most distant band at 1% of the price and then dividing
SharperTrader Sync Indicator
Valeri Colisse Dos Santos Dieizo
SharperTrader Sync Indicator SharperTrader Sync Indicator was developed for traders seeking a professional and organized interface. It allows you to keep your price chart completely clean in one window while distributing your indicators and oscillators across separate windows, keeping them all 100% synchronized. Key Features: Clean Chart Focus: Trade with a clutter-free price chart by moving your oscillators to secondary windows without losing the connection between them. Symbol & Timeframe Sync
Rossi Campos Arrows Indicator – 本当に機能するインジケーターで取引を強化 マーケットへのエントリーやエグジットをもっと明確にしたいなら、このインジケーターはあなたのためのものです。 MetaTrader 5 用に、ボリンジャーバンドと RSI を同時に組み合わせた独自インジケーターを開発しました。 アルゴリズムがすべての重い分析作業を行います: 実際の買いチャンスが現れたとき、チャートに緑の矢印が表示されます。 売りのタイミングでは赤い矢印が表示されます。 シンプルで、分かりやすく、視覚的です。 なぜこれほど効果的なのか? 2つのインジケーターが一致した時だけシグナルを出すからです。 矢印が表示されるのは以下の場合のみです: 有利なボラティリティ(ボリンジャーバンド) トレンドの強さまたは弱さの確認(RSI) この組み合わせによりノイズが減り、シグナルの信頼性が高まります。 スキャルピング、デイトレード、スイングトレードに最適です。 インジケーターの利点: 高速で非常に明確なシグナル インデックス、ドル、株式、FX、暗号資産など、あらゆる資産
チャート上でサポートポイントとレジスタンスポイントを探すことがよくあります。 使用できる手法の1つは、オーダーブックで提供されるロットの数です。 この指標は、オーダーブックで最大のロットを検索し、それらを線の形でグラフに描画します。これにより、その時点で集中型株式市場で提供されたロットの最大の集中がどこにあるかを取得し、可能なサポートラインとレジスタンスラインを構成します。 -描画する線の数はユーザーが定義できます。 -線幅; -回線の更新時間。 -ラインスタイル; -線の色。 注:このインジケーターは、一元化された証券取引所など、オーダーブックのある資産でのみ機能します。 FOREXでは機能しません!!! 私が利用できるどんな疑いでも!
The Rocket Trend indicator is trending. The indicator draws two-color points connected by lines along the chart. This is a trend indicator, it is an algorithmic indicator. It is easy to work and understand when a blue circle appears, you need to buy, when a red one appears, sell. The indicator is used for scalping and pipsing, and has proven itself well. Rocket Trend is available for analyzing the direction of the trend for a specific period of time. Ideal for novice traders learning the laws o
SBAHiLo
Umri Azkia Zulkarnaen
this is an indicator to clarify seeing Low and High in the market and is very useful for facilitating those who are studying technical price action this is a type of indicator that gives color to the candlestick where the indicator is divided into 3 colors red = bearish green = Bullish Gray = base this indicator can be used on the forex market or the mt5 binary market. https://t.me/SBA_FOREX_SIGNAL
Fibonacci Advanced Indicator – Precision Meets Intelligence The Fibonacci Advanced Indicator is a cutting-edge technical analysis tool designed for traders who demand more than conventional retracement levels. Built on the foundational principles of Fibonacci mathematics, this indicator transcends tradition by integrating dynamic market behavior , multi-timeframe analysis , and adaptive algorithms to deliver high-probability trading zones with surgical accuracy. 1. Multiple Fibonacci Levels
Un potente indicatore multifunzione progettato per offrire una visione chiara e strutturata della forza del mercato, integrando tre strumenti tecnici in un'unica interfaccia intuitiva:   Caratteristiche principali:   Heikin Ashi RSI Normalizzato Calcolato sul RSI di medie Heikin Ashi, centrato su una scala da -50 a +50 Visualizzazione con candele colorate (blu/rosso) per una lettura chiara della direzione e del momentum   Stocastico Modificato %K e %D convertiti sulla stessa scala -50/+50 Opzion
Develop this indicator for periods of 30 minutes or more, focus on getting market trends right and making sure they are met. MFOP v8.1 gets straight to the point: it scans the market and tells you exactly when there is enough strength to enter a trade. This indicator doesn't do magic, it uses mathematical algorithms to filter out market noise, not enter into false breakouts and show you clear BUY (blue arrow) and SELL (red arrow) opportunities. It is designed and optimized specifically to take
Fibonacci Pips MT5 Instant Fibonacci Levels, Prices and Pip Distances Fibonacci Pips MT5 is a practical Fibonacci measurement tool for MetaTrader 5. It displays each Fibonacci level together with its exact price and pip distance, helping traders plan pullbacks, profit targets and stop-loss levels without manual calculations. Instead of seeing only percentages such as 38.2%, 50.0% or 61.8%, traders can immediately understand: The Fibonacci level The exact market price The pip distance from the re
Contact me for instruction, any questions! - Lifetime update free - Non-repaint - I just sell my products in Elif Kaya Profile, any other websites are stolen old versions, So no any new updates or support. Introduction Breakout Trend Scanner indicator works based on the Elliott Wave in technical analysis describes price movements in the financial market that are related to changes in trader sentiment and psychology and finds end of movement and breakout trend. The Elliott Wave pattern that is f
Gann S9 Pro Signals and Star
Mohamed Amr Mohamed Osama Abdelwahab
5 (1)
**ギャンの九角形 2 — 高度な価格・時間予測ツール** 九角形は W.D. ギャンの最も強力な予測ツールのひとつです。本インジケーターは MetaTrader 5 向けの第二世代完全実装で、パトリック・ミクラの書籍の手法に直接基づいています。 インタラクティブツールバー、トレードシグナルパネル、ギャン星形図、チャネルゾーン、 角度統計、平均ゾーンオーバーレイ、12言語インターフェースを追加しています。 1つの基準価格から、基本十字(0・90・180・270度)と対角十字(45・135・225・315度)上の サポート/レジスタンスを投影します。時間(将来の転換バー)も予測し、どの角度を市場が 最も尊重しているかを計測します。価格レベルとギャン時間カウントが一致すると、 「価格-時間コンフルエンス」アラートを発します。 分析・予測専用ツール。DLL不要、インターネット不要。あらゆる銘柄・時間足で動作。 **主な機能** - 価格レベル:基本十字・対角十字、複数リング - シグナルパネル(書籍手法):BUY/SELL SETUP、3段階コンフルエンス、価格-時間アラート -
123パターン は、最も人気のある強力で柔軟なチャートパターンの1つです。このパターンは、3つの価格ポイントで構成されています。ボトム、ピークまたはバレー、および38.2%〜71.8%のフィボナッチリトレースメントです。パターンは、価格が最後のピークまたは谷、インディケーターが矢印をプロットし、アラートを上昇させ、取引を行うことができる瞬間を超えたときに有効と見なされます。 [ インストールガイド | 更新ガイド | トラブルシューティング | よくある質問 | すべての製品 ] クリアな取引シグナル カスタマイズ可能な色とサイズ パフォーマンス統計を実装します カスタマイズ可能なフィボナッチリトレースメントレベル 適切なストップロスおよび利益レベルを表示します インジケーターを使用して、継続パターンまたは反転パターンを見つけることができます 再描画および非再描画ではありません 電子メール/音声/視覚アラートを実装します 123パターン は、継続パターンまたは反転パターンとして現れます。物事を簡単にするために、このインジケーターを使用して、検索するパターンのタイプを選択できるため
1. Overview The Scalping PullBack Signal indicator is a powerful technical analysis tool designed to help traders identify scalping opportunities based on potential pullback and reversal signals. This tool is particularly useful on lower timeframes (below 15 minutes) but can also be applied on higher timeframes for longer-term trades. This indicator integrates several key analytical components, providing a comprehensive view of trends and potential entry/exit points, helping you make quick and e
FREE
Advanced Line Tools は、MetaTrader 5 での分析をより迅速、正確、整理されたものにするために開発された描画およびチャート構造管理ツールです。 単にラインを描画するだけでなく、ローソク足、価格、チャート上の重要なポイントを認識できるインタラクティブな構造を作成できます。 チャート上のコンパクトなインターフェースから、MetaTrader 5 の標準ツールを頻繁に切り替えることなく、分析を作成、編集、管理できます。 主な機能 高度なラインシステム Advanced Line Tools パネルからチャート上に直接ラインを作成できます。 作成した構造は直感的に選択および編集でき、以下の操作が可能です。 ライン全体を移動 始点を調整 終点を調整 長さを変更 基準を維持したまま構造を移動 チャート上の既存ラインを直接編集 視覚的なコントロールは必要な場合のみ表示され、チャートを整理された状態に保ちます。 高度なマグネット機能 — Smart Anchoring ラインをローソク足の近くに配置すると、Advanced Line Tools が主要な構造ポイントを認識し
このプロダクトを購入した人は以下も購入しています
Trend Sniper X
Sarvarbek Abduvoxobov
4.9 (40)
Trend Sniper X は、トレードの方向性と潜在的な反転ポイントを明確かつ正確に特定するのに役立つ、MetaTrader 5 用のマルチタイムフレーム・トレンドフォロー指標です。 MT4用: https://www.mql5.com/en/market/product/193245 価格情報: 現在の価格はプロモーション価格であり、今後のアップデートや新機能のリリースに伴い変更される場合があります。 ボーナス特典: このインジケーター用の無料自動売買アシスタントEAを入手するには、購入後に an 著者(開発者)へメッセージをお送りください。 Code2Profit チャンネル マルチタイムフレーム分析で相場をマスターしよう! Trend Sniper X で勝率を最大化する方法:重要なルールとセッションのコツ 技術仕様 プラットフォーム MetaTrader 5 インジケータータイプ マルチタイムフレーム・トレンドインジケーター 操作タイムフレーム あらゆるチャートタイムフレームに対応。個別に選択可能な上位タイムフレーム (M1–MN1) を搭載 主要銘柄 FX、ゴールド (X
Smart Trend Trading System — MetaTrader 5 STTSは、トレンドの方向、エントリー・決済シグナル、反転ゾーン、重要な価格水準をチャート上にまとめて表示します。システムを参考に手動で取引することも、別の対応EAを接続し、ご自身で選んだ設定に基づいて自動売買することもできます。 ひとつのシステム、4つのトレードアプローチ STTSのトレードアプローチは、大きく4つのカテゴリーに分かれています。 • スキャルピング — 短期的なシグナルや相場の動きを捉えます。 • トレンドトレード — 方向性を評価し、トレンド内の機会を探します。 • 反転トレード — 反転の可能性があるゾーンや方向の変化を見つけます。 • 出来高トレード — 出来高に基づく情報を使い、市場の活発さを評価します。 エントリー・決済の矢印、トレンド情報、サポート・レジスタンス、反転ゾーンを使い、チャート上で取引の状況を読み取れます。 まずはひとつのアプローチから始めてください。シグナルと設定を理解してから、ほかのアプローチも試してください。 シグナルから自動売買へ Smart Un
ARIPoint
Temirlan Kdyrkhan
1 (4)
ARIPoint is a powerful trading companion designed to generate high-probability entry signals with dynamic TP/SL/DP levels based on volatility. Built-in performance tracking shows win/loss stats, PP1/PP2 hits, and success rates all updated live. Key Features: Buy/Sell signals with adaptive volatility bands Real-time TP/SL/DP levels based on ATR Built-in MA Filter with optional ATR/StdDev volatility Performance stats panel (Success, Profit/Loss, PP1/PP2) Alerts via popup, sound, push, or email Cu
Zoryk Gold
Reda El Koutbane
5 (15)
割引は 24 時間後に終了します — 次の価格は$ 69 ZORYK — MetaTrader 5専用 XAUUSDシグナル・トレードプランニングシステム このような経験はありませんか。 ゴールドを分析し、エントリーを待ち、ようやくポジションを持った直後に価格が逆方向へ動く。 早すぎる決済をしてしまったり、Stop Lossを動かしたり、数秒迷っている間にチャンスを逃したりする。 その後、相場は自分が最初に予想していた方向へ進み、目標へ到達する。 問題は常に方向判断ではありません。 本当の問題は、明確な計画がなかったことです。 どこでエントリーすべきか。 どこでトレードの前提が無効になるのか。 近い利益を確保すべきか、より大きな値動きを待つべきか。 現在のsetupが本当に強いのか、それとも無理にトレードを探しているだけなのか。 ゴールドは非常に速く動きます。 正しい分析でも、明確なプランがなければ数秒で悪い判断に変わることがあります。 ZORYKは、その問題を解決するために開発されました。 ZORYKとは ZORYKは、MetaTrader 5とXAU
SuperScalp Pro
Van Minh Nguyen
4.66 (35)
SuperScalp Pro - Professional Multi-Layer Confluence Scalping System SuperScalp Proは、クラシックなSupertrendに複数のインテリジェントな確認フィルターを追加した、高度なスキャルピングインジケーターです。より高い確率が期待できるBuy/Sellの取引機会を特定し、ダマシのシグナルを大幅に減らすことをサポートします。 明確なBuyとSellの矢印がチャート上に直接表示され、ATRに基づくStop LossとTake Profitのレベルがリアルタイムで自動計算されます。 購入後、設定方法や推奨設定についてのサポートが必要な場合は、私にご連絡ください。 SuperScalp Pro Auto Traderを使用して、シグナルを簡単に自動化できます: [Auto Trader] 推奨設定ファイルをダウンロード: [Set File] 完全なドキュメントは製品ブログでご覧いただけます: [User Guide] 最新情報を受け取るには公式チャンネルに参加してください: [Official Channel]
Gann Made Easy   は、ミスター・ギャンの理論を使用した取引の最良の原則に基づいた、プロフェッショナルで使いやすい外国為替取引システムです。 W・D・ガン。このインジケーターは、ストップロスとテイクプロフィットレベルを含む正確な買いと売りのシグナルを提供します。 PUSH通知を利用して外出先でも取引可能です。 ご購入後、取引方法の説明と優れた追加インジケーターを無料で入手するには、私にご連絡ください! おそらく、ギャンの取引手法についてはすでに何度も聞いたことがあるでしょう。通常、ギャンの理論は初心者のトレーダーだけでなく、すでにある程度の取引経験がある人にとっても非常に複雑なものです。なぜなら、ギャンの取引手法は理論的にはそれほど簡単に適用できるものではないからです。私はその知識を磨き、最良の原則を私の外国為替インジケーターに組み込むために数年を費やしました。 このインジケーターは非常に簡単に適用できます。必要なのは、それをチャートに添付し、簡単な取引推奨事項に従うだけです。このインジケーターは常に市場分析の仕事を行い、取引の機会を探します。適切なエントリーポイントを検
SMC Intraday Formula
VividMind Digital Solutions
5 (26)
まず正直に言いましょう。 どんなインジケーターも、それ単体であなたを利益化させることはできません。もしそう言う人がいるなら、それは夢を売っているだけです。完璧な売買シグナル(矢印)を表示するインジケーターは、いくらでも“完璧に見せる”ことができます。正しい過去の区間を拡大して、勝ちトレードだけを切り取ればいいだけです。私たちはそれをしません。 SMC Intraday Formula はツールです。 市場構造を読み取り、最も高い確率の価格ゾーンを特定し、今この瞬間のスマートマネーの痕跡をシンプルな言葉で正確に示します。最終判断はあなたが行います。トレードを実行するのもあなたです。しかし今は「希望」ではなく「精度」でエントリーできます。 私たちはこのインジケーターを、ゴールド(XAUUSD)および主要FX通貨ペアで約3年間、日々のスキャルピングに使用してきました。M1、M5、M15、M30の主要ツールです。これは未来を予測しようとするのではなく、今まさに形成されている高確率セットアップを示し、その理由を説明します。 他のすべてのインジケーターと何が違うのか? ほとんどのトレーディングイ
GoldenX Entry MT5
VividMind Digital Solutions
5 (16)
GoldenX Entryは、MT5向けのインジケーターであり、適応型Smart Entry Trendアルゴリズム、シグナルスコアリングシステム、マーケットレジーム検出機能、およびボラティリティフィルターを備えています。各シグナルには、計算されたエントリーレベル、3つのテイクプロフィット(TP1、TP2、TP3)、およびストップロスレベルが含まれます。本インジケーターは、異なる市場環境に適応するために設計された複数の分析レイヤー上に構築されており、マルチレイヤー分析システムと内蔵オプティマイザーおよび統計トラッキングシステムを組み合わせています。リスク・リワード(RR)指標および過去のトレード履歴に基づく定量分析を提供します。 使い始めは簡単です — 選択した時間足でオプティマイザーを実行し、そのままチャート上でインジケーターを使用します。 コア機能 GoldenX Entryは、シグナルエンジンとトレード管理機能、そして過去統計トラッキングを1つのチャートに統合しています: - 内蔵オプティマイザー: オプティマイザーはチャート上でワンクリックで実行できます。200通りのパラメー
新たな王者が登場 - インジケーター + 注文管理表示(TP1 + TP2 + TP3)+ オプションのTelegramシグナル送信機能付き(無料) (完全なトレード&シグナルシステム) ゴールド向け最高のEA: Gold Slayer このインジケーターには、高度な戦略、カスタマイズ可能な注文管理システム、そしてエンベロープ拡張を組み合わせた平均回帰システムが搭載されています。さらに、RSIなど複数のインテリジェントな確認フィルターによって、高確率の反転エントリーをBUY・SELLシグナルとして検出します。 単にトレードを学ぶだけでなく、複数ポジションを効果的に管理し、過去に利益を出しているオープンポジションで損失トレードをカバーする方法も学べます。 M5向けに構築・最適化されており、流動性が高くシグナルの精度が安定しているBTCUSDとXAUUSDで優れたパフォーマンスを発揮します。 このインジケーターは、ATRを基に自動計算されたエントリー、ストップロス、テイクプロフィットレベルを備えた明確なLong・Shortシグナルを提供するため、リスク管理が最初から組み込まれています。 マ
Neuro Poseidon is a new indicator by Daria Rezueva. It combines precise trading signals with adaptive TP/SL levels - creating best possible trades as a result! Message me and get  Neuro Poseidon Assistant  as a gift to automize your trading process! What makes it stand out? 1. Proven profitability on all assets and timeframes 2. Only confirmed BUY and SELL signals present on the chart 3. Adaptive TP & SL levels generated by the software for each trade 4. Easy to understand - suitable for al
Auto Optimized SpeedAngle は、継続的なウォークフォワード最適化(WFO:Walk-Forward Optimization)によりカーブフィッティング(過剰最適化)を排除した、機関投資家レベルのモメンタムベクトルシステムです。市場レジームの変化時に効果が低下する静的な入力に依存せず、アウトオブサンプル(OOS)検証を用いてパラメーターを動的に再キャリブレーションすることで、表示されるシグナルが単なる過去の偶然ではなく、確実な統計的優位性に基づいていることを保証します。 主な機関投資家向けフレームワーク ウォークフォワード最適化エンジン: ルックバック期間やしきい値の数千に及ぶ組み合わせを継続的にスキャンし、データをインサンプルとアウトオブサンプルに厳格に分離します。未検証のデータ環境において数学的優位性が証明された場合にのみ、新しいパラメーター設定を採用します。 定量的目的関数: 単なる純利益の追求ではなく、機関投資家レベルの安定性指標をターゲットとします。システム品質ナンバー(SQN)、期待値(1トレードあたりの平均Rマルチプル)、またはネットRの最適化を選
伝説が帰ってきました:Entry Points Pro 10。 MQL5 Marketのトップ3に3年間入り続けた伝説的インジケーターの再始動です。 2つのバージョンで合計589件の高評価レビュー、毎日数千人のトレーダーが実際のトレードに使用し、デモのダウンロードは31,000件以上   MT4+MT5 。 私はこの5年間に寄せられたレビューをすべて読み、約束を並べる代わりに、その答えをバージョン10に組み込みました。1999年から相場に携わり、 誠実さ、自らの評判、そして顧客を大切にする 作者による製品です。 Entry Points Proのエントリーシグナルは、リペイント(再描画)を一切行いません。 そして今回初めて、これは作者の言葉ではなく検証可能な事実になりました。確定シグナルはローソク足の終値確定後にのみ表示され、自動テストで リペイントはゼロ と確認されています(EURUSD、XAUUSD、BTCUSDで2,486,568回の不変条件チェック、違反0件)。検証方法は公開されており、ストラテジーテスターでご自身で再現できます。 ご購入後は、必ずすぐにダイレクトメッセージでご
FiboSniper Pro – Multi-Filter Fibonacci System with Auto SL/TP and Control Panel FiboSniper Proは、動的なFibonacci Envelopesと複数の確認フィルターを組み合わせ、選別されたBuyおよびSellシグナルを生成するテクニカルインジケーターです。FibonacciレベルはMoving AverageとATRを基に計算され、その後ADX、EMA、RSI、ATR、Volume、Time、Candle構造によってフィルタリングされます。インジケーターは、ATRに基づく自動Stop LossおよびTake Profitレベルをチャート上に直接表示し、さらに迅速な調整が可能なインタラクティブControl Panelを提供します。 購入後、推奨設定ファイルと詳細な使用方法については、私にご連絡ください。 Auto Trader Xを使用してFiboSniper Proのシグナルを自動化できます: [Auto Trader X] User GuideとSet Files: [Click her
Welcome to ENTRY IN THE ZONE AND SMC MULTI TIMEFRAME SPECIAL BENEFIT / FOR OUR MQL5 CUSTOMERS FREE ACCESS TO THE NEW TOOL  — COMING SOON — Learn more on our official website  : https://www.fableedge.net Entry In The Zone and SMC Multi Timeframe is a real-time market analysis tool based on Smart Money Concepts (SMC), designed to analyze market structure, price direction, and key trading zones. It supports both Single-Timeframe Analysis and Multi-Timeframe Analysis, providing a clearer view of the
Unix Scalper — MetaTrader 5 セットアップを見つけ、取引プランを確認し、取引方法を選ぶ。 UNIX Scalperは、市場分析、BUY/SELL/WAITの判断、Entry、Stop Loss、TP1、TP2の水準を、見やすいパネルにまとめています。 シグナルと取引プランを確認 • 明確な判断:BUY、SELL、WAIT。 • 明示された水準:Entry、Stop Loss、TP1、TP2。 • 複数時間足の一覧:パネル上で各時間足のシグナルを比較。 • 判断を支える分析:トレンド、モメンタム、出来高、ボラティリティ、サポートとレジスタンス、市場の質。 • 選べるレイアウト:Minimized、Compact、Standard、Full。 シグナルと各水準を確認し、そのセットアップがご自身の取引ルールに合うか判断してください。 ゴールドとビットコインから始める 最初に検討する市場:XAUUSDとBTCUSD。 短期のスキャルピングから上位時間足での分析まで試せます。過去のバーの範囲を選び、パフォーマンス曲線で選択した設定の過去の挙動を確認してください。
M1 SNIPER は使いやすいトレーディングインジケーターシステムです。M1時間足向けに設計された矢印インジケーターです。M1時間足でのスキャルピングのためのスタンドアロンシステムとして、また既存のトレーディングシステムの一部としても使用できます。このトレーディングシステムはM1時間足での取引に特化して設計されていますが、他の時間足でも使用できます。元々、この手法はXAUUSDとBTCUSDの取引用に設計しましたが、他の市場においても役立つと考えています。 インジケーターのシグナルは、トレンドの方向と逆方向に取引できます。インジケーターのシグナルを利用して両方向に取引するのに役立つ特別な取引テクニックをご紹介します。この手法は、特別な動的なサポートとレジスタンスの価格帯を利用することに基づいています。 ご購入後、M1 SNIPER矢印インジケーターをすぐにダウンロードできます。さらに、M1 SNIPERツールのすべてのユーザーに、以下のスクリーンショットに表示されているApollo Dynamic SRインジケーターを無料で提供しています。この2つのインジケーターを組み合わせることで
Adaptive Price Action Engine インジケーターを購入すると、EAが無料に マルチタイムフレーム対応・自己最適化トレンド&ローソク足パターン分析 市場環境は常に変化しており、すべてのPrice Actionパターンが、あらゆる市場環境で同じ価値を持つわけではありません。 Adaptive Price Action Engine は、変化する市場環境への適応を目的として、 トレンド構造、マルチタイムフレーム分析、ローソク足パターン、統計的最適化 を1つの分析フレームワークに統合しています。 2つのアダプティブモード Dual Alpha Trend Mode 低い時間足と高い時間足のAlpha Trendパラメータを自動的に探索し、直近の市場動向に合わせてトレンド判定を適応させます。 Candlestick + Alpha Mode Alpha Trendによる市場レジーム判定と、 22種類の強気・弱気ローソク足パターン を組み合わせます。すべてのパターンを同じように扱うのではなく、さまざまなパターンの組み合わせを統計的に評価し、選択された市場環境において過去
Tokyo Indicatorは、トレンドの方向性、潜在的な取引シグナル、および市場状況を視覚的に分かりやすく表示します。 色分けされた階段状のトレンドラインにより、強気局面(青色)と弱気局面(マゼンタ色)が明確に区別されます。トレンドの変化に合わせて表示される方向矢印は、売買の好機を強調します。 統合されたダッシュボードには、現在のシグナル、市場のバイアス(傾向)、モメンタム、ボラティリティ、シグナルの品質がひと目で分かるようにまとめられています。これにより、トレーダーはパネルを切り替えることなく、価格変動(プライスアクション)とインジケーターの数値を照らし合わせて分析を行うことができます。 すっきりとしたチャート表示と簡潔な市場概要により、Tokyo Indicatorはトレンド分析や取引判断における体系的なアプローチをサポートします。 あらゆる時間足や銘柄に対応しており、特に金(ゴールド)の取引に適しています。 トレンド スキャナーの強力なサポートを利用して、無料のインジケーターを入手し、プライバシーを守ります。あーみー!     設定 ShowHUD - チャート上のパネ
Scalper Vault は、スキャルピングを成功させるために必要なすべてを提供するプロフェッショナルなスキャルピング システムです。このインジケーターは、外国為替およびバイナリー オプションのトレーダーが使用できる完全な取引システムです。推奨される時間枠は M5 です。 システムは、トレンドの方向に正確な矢印シグナルを提供します。また、トップとボトムのシグナルとギャン マーケット レベルも提供します。 インジケーターは、プッシュ通知を含むすべてのタイプのアラートを提供します。 インジケータの購入後にご連絡ください。私の個人的な取引の推奨事項と素晴らしいボーナス指標を無料で共有します! 幸せで有益な取引をお祈りします!
FX Trend NG:次世代マルチマーケット・トレンドインテリジェンス 概要 FX Trend NG は、複数の時間足に対応したプロフェッショナル向けトレンド分析およびマーケット監視ツールです。 市場全体の構造を数秒で把握することができます。 複数のチャートを切り替える必要はありません。どの銘柄がトレンド中なのか、どこでモメンタムが弱まっているのか、そしてどの時間足で強い整合性があるのかを瞬時に確認できます。 ローンチ特別オファー – FX Trend NG を $30(6ヶ月) または $80 永久ライセンス でご利用いただけます。 すでに Stein Investments のユーザーですか? -> メッセージを送信 して、プライベートグループへアクセスしてください。 セットアップや詳細情報が必要ですか? -> Stein Investments 公式ページ をご覧ください。 1. FX Trend NG が他と異なる理由 3ステート・トレンドロジック ― Buy と Sell だけではない • 多くのインジケーターは Buy または Sell の2状態のみを表示します。
FX Power: 通貨の強弱を分析して、より賢い取引を実現 概要 FX Power は主要通貨と金の実際の強弱をあらゆる市場状況で理解するための必須ツールです。強い通貨を買い、弱い通貨を売ることで、 FX Power は取引の意思決定を簡素化し、高い確率の取引機会を見出します。トレンドを追従する場合でも、極端なデルタ値を使用して反転を予測する場合でも、このツールはあなたの取引スタイルに完全に適応します。ただ取引するだけではなく、 FX Power で賢く取引をしましょう。 1. なぜ FX Power がトレーダーにとって非常に有益なのか 通貨と金のリアルタイム強弱分析 • FX Power は主要通貨と金の相対的な強弱を計算し、マーケットダイナミクスに関する明確な洞察を提供します。 • どの資産がリードしているか、または後れを取っているかを監視して、取引するペアを賢く選びましょう。 マルチタイムフレームの包括的なビュー • 短期、中期、長期のタイムフレームで通貨と金の強弱を追跡し、マーケットトレンドに基づいて取引戦略を調整できます。 • スキャルピングからスイングトレード
Smart Price Action Concepts — MetaTrader 5 構造を確認し、ゾーンを見つけ、取引プランを立てる。 Smart Money Concepts(SMC)、ICTスタイルの分析、プライスアクションを、見やすいチャートにまとめます。市場構造、オーダーブロック、流動性の参考水準、インバランスを確認し、Smart Panelで表示する要素を選択できます。 市場をより体系的に分析 • 市場構造:内部構造とスイング構造、HH/HL/LL/LH、BOSとCHoCH、上位時間足分析、複数時間足ダッシュボード。 • 主要ゾーン:内部およびスイングのオーダーブロック、需給ゾーン、Fair Value Gaps、プレミアム・均衡・ディスカウントゾーン。 • 流動性の参考水準:同値高値・安値、強い・弱いスイングポイント、前日・前週・前月の高値と安値。 • フィボナッチツール:現在または前回のスイングに基づく自動検出。 • セッション情報:ロンドン、ニューヨーク、東京、シドニー、フランクフルトの各セッション、ロンドンとニューヨークのキルゾーン、ローソク足タイマー、対応
Power Candles V3 - 自己最適化型強弱インジケーター Power Candles V3は 、通貨や銘柄の強さを、適用されたすべてのチャート上で実行可能なトレードプランに変換します。単にローソク足を色分けするだけでなく、バックグラウンドでリアルタイムの自動最適化を実行し、目の前の銘柄に対して最適なストップロス、テイクプロフィット、およびシグナルの閾値を提示します。ワンクリックで実取引に適用でき、エントリーポイント、ストップロス、テイクプロフィットのラインが正確な価格位置にチャート上に表示され、方向性を示すアラートがリアルタイムで発動します。 このツールは、Stein Investmentsのエコシステムの一部です。  18種類以上のツールをすべて閲覧し、AIを活用したセットアップの推奨事項を入手し、  https://stein.investments でコミュニティに参加しましょう クローズしたバーごとに3,000回以上のトレードシミュレーション。9つの強さの状態。2つの戦略を並行してテスト。勝率の高い設定をワンクリックで適用。 なぜこれが必要なのか ほとんどの強
M1 Quantum を使用したライブトレードシグナル : シグナル (取引は 自動的に Quantum Trade Assistant によって実行され、この製品に 無料 で含まれています。) 最新ニュース: バージョン1.64がリリースされました。現在、すべての取引で、関連するサポート/レジスタンスゾーンの後ろにStop Lossが設定されます。今回のバージョンでは、EAのパフォーマンスを向上させるためにSmart Close機能も改善されました。 8月9日から、ライブシグナルはバージョン1.64で稼働しています。 価格プラン: 現在価格: $169 (早期購入者向けオファー) 次回予定価格: $189 予定小売価格: $299 開発者からのお知らせ: ご購入後、 最新の推奨設定ファイル(Set File) 、運用アドバイス、および他の M1 Quantum ユーザーと交流できる VIPサポートグループ への招待をご希望の場合は、お気軽にご連絡ください。 よくある質問 - 設定ファイル - インストールガイド M1 Quantum は、M1専用のプロフェッショナルトレーディング
Market Structure Order Block Dashboard MT5 は、市場構造と主要な価格反応ゾーンをチャート上で直接読み取りたいトレーダー向けに設計された MT5 インジケーターです。BOS、ChoCH、オーダーブロック、Fair Value Gap (FVG)、流動性、Kill Zones、Volume Profile、そして素早い分析のためのコンパクトなダッシュボードを組み合わせています。 本インジケーターは、市場構造、ICT、Smart Money の概念を意思決定の枠組みとして使用するトレーダーを対象としています。トレンド継続、反転の可能性、価格の不均衡、流動性ターゲット、注目ゾーンをより構造的に特定する助けとなります。 購入者向けの付属リソース 購入後、MQL5 のプライベートメッセージにてご依頼いただくと、完全な PDF ユーザーガイドとパラメータ設定のヒントを提供いたします。MQL5 のプライベートメッセージによる直接的な技術サポート。 バージョン 1.20 では 2 つの重要な追加機能があります: Pending BOS / Pending Cho
Atomic Analyst — MetaTrader 5 Atomic Analystは、プライスアクション、トレンドの方向、エントリー・決済シグナル、損切り水準、複数の利確水準をチャート上にまとめて表示します。 シグナルを確認し、取引の状況を理解する Atomic Analystは、分析結果をわかりやすい視覚情報として表示します。 • エントリーの候補を見つけるための買い・売りの矢印。 • 取引計画に役立つ損切り水準と複数の利確水準。 • 市場の方向性を評価するトレンド、強さ、モメンタムの指標。 • より広い市場背景を比較する複数時間足の分析。 • 変化する状況を追うための色分けされたローソク足とアラート。 シグナルと補助分析を併せて確認し、その取引機会がご自身のルールに合うかを判断してください。 短期の取引機会から、より大きな値動きまで Atomic Analystは、スキャルピング、日中の取引、より長く続く相場の動きを追う取引に利用できます。 最初に使う時間足としてH1を推奨します。推奨銘柄にはEURUSD、AUDUSD、XAUUSDが含まれます。 シグナルから自動売買
Crystal Heikin Ashi Signals—Professional Trend & Signal Detection Indicator Advanced Heikin Ashi Visualization with Intelligent Signal System for Manual & Automated Trading Final Price: $149 ---------> Price goes up $10 after every 10 sales . Limited slots available — act fast . Overview User Guide PDF Crystal Heikin Ashi Signals is a professional-grade MetaTrader 5 indicator that combines pure Heikin Ashi candle visualization with an advanced momentum-shift detection system. Designed for both m
このインジケーターを購入された方には、以下の特典を 無料 で提供しています: 各トレードを自動で管理し、ストップロスとテイクプロフィットを設定し、戦略ルールに基づいてポジションを決済する補助ツール 「Bomber Utility」 様々な銘柄に合わせたインジケーターの設定ファイル(セットファイル) 「最小リスク」、「バランスリスク」、「待機戦略」 の3つのモードで使用できる Bomber Utility 用の設定ファイル このトレーディング戦略をすぐに導入・設定・開始できる ステップバイステップのビデオマニュアル ご注意: 上記の特典を受け取るには、MQL5のプライベートメッセージシステムを通じて販売者にご連絡ください。 オリジナルのカスタムインジケーター 「Divergence Bomber(ダイバージェンス・ボンバー)」 をご紹介します。これは、MACDのダイバージェンス(乖離)戦略に基づいた 「オールインワン」型のトレーディングシステム です。 このテクニカルインジケーターの主な目的は、価格とMACDインジケーターの間に発生するダイバージェンスを検出 し、将来の価格の動きを示
Quant Direction は、3次元の市場分析ツールです。完全に客観的なアルゴリズムベースの市場分析を提供し、様々なパラメータにわたる正確なパーセンテージ偏差を同時に算出します。高度なAI搭載モデリングツールで開発され、厳密なテストを経て開発されたこのアルゴリズムは、かつてない精度で市場を分析するように設計されています。プラットフォーム上では、あらゆる通貨ペアや金融商品を分析できます。 短期取引、デイトレード、スイングトレードなど、どのような取引スタイルに も、Quant Directionは最適な選択肢です。 オペレーターの本当の利点 Quant Directionの真の利点は、感情、眼精疲労、過剰分析を完全に排除できる点にあります。方向性を探るために何十ものチャートを手作業で精査したり、自分の好みを常に疑ったりする必要がなくなります。このシステムは、8つの時間間隔(5ヶ月から月単位まで)をミリ秒単位で処理します。あらゆる瞬間に市場を支配している主体を正確に明らかにし、常に成功確率が最も高い方向で取引できるようにします。 市場分析の3つの側面 このアルゴリズムは市場を3つの
Smc Pro ToolKit
Talal N Z Aljarusha
5 (13)
SMC PRO TOOLKIT — SMART MONEY ANALYSIS & STRUCTURED TRADE PLANNING SMC Pro ToolKit is a professional Smart Money Concepts analysis workspace for MetaTrader 5. It combines market structure, multi-timeframe analysis, institutional price zones, setup evaluation, confirmation tools, volume context, alerts, and risk planning inside one organized chart environment. One workspace. Multiple layers of confirmation. One structured trading plan. OPEN COMPLETE USER GUIDE MULTI-CONDITION SETUP ENGINE At
作者のその他のプロダクト
インディケータは、最も可能性の高いトレンドストップ/反転エリア、自信のあるトレンド移動エリアを計算します。 計算では次のことが考慮されます。 価格変動率; チャートの相対偏差角度。 価格変動の平均振幅。 その「コンフォートゾーン」を離れる価格。 ATRインジケーターの値。 インジケーターは、価格がストップ/リバーサルエリアに入るとアラートを生成できます。 設定 全長を描きますか? -チャートの最後まで領域を描画します。 Show StopUP-trend-上昇トレンドのストップ/反転エリアを表示します。 上昇トレンドを表示-自信を持って上昇トレンドの領域を表示します。 下降トレンドを表示-自信を持って下降トレンドの領域を表示します。 Show StopDOWN-trend-下降トレンドのストップ/反転エリアを表示します。 エリア変更のアラート-価格がトレンドストップ/変更エリアに入ったときにアラートを生成します。 次は、各商圏の色設定です。
フラットとトレンドを決定するための指標。 価格が2つのヒストグラムと2つの線(赤と青)のいずれかを下回っている場合、これは売りゾーンです。 このバージョンのインジケーターを購入するときは、1つの実際のアカウントと1つのデモアカウント用のMT4バージョン-ギフトとして(受け取るには、プライベートメッセージを書いてください)! 価格が2つのヒストグラムと2つの線(赤と青)のいずれかを上回っている場合、これは購入ゾーンです。 MT4バージョン: https//www.mql5.com/en/market/product/3793 価格が2つの線の間、またはいずれかのヒストグラムのゾーンにある場合、市場に明確な傾向はありません。簡単に言えば、市場は横ばいです。 インジケーターの動作は、スクリーンショットでより明確に示されています。
SuperTrend
Evgeniy Zhdan
2.5 (2)
The Supertrend Expert Advisor The Supertrend Expert Advisor with averaging elements. It has been developed during three months until I finally got good results. It is not a scalper. The minimum balance to start trading - 100 $. Is automatically adjusted to the 4 and 5-digit prices. Has an efficient risk management system. The lot and limit on the maximum lot is automatically calculated based on the settings specified in the EA. As a result, you have a complete automated trading system. Download
StarDust searches for divergences in the values of several indicators considering them as signs of flat and enters the market if a relatively steady trend is detected. The Expert Advisor trades "basic" symbols with a low spread. The best results are achieved on М15. The EA automatically adjusts to 4 and 5-digit quote flows. Settings Comment_to_orders – comment to a placed order. The field can be left blank if no comment is required. MM – enable money management with automatic setting of a worki
The EA catches the price when it moves against the trend in an effort to open an order in an opposite direction (direction of the main trend). Screenshots illustrate examples of entries and the strategy gist. The EA uses stop losses depending on values of ATR. Settings: Lot_ - if Risk_ = 0, the EA will trade this lot; Risk_ - risk per one trade. Stop loss is taken into account; koeff_ATR - coefficient multiplied by the ATR value to calculate stop loss (the bigger the value, the bigger stop loss
The FastBoom EA finds the most probable points of price pullback/reverse and places an order. It places averaging orders if the price moves further against take profit. Settings of the EA: Lots - initial lot; LotExponent - multiplier for following orders (Martingale). 1 - no multiplier. TakeProfit - take profit in points; Stochastic Settings InpKPeriod - K Period of Stochastic InpDPeriod - D Period of Stochastic InpSlowing - Stochastic Slowing LevHigh - level for sell positions of Stochastic L
The Expert Advisor calculates the double/triple divergence of volumes, and starts trading. It uses a unique formula of lot calculation, which greatly improves stability of trading. Recommended TF - 1h. Currency pair - EURUSD , but the EA can be used on any trading instruments which are not subject to high volatility. Settings mode - trading direction can be set manually; close - order close level (details on the screenshot); Step between orders - step between orders in points; Maximum orders -
The Expert Advisor opens orders from the horizontal line, the a trader can set on any level by dragging using the mouse or by changing the line properties. For example, when a horizontal line is above the current price, the EA will open a Buy order once the horizontal line is reached. And vice versa: If the line is below the current price, the EA will open a sell order once the line is crossed. A buy crossover of the line is: opening of the current candlestick below the horizontal line; the curr
SellerATR
Evgeniy Zhdan
5 (1)
The Expert Advisor only sells. Recommended currency pairs : EURUSD; GBPUSD; USDCHF; USDJPY; USDCAD; AUDUSD; EURGBP; EURAUD; EURCHF; EURJPY; GBPCHF; CADJPY; GBPJPY; AUDNZD; AUDCAD; AUDCHF; AUDJPY; CHFJPY; EURNZD; EURCAD; CADCHF; NZDJPY; NZDUSD. Timeframe: H1. Percent% manages closing both loss-making and profitable deals based on the account overall status. Using the EA on 23 symbols mentioned above allows the robot to cope with the drawdown in case of a long trend. While positions on some pairs
Illusion
Evgeniy Zhdan
3 (2)
The Illusion EA uses the probability theory - after a series of consecutive virtual losses - i.e. right during a flat the EA already starts trading in the trend. In addition, the EA considers the ratio of bullish/bearish candles on the higher timeframes to determine the greatest probability of the price movement direction. Only 1 order can be opened at a time. In case of a loss the following order will be placed with an increased lot (the multiplication coefficient is set in the parameters). The
The indicator plots a trend line and determines the levels for opening trades, in case the price goes "too far" away from the trend level. More detailed information is available in the screenshots. Settings Away from the trend line - distance from the trend line to the trades level; Arrow Signal for deals - enable displaying an arrow when the price reaches the trades level; Size of Arrow - size of the arrow; Alert Signal for deals - enable generating alerts when the price reaches the trades lev
Turbina
Evgeniy Zhdan
5 (4)
The axiom of the Forex market is that any trend will be broken. The Expert Advisor determines trend direction (the pink line), and calculates levels for opening opposite orders depending on the settings. The value of Away from the trend line for Deal will be different for each pair and timeframe, depending on the volatility of the trading instrument. Next orders can be opened with an increased lot (a static lot is used by default). See the screenshots to understand the idea of the Expert Advisor
The Expert Advisor determines the moments of strong movements and opens a position in the direction of the most probable price movement. The strategy always uses stop loss and take profit. Several independent orders can be in the market (the maximum number is set in parameters). The goal of the EA's underlying trading system is the quantitative excess of the number of profitable deals over the number of losing ones. Recommended: EURUSD 5m; GBPUSD 5m; USDJPY 5m. The Expert Advisor is able to work
Vise is a trend indicator. The upper and lower lines follow the price showing the prevailing price direction. Frequent breakthroughs of the upper line indicate a bullish trend, while frequent breakthroughs of the lower line indicate a bearish one. Parameters Points for UpLine - initial number of points for the upper line; Points for DownLine - initial number of points for the lower line. During the breakthrough of the upper level (line), this level shifts upwards by Points for UpLine. If the up
Twinkle is a trend-based scalper using stop loss and take profit invisible to the broker. The EA does not look for trend reversals. The EA catches strong market movements and opens orders in the direction of the trend. Your broker will not see the order closing levels. The EA closes orders independently when reaching the take profit or stop loss levels specified in the settings. Recommended trading symbols: EURUSD M5, GBPUSD M5. ECN accounts with 5 digits quotes are recommended. Expert Advisor
Shine
Evgeniy Zhdan
4.75 (4)
This Expert Advisor implements elements of the Martingale system. Orders are opened at a specified distance from the moving average. The Parabolic SAR indicator and certain technical details are used to ensure the most accurate entries. The EA is highly customizable. It is recommended for simultaneous use on 4 currency pairs: EURUSD M15; GBPUSD M15; USDJPY M15; USDCAD M15. Despite good stability, it is advisable to disable the EA operation during the days rich in news releases. Configurations P
LuckyCase is an Expert Advisor with martingale elements. The EA strategy is based on a significant "deviation" of the price from SAR inadicator and the Bands levels breakthrough point. The money management system is an essential part of the EA. It starts working after a trade is opened. Trades are closed after accumulating specified points of market orders, by deposit % or after an opposite side of the channel is broken through. The default EA settings are meant for: EURUSD M15; USDJPY M15. The
The Elize Expert Advisor has been designed to work with the EURCHF currency pair. It considers the peculiarities of this trading instrument, its behavior and dependence on the behavior of other currencies. In particular, when the currencies of the European countries (EURUSD, GBPUSD, EURNOK, EURCHF) move in the same direction, the EA starts its operation and opens a deal in the trend direction of the European currencies. In the event of price rollbacks, the EA uses a unique method for making the
Brief Description of the All Trend Lines Indicator The indicator analyzes the wave structure of the market. What it displays on the chart: First. Wave pivots (semaphores) • Red markers – wave highs • Yellow markers – wave lows • Yellow-green markers – additional local extremes Second. Trend lines • Purple/blue lines – trends based on highs (resistance/support) • Beige/green lines – trends based on lows • Lines are built automatically by connecting wave pivots of the same type Third. Main trend
The Expert Advisor has been specifically developed for trading gold (Spot Gold). The strategy is based on Fibo levels calculated from the previous (first) candle High/Low and the width of the current and lower timeframes channel. If important Fibo levels of different orders are located in a single price channel (within a spread), the EA defines this channel as the target for price movement and starts operation. Martingale and averaging are not used. Each order is independent and is accompanied b
The algorithm of this Expert Advisor determines the significant price levels, where the trend often turns into a flat or reverses. Stochastic Oscillator serves as an additional filter of overbought/oversold zones. The EA sets stop loss and take profit after opening an order. The underlying trailing strategy applies a trailing stop. The EA is recommended for simultaneously use on three trading instruments: EURUSD M5, GBPUSD M5, EURCHF M5. Settings: Comment to order - comment to orders. MaxRisk -
The Expert Advisor looks for technical analysis patterns formed on the higher (hourly) timeframe to start working on the 5-minute chart. Technical analysis patterns used: double top/double bottom, head/shoulders, flag, expanding/narrowing triangles. The Relative Vigor Index technical indicator is used as the filter for opening deals. It is based on the idea that on the bull market the closing price is, as a rule, higher, than the opening price. It is the other way round on the bear market. This
The Expert Advisor calculates the divergence on the current and higher timeframes. In case the divergences coincide, the EA starts its operation. Deals have strict take profit and stop loss levels. Each deal is managed by trailing stop. The strategy involves the use of a tight stop-loss. Therefore, losing deals and/or series of losing deals are not uncommon. This EA is not suitable for those who have difficulties coping with losing deals. The EA is recommended for simultaneous use on the followi
The Expert Advisor has been developed specifically for the features of the CHFJPY currency pair. The EA's algorithm determines the direction of the current trend and starts operation. In case of a price reversal within the current trend, the EA adds additional orders. If trend changes, the EA starts to work in the direction contrary to the initial grid of orders. If there were no conditions for closing orders and the trend direction changed again, the EA continues to work with the "first" grid o
The Expert Advisor algorithm determines on daily charts those candlestick patterns, which set the intraday trading direction. The trading EA determines how long the price is moving in overbought/oversold zones and starts working in the direction of the expected trend movement. Each position is accompanied with a tight stop loss and take profit. Only one active position can be open in the market. The EA was developed and tested using 99% quality quotes. The Expert Advisor has a built-in news filt
The strategy of this Expert Advisor is based on a hedging system, which implies placing opposite orders. The EA algorithm determines trend beginning and opens a position in the trend direction. In case of a wrong entry, the EA tries to neutralize the drawdown through opposite (hedging) orders at a preset interval (Coefficient of counter orders). Orders are closed when one of the two values ​​is reached - profit in percent or profit in points. The EA does not use lot increase. The EA wast tested
Советник работает по принципу хеджирования с периодическими "перекосами" в сторону трендовых направлений. Направления тренда советник определяет на основании стандартного индикатора Parabolic Stop and Reverse system (SAR). Уникальная стратегия установки балансирующих позиций позволяет избегать больших просадок даже при самых не благоприятных рыночных условиях. Параметры по умолчанию рекомендуется использовать на торговом инструменте: GBPJPY 15m. Разработка и оптимизация параметров производились
Snoot
Evgeniy Zhdan
5 (1)
This Expert Advisor works using a grid in the direction of a trend movement with the step between opened positions defined in the settings. The positions are closed by the total take profit. The Parabolic SAR standard indicator is used to filter order opening, which comes in the MetaTrader 4 package. The EA has been developed and tested using 99,9% quality of quotes. Operation of the EA in real time can be viewed in the signals . The best trading results have been achieved on CHFJPY M15. Settin
The Expert Advisor builds channels based on the data obtained using ATR and MA indicators according to the equations: Upper channel border = MA + ATR * (FIBO); Lower channel border = MA - ATR * (FIBO), where FIBO has the following values: Style of Trade - Aggressive = 1.61852; Style of Trade - Average = 3.26704; Style of Trade - Calm = 4.85556. Trades are opened inside the channel with the intervals defined in the settings. Long and short positions are opened independently. Positions are closed
The trading statistics indicator notifies the trader of the aggregate income of the trading account for different time intervals. The indicator has wide display settings on the graph. There is a choice of one of the two display languages on the chart- English and Russian. Settings Indicator language (ENG, RUS) - Select the language to display on the chart; To control the magic (-1: any magic) - Entering the Magic for control (-1: any Magic); Angle of indicator tie - Selecting the angle of the c
フィルタ:
レビューなし
レビューに返信