MA Distance Histogram

MA Distance Histogram

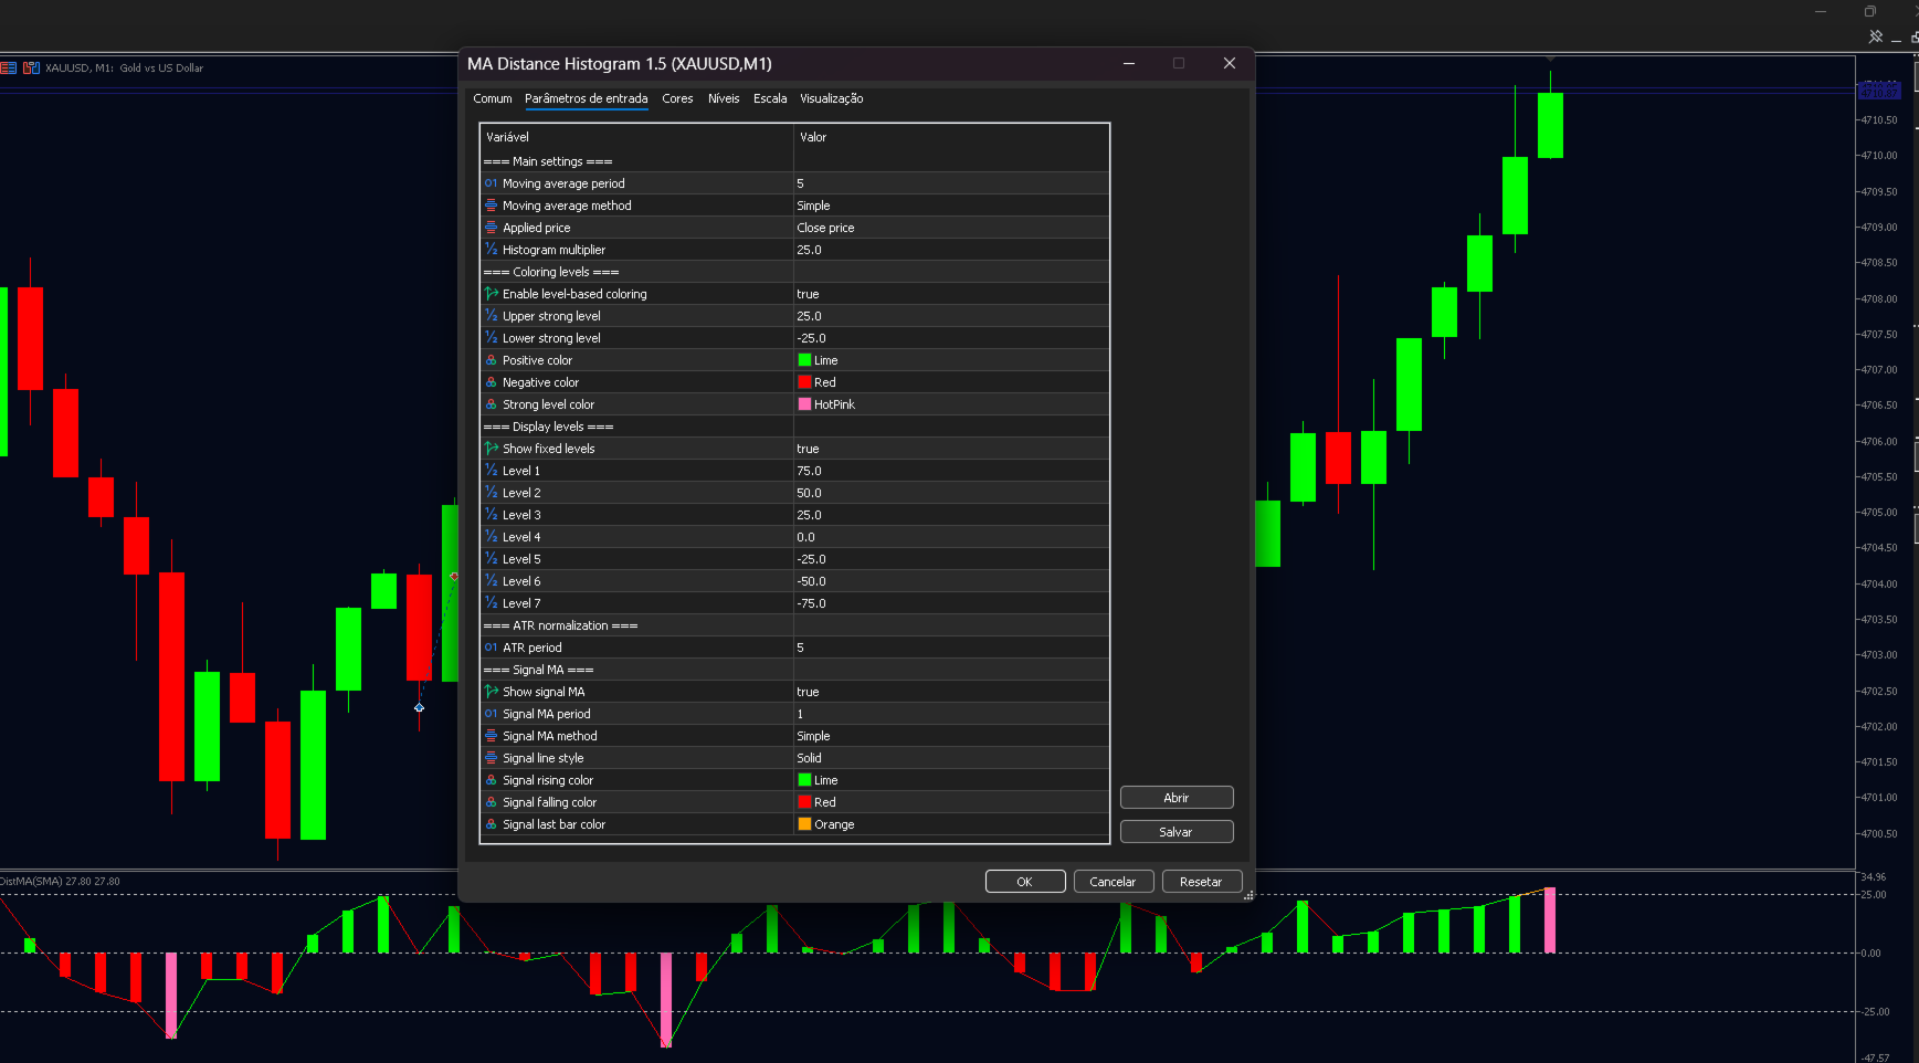
The MA Distance Histogram is an indicator that shows, in histogram form, the distance between the closing price (Close) and a Moving Average, allowing a clear visualization of buying and selling strength in the market.

Positive values (green bars) indicate that the price is above the moving average, representing buying pressure (bulls).
Negative values (red bars) indicate that the price is below the moving average, representing selling pressure (bears).

The indicator uses ATR (Average True Range) to normalize this distance, making the reading more accurate under different volatility conditions and on any asset or timeframe. In this way, strong and weak movements can be compared proportionally.

Advantages of using the Moving Average as a histogram

Facilitates the identification of trend strength.
Allows clear and objective visualization of the price distance from the moving average.
Helps detect possible overbought and oversold zones.
Shows momentum changes when the histogram crosses the zero level.
Works as both a trend and strength oscillator at the same time.

Additional features

Configuration of the Moving Average period and type (SMA, EMA, SMMA, LWMA).
Option to display ATR-based levels for visual reference.
Possibility to show or hide the zero level.
Compatible with any asset and timeframe.

Recommended for

Identifying trend and its strength.
Confirming entries together with price action or other indicators.
Analyzing moments of movement exhaustion.
Use in trend following and reversal strategies.


Recommended products
The Volume Weighted ATR indicator is a helpful tool for measuring market activity. It is based on the idea of the Volume-Weighted ATR. Combining these two elements helps identify potential turning points or breakout opportunities. The indicator for the classification of the activity of the market uses the moving average and its multiples. Accordingly, where the VWATR bar is located (relative to the moving average), it is labelled as ultra-low, low, average, high, very high or ultra high. The Vo
FREE
Basic Vwap
james mugendi
4 (1)
Simple Vwap with the daily, weekly and monthly VWAP is the abbreviation for   volume-weighted average price , which is a technical analysis tool that shows the ratio of an asset's price to its total trade volume. It provides traders and investors with a measure of the average price at which a stock is traded over a given period of time. How it's used Identify entry and exit points:   Traders can use VWAP to determine when to buy or sell an asset.   Understand price trends :  Traders can use V
FREE
MW Volume
Martin Bittencourt
3.8 (5)
The Martinware Volume indicator plots a colored moving average over volume bars. The coloring uses three colors and can be done in different ways choosable by the user and is applied both to the average as to the volume bars. Three types of coloring are possible: None: no coloring is done Increasing or decreasing: changes the color depending on the current value being bigger or lesser than the previous one Volume relative to average: colors vary if the current volume is bigger or lesser then
FREE
Aggression Volume
Flavio Javier Jarabeck
4.29 (17)
Aggression Volume Indicator is the kind of indicator that is rarely found in the MQL5 community because it is not based on the standard Volume data provided by the Metatrader 5 platform. It requires the scrutiny of all traffic Ticks requested on the platform... That said, Aggression Volume indicator requests all Tick Data from your Broker and processes it to build a very special version of a Volume Indicator, where Buyers and Sellers aggressions are plotted in a form of Histogram. Additionally,
FREE
Volume Weighted Average Price or VWAP is an indicator wich shows different average prices on chart. This is very useful to find strong negotiation price areas and as trend following. Configurations: Day, Week and Month - Show different VWAPs according to the period. You can change each line style on "colors" tab. Any doubt or suggestion please contact us. Enjoy! This is a free indicator, but it took hours to develop. If you want to pay me a coffee, I appreciate a lot   <3 PayPal, Skrill, Nete
FREE
Waves Sizer
Flavio Javier Jarabeck
3.86 (7)
Wyckoff fans, enjoy! Ideally to be used with the Weis Waves indicator, but it can be easily used alone, the Waves Sizer puts the range (in resulting Price movement) done by the Price on its market swings. You can control how accurate or loose will be the swings. This tool is very helpful for visually know how much the Price has traveled in your Timeframe. This way you can confront this level of effort with the resulting Volume, etc... Weis Waves indicator: https://www.mql5.com/en/market/produc
FREE
Mirror Chart MT5
Andrej Hermann
5 (1)
The Mirror Chart MT5 is a overlay indicator specifically designed to project a second financial instrument directly onto the main chart window. This tool is invaluable for traders who rely on correlation analysis, as it visualizes the price movements of two different instruments in real time. Unlike traditional overlays, this indicator utilizes intelligent, dynamic centering and scaling logic. It continuously analyzes the visible price range in the current window for both symbols and calculates
FREE
Are you already a fan of the Minions Labs Smart Heikin Ashi chart analysis tool? Or perhaps you're looking for a versatile Heikin Ashi chart capable of operating across multiple timeframes? Want to see the bigger picture before diving into the details, to make smarter ENTRY decisions? Do you want to build your own Dashboard of Symbols in just one chart, without dealing with messy multi-window MT5 stuff? Welcome to the Minions Labs Smart Heikin Ashi CompactView MTF indicator! Please see the power
Aggression Volume Profile
Edson Cavalca Junior
4.55 (11)
This indicator plots the volume profile by Price on the chart There are 5 ways to view it: By Total Volume Traded (Premium Version); Volume Ticks(Forex) Separated by Buyers and Sellers (Premium Version); Buyers Only (Premium Version); Sellers Only (Premium Version); Business balance (Buyers - Sellers) (Premium Version); . It is possible to select how many days the profiles will be calculated.( Premium Version) On the current day it recalculates the histogram data for each new candlestick.
FREE
Weis Waves
Flavio Javier Jarabeck
2.83 (18)
The original author is David Weis, an expert in the Wyckoff Method. The Weis Wave is a modern adaptation of the 1930's Wyckoff Method, another expert in Tape Reading techniques and Chart Analysis. Weis Waves takes market volume and stacks it into waves according to price conditions giving the trader valuable insights about the market conditions. If you want to learn more about this subject you can find tons of videos in YouTube. Just look for "The Wickoff Method", "Weis Wave" and "Volume Spread
FREE
VP hidden
Emr Aljnaby
4.33 (12)
The indicator works to convert normal volume into levels and determine financial liquidity control points. It is very similar in function to Fixed Volume Profile. But it is considered more accurate and easier to use than the one found on Trading View because it calculates the full trading volumes in each candle and in all the brokers present in MetaTrade, unlike what is found in Trading View, as it only measures the broker’s displayed prices. To follow us on social media platforms: telegram
FREE
Easy VWAP
Luca Spinello
VWAP Indicator, the short form of Volume Weighted Average Price, is similar to a moving average but takes into consideration the tick volume of the candles. The indicator calculates the moving average multiplying the price of each candle for the tick volume in the candle. Said calculation weighs with more significance price where more transactions were made. Features: Visual styling customizable Period customizable Ease of use
FREE
AvgVolumes
Marco Montemari
5 (1)
This indicator is based on Volumes standard indicator, calculates the average of Volumes based on the last N bars set by users, and if the value of the volume is bigger then a set % respect the average a different color will be used. The indicator is shown in a separate indicator window. This version has now a limitation in setting the % about the threshold. If you are interested to set threshold consider to buy the PRO version ( https://www.mql5.com/en/market/product/35925 ) If you want to use
FREE
Market Profile 3 ForexArby com
Hussien Abdeltwab Hussien Ryad
4 (15)
Market Profile 3 MetaTrader 5 indicator  version 4.70— is a classic Market Profile implementation that can show the price density over time, outlining the most important price levels, value area, and control value of a given trading session. This indicator can be attached to timeframes between M1 and D1 and will show the Market Profile for daily, weekly, monthly, or even intraday sessions. Lower timeframes offer higher precision. Higher timeframes are recommended for better visibility. It is als
FREE
This indicator will mirror the assets in use in another metatrader, being able to choose the timeframe and a template. This is the Metatrader 5 Client, it needs the Metatrader 4 or 5 Server versions: Metatrader 4 Mirror Chart Server:   https://www.mql5.com/en/market/product/88644 Metatrader 5 Mirror Chart Server: https://www.mql5.com/en/market/product/88652 Details of how it works in the video.
FREE
Value Chart Candlesticks
Flavio Javier Jarabeck
4.69 (13)
The idea of a Value Chart indicator was presented in the very good book I read back in 2020 , " Dynamic Trading Indicators: Winning with Value Charts and Price Action Profile ", from the authors Mark Helweg and David Stendahl. The idea is simple and the result is pure genius: Present candlestick Price analysis in a detrended way! HOW TO READ THIS INDICATOR Look for Overbought and Oversold levels. Of course, you will need to test the settings a lot to find the "correct" one for your approach. It
FREE
The indicator highlights the points that a professional trader sees in ordinary indicators. VisualVol visually displays different volatility indicators on a single scale and a common align. Highlights the excess of volume indicators in color. At the same time, Tick and Real Volume, Actual range, ATR, candle size and return (open-close difference) can be displayed. Thanks to VisualVol, you will see the market periods and the right time for different trading operations. This version is intended f
FREE
Donchian Breakout And Rsi
Mattia Impicciatore
4.5 (2)
General Description This indicator is an enhanced version of the classic Donchian Channel , upgraded with practical trading functions. In addition to the standard three lines (high, low, and middle), the system detects breakouts and displays them visually with arrows on the chart, showing only the line opposite to the current trend direction for a cleaner view. The indicator includes: Visual signals : colored arrows on breakout Automatic notifications : popup, push, and email RSI filter : to val
FREE
Simple Trend Direction MT5
Khalaf Hamza Mohammad Yousef
This is a FREE Trend Direction Indicator for MetaTrader 5. Features: Identifies market trend direction Uses EMA 50 and EMA 200 Non-repainting logic Clear visual display Suitable for manual trading Free version includes: - Single timeframe - Trend direction only - No alerts If you need: Alerts Multi-timeframe version EA automation Custom modifications My Name is Khalaf Hamza , You can contact me for freelance work --> khalaf.hamza.hi@gmail.com
FREE
Swiss VWAPsimple
Terence Gronowski
4.8 (5)
Swiss VWAPsimple Motivation Did not find free VWAP that works, the one that I found craseh. So I created a VWAP which calculates values only for the actual day. So computer resouces are not over stressed. What is VWAP, how is it used?  VWAP stands for Volume Weighed Average Price, it calculates the running sum of tick volume and the runnung sum of price times tickvolume. The division of these sums result in a weighed price (Sum P*V/Sum V). The calculation starts normally at midnight. The values
FREE
Gm Volumes
Antonio Augusto Barreto De Melo
4 (3)
A simple volume indicator according to the color of the candle! - Custom background! - Supports Volume by Ticks or Real Volume. The original Metatrader Volume indicator does not show the colors of the bar according to the color of the Candle, it only changes color when the volume of a candle is greater than the previous one, this sometimes creates confusion for beginners and does not know the real reason for the color change. Free indicator, support may take a while to respond!
FREE
The indicator measures the accumulated balance of aggression. The formula is as follows:  Accumulated   = Previous Candle Accumulated + Purchase Volume - Sales Volume. Know our products    *** Did you like the product? Then, help us doing review in the " Reviews " tab. The indicator sends information to your email or cell phone when the accumulated balance changes direction. Example : Accumulated seller becomes a buyer. Note : It is recommended to use the default configuration and VPS valu
Expansoes M
Marcus Vinicius Da Silva Miranda
The M Extensions are variations of the Golden Ratio (Fibonacci Sequence). It is the World's first technique developed for Candle Projections. Advantages: Easy to plot. Candle anchoring; High and accurate precision as support and resistance; Excellent Risk x Return ratio; Works in any timeframe; Works in any asset / market.   The M Extensions are classified into: M0: Zero point (starting candle) RC: Initial candle control region M1: Extension region 1 M2: Extension region 2 M3: Extension regi
FREE
Opening Levels Indicator MT5 Opening Levels is an MT5 indicator that displays open price levels from multiple timeframes directly on the chart. It provides a structured way to observe how price behaves around key reference levels such as the daily, weekly, and monthly open. Overview The indicator plots open price levels across selected timeframes and keeps them updated in real time. These levels can be used as reference points for: intraday trading levels market structure observation support and
FREE
Premium https://www.mql5.com/en/market/product/167272 BITCOIN DAILY TOP BOTTOM ENGINE (V1) This is not a simple indicator. This is a professional-grade market observation and decision engine designed for serious Bitcoin traders who demand clarity, structure, and precision. The Bitcoin Daily Top Bottom Engine is built to identify high-probability daily extremes using adaptive range logic, sweep behavior analysis, and market condition filtering. Instead of reacting late, this engine prepares y
FREE
LT Donchian Channel
Thiago Duarte
4.86 (7)
Donchian Channel is an indicator created by Richard Donchian. It is formed by taking the highest high and the lowest low of the last specified period in candles. The area between high and low is the channel for the chosen period. Its configuration is simple. It is possible to have the average between the upper and lower lines, plus you have alerts when price hits one side. If you have any questions or find any bugs, please contact me. Enjoy!
FREE
Haven Volume Profile
Maksim Tarutin
4.56 (9)
Haven Volume Profile is a multifunctional indicator for volume profile analysis that helps identify key price levels based on the distribution of trading volume. It is designed for professional traders who want to better understand the market and identify important entry and exit points for trades. Other Products ->  HERE Main features: Point of Control (POC) calculation - the level of maximum trading activity, which helps identify the most liquid levels Value Area definition (area of increased
FREE
Bneu News Filter
Marvinson Salavia Caballero
``` Bneu News Filter Free — Economic Calendar Protection Utility for MT5 Bneu News Filter is a trading utility Expert Advisor for MetaTrader 5 designed to monitor economic calendar events and protect trading activity during high-impact news releases. The utility provides automatic position management and a visual panel interface for monitoring upcoming events. Main Functionality Economic Calendar Integration: - Automatic retrieval of economic calendar events from MetaTrader 5 built-in calen
FREE
Automatic Vwap Midas
Ricardo Almeida Branco
5 (1)
The 3 Automatic Vwap (Midas) Indicator can be used for Price and Volume studyers to map the movement of market drivers. It automatically plots 3 Vwaps, two of which are dynamic and will be updated throughout the day if new highs or new lows emerge. The third Vwap is daily and can help if the trend is up or down. Also, an auxiliary indicator that plots (also dynamic) points of interest with OHLC prices (Open, High and Low of the current day and Close of the previous day) was inserted. Success and
Indicator Description 4 Hull MA Color + Envelopes is a powerful trend-following indicator for MetaTrader 5 that combines four Hull Moving Averages (HMA) with Moving Average Envelopes to clearly identify market direction, trend strength, and potential reversal or pullback zones. This indicator is designed to reduce noise, react quickly to price movement, and provide a clean visual structure for professional trading.   Key Features   4 Hull Moving Averages (20, 50, 100, 200) Automatic color change
FREE
Buyers of this product also purchase
SuperScalp Pro
Van Minh Nguyen
4.72 (18)
SuperScalp Pro – Advanced Multi-Filter Scalping Indicator System SuperScalp Pro is an advanced scalping indicator system that combines the classic Supertrend with multiple intelligent confirmation filters. The indicator performs efficiently across all timeframes from M1 to H4 and is especially suitable for XAUUSD, BTCUSD and major Forex pairs. It can be used as a standalone system or flexibly integrated into existing trading strategies. The indicator integrates more than 11 filters, including fa
Power Candles MT5
Daniel Stein
4.75 (8)
Power Candles – Strength-Based Entry Signals for Any Market Power Candles brings Stein Investments’ proven strength analysis directly onto your price chart. Instead of reacting to price alone, each candle is colored based on real market strength, allowing you to instantly identify momentum build-ups, strength acceleration, and clean trend transitions. One Logic for All Markets Power Candles works automatically on all trading symbols . The indicator detects whether the current symbol is a Forex p
Entry In The Zone and SMC Multi Timeframe is a real-time 2-in-1 market analysis tool that combines market structure analysis and a No Repaint BUY / SELL signal system into a single indicator, built on Smart Money Concepts (SMC) — a widely adopted framework used by professional traders to understand market structure. This indicator helps you see the market more clearly, make decisions based on structure rather than guesswork, and focus on high-probability zones where price is more likely to react
Divergence Bomber
Ihor Otkydach
4.9 (86)
Each buyer of this indicator also receives the following for free: The custom utility "Bomber Utility", which automatically manages every trade, sets Stop Loss and Take Profit levels, and closes trades according to the rules of this strategy Set files for configuring the indicator for various assets Set files for configuring Bomber Utility in the following modes: "Minimum Risk", "Balanced Risk", and "Wait-and-See Strategy" A step-by-step video manual to help you quickly install, configure, and s
Azimuth Pro
Ottaviano De Cicco
5 (6)
Azimuth Pro V2: Synthetic Fractal Structure and Confirmed Entries for MT5 Overview Azimuth Pro is a multi-level swing structure indicator by Merkava Labs . Four nested swing layers, swing-anchored VWAP, ABC pattern detection, three-timeframe structural filtering, and closed-bar confirmed entries — one chart, one workflow from micro-swings to macro-cycles. This is not a blind signal product. It is a structure-first workflow for traders who care about location, context, and timing. V2 Launch Offe
OmniSync Projection
Antonio-alin Teculescu
5 (1)
Chronos Fractal Engine is an innovative price projection indicator for MetaTrader 5, designed to transform your technical analysis by intelligently identifying and projecting historical price patterns. Built upon an advanced correlation algorithm and the fractal principles of the market, this powerful tool visualizes potential future price movements, giving you a unique edge in your trading decisions. What is Chronos Fractal Engine? At its core, the Chronos Fractal Engine employs a sophisticat
New Update of   Smart Trend Trading System MT5 For  2026 Market: If You Buy this Indicator you will Get my Professional Trade Manager + EA  for FREE . First of all Its worth emphasizing here that this Trading System is Non-Repainting   , Non Redrawing and Non Lagging Indicator Which makes it ideal from both manual and robot trading .  [Online course] , [manual] and [download presets] . The Smart Trend Trading System MT5 is a comprehensive trading solution tailored for new and experienced traders
Trend Screener Pro MT5
STE S.S.COMPANY
4.85 (104)
Trend Screener Indicator --Professional Trend Trading & Market Scanning System for MetaTrader Unlock the true power of trend trading with Trend Screener Indicator — a complete multi-currency, multi-timeframe trend analysis solution powered by Fuzzy Logic,Trend Pulse Technology  and advanced market structure algorithms.   Trend Screener transforms your MetaTrader platform into a professional-grade Trend Analyzer and Market Scanner, helping you identify high-probability trend opportunities, early
Meridian Pro
Ottaviano De Cicco
5 (1)
Meridian Pro: Professional Multi-Timeframe Trend Matrix for MT5 Overview Meridian Pro is a multi-timeframe trend matrix by Merkava Labs that compresses directional state, strength, momentum condition and matrix agreement into one compact panel. One adaptive engine, applied consistently from M1 to W1. No per-symbol tuning. No indicator stacking. One structured readout across every asset and every timeframe. Launch Offer — Get Meridian Pro for USD 99 (introductory). Regular price: USD 149. 1. Why
Quantum TrendPulse
Bogdan Ion Puscasu
5 (22)
Introducing Quantum TrendPulse , the ultimate trading tool that combines the power of SuperTrend , RSI , and Stochastic into one comprehensive indicator to maximize your trading potential. Designed for traders who seek precision and efficiency, this indicator helps you identify market trends, momentum shifts, and optimal entry and exit points with confidence. Key Features: SuperTrend Integration: Easily follow the prevailing market trend and ride the wave of profitability. RSI Precision: Detect
Btmm state engine pro
Garry James Goodchild
5 (3)
BTMM State Engine Pro is a MetaTrader 5 indicator for traders who use the Beat The Market Maker approach: Asian session context, kill zone timing, level progression, peak formation detection, and a multi-pair scanner from a single chart. It combines cycle state logic with a built-in scanner dashboard so you do not need the same tool on many charts at once. What it does Draws the Asian session range; session times can follow broker server offset or be set in inputs. Tracks level progression (L
FX Trend MT5 NG
Daniel Stein
5 (4)
FX Trend NG: The Next Generation Multi-Market Trend Intelligence Overview FX Trend NG is a professional multi-timeframe trend and market monitoring tool designed to give you a complete structural overview of the market in seconds. Instead of switching between dozens of charts, you instantly see which symbols are trending, where momentum is fading, and where strong alignment exists across timeframes. Launch Offer – Get FX Trend NG for $30 (6 Months) or $80 Lifetime . Already part of the Stein I
Gann Made Easy   is a professional and easy to use Forex trading system which is based on the best principles of trading using the theory of W.D. Gann. The indicator provides accurate BUY and SELL signals including Stop Loss and Take Profit levels. You can trade even on the go using PUSH notifications. PLEASE CONTACT ME AFTER PURCHASE TO GET TRADING  INSTRUCTIONS   AND GREAT EXTRA INDICATORS   FOR FREE! Probably you already   heard   about the Gann trading methods before. Usually the Gann theory
ARICoins
Temirlan Kdyrkhan
ARICoin is a powerful trading companion designed to generate high-probability entry signals with dynamic TP/SL/DP levels based on volatility. Built-in performance tracking shows win/loss stats, PP1/PP2 hits, and success rates all updated live. Key Features: Buy/Sell signals with adaptive volatility bands Real-time TP/SL/DP levels based on ATR Built-in MA Filter with optional ATR/StdDev volatility Performance stats panel (Success, Profit/Loss, PP1/PP2) Alerts via popup, sound, push, or email Cust
Trend indicator AI mt5
Ramil Minniakhmetov
5 (16)
Trend Ai indicator  mt5 is great tool that will enhance a trader’s market analysis by combining trend identification with actionable entry points and reversal alerts.  This indicator empowers users to navigate the complexities of the forex market with confidence and precision Beyond the primary signals, Trend Ai indicator identifies secondary entry points that arise during pullbacks or retracements, enabling traders to capitalize on price corrections within the established trend. Important Advan
See which strategy actually works on your symbol - before you risk real money. Power Bar detects extreme price bars on any symbol and any timeframe, then instantly backtests 3 different trading strategies so you can compare win rates, profit factors, and P&L side by side. All in a single interactive panel. No guessing. No curve-fitting. Just data. What makes Power Bar unique? Most indicators give you a signal and leave you guessing whether it works. Power Bar goes further: it tests every signal
Atomic Analyst MT5
Issam Kassas
3.94 (31)
New Update of   Atomic Analyst MT5 For  2026 Market: If You Buy this Indicator you will Get my Professional   Trade Manager + EA  for   FREE . First of all Its worth emphasizing here that this Trading Indicator is   Non-Repainting   , Non Redrawing and Non Lagging Indicator   Indicator, Which makes it ideal from both manual and robot trading.  User manual: settings, inputs and strategy . The Atomic Analyst  is a PA Price Action Indicator that uses Strength and Momentum of the price to find a bet
First of all Its worth emphasizing here that this Trading Tool is Non Repainting , Non Redrawing and Non Lagging Indicator , Which makes it ideal for professional trading . [Online course] ,   and   [manual] The Smart Price Action Concepts Indicator is a very powerful tool for both new and experienced traders . It packs more than 20 useful indicators into one , combining advanced trading ideas like Inner Circle Trader Analysis and Smart Money Concepts Trading Strategies . This indicator focuses
Crystal Heikin Ashi Signals
Muhammad Jawad Shabir
5 (2)
Crystal Heikin Ashi Signals - Professional Trend & Signal Detection Indicator Advanced Heikin Ashi Visualization with Intelligent Signal System for Manual & Automated Trading Final Price: $149 ---------> Price goes up $10 after every 10 sales . Limited slots available — act fast . Overview Crystal Heikin Ashi Signals is a professional-grade MetaTrader 5 indicator that combines pure Heikin Ashi candle visualization with an advanced momentum-shift detection system. Designed for both manual traders
FX Power MT5 NG
Daniel Stein
5 (31)
FX Power: Analyze Currency Strength for Smarter Trading Decisions Overview FX Power is your go-to tool for understanding the real strength of currencies and Gold in any market condition. By identifying strong currencies to buy and weak ones to sell, FX Power simplifies trading decisions and uncovers high-probability opportunities. Whether you’re looking to follow trends or anticipate reversals using extreme delta values, this tool adapts seamlessly to your trading style. Don’t just trade—trade
Auto Optimized Parabolic RSI: Advanced 3D Momentum Engine Most retail indicators fail because they rely on static inputs that break the moment market volatility shifts. Auto Optimized Parabolic RSI solves the problem of "indicator decay" by continuously recalculating its own mathematical edge, bringing institutional-grade quantitative adaptation directly to your MT5 terminal. The Core Advantage: Custom In-Memory 3D Optimization Standard auto-optimizers often freeze the MT5 platform because they
Bill Williams Advanced
Siarhei Vashchylka
5 (11)
Bill Williams Advanced is designed for automatic chart analysis using Bill Williams' "Profitunity" system. The indicator analyzes four timeframes at once. Manual (Be sure to read before purchasing) Advantages 1. Analyzes the chart using Bill Williams' "Profitunity" system. Signals are displayed in a table in the corner of the screen and on the price chart. 2. Finds all known AO and AC signals, as well as zone signals. Equipped with a trend filter based on the Alligator. 3. Finds "Divergence Bar
Weltrade Spike Sentinel
Batsirayi L Marango
5 (1)
Introducing Indicator for PainX and GainX Indices Traders on Weltrade Get ready to experience the power of trading with our indicator, specifically designed for Weltrade   broker's PainX and GainX Indices.  Advanced Strategies for Unbeatable Insights Our indicator employs sophisticated strategies to analyze market trends, pinpointing optimal entry and exit points.  Optimized for Maximum Performance To ensure optimal results, our indicator is carefully calibrated for 5-minute timeframe charts on
RelicusRoad Pro: Quantitative Market Operating System 70% OFF LIFETIME ACCESS (LIMITED TIME) - JOIN 2,000+ TRADERS Why do most traders fail even with "perfect" indicators? Because they trade Single Concepts in a vacuum. A signal without context is a gamble. To win consistently, you need CONFLUENCE . RelicusRoad Pro is not a simple arrow indicator. It is a complete Quantitative Market Ecosystem . It maps the "Fair Value Road" price travels on, distinguishing between random noise and true structur
RFI levels PRO MT5
Roman Podpora
3.67 (3)
The indicator accurately shows the reversal points and price return zones where the   Major players . You see where new trends are forming and make decisions with maximum precision, maintaining control over every trade. VERSION MT4     -    Reveals its maximum potential when combined with the   TREND LINES PRO   indicator What the indicator shows: Reversal structures and reversal levels with activation at the beginning of a new trend. Display of   TAKE PROFIT   and   STOP LOSS   levels with min
CGE Trading Suite
Carl Gustav Johan Ekstrom
5 (1)
CGE Trading Suite delivers the analytical edge typically reserved for professional trading desks. The platform integrates a full suite of analytical tools into one seamless workflow: dynamic grid mapping, liquidity behavior analysis, ECM, trend lines, MIDAS, trade cycles, and directional channel projections. Together, these provide a unified view of market structure and momentum. Directional clarity is further enhanced by the capital flow index, which measures currency basket strength to identif
Berma Bands
Muhammad Elbermawi
5 (8)
The Berma Bands (BBs) indicator is a valuable tool for traders seeking to identify and capitalize on market trends. By analyzing the relationship between the price and the BBs, traders can discern whether a market is in a trending or ranging phase. Visit the [ Berma Home Blog ] to know more. Berma Bands are composed of three distinct lines: the Upper Berma Band, the Middle Berma Band, and the Lower Berma Band. These lines are plotted around the price, creating a visual representation of the pric
ARIPoint
Temirlan Kdyrkhan
ARIPoint is a powerful trading companion designed to generate high-probability entry signals with dynamic TP/SL/DP levels based on volatility. Built-in performance tracking shows win/loss stats, PP1/PP2 hits, and success rates all updated live. Key Features: Buy/Sell signals with adaptive volatility bands Real-time TP/SL/DP levels based on ATR Built-in MA Filter with optional ATR/StdDev volatility Performance stats panel (Success, Profit/Loss, PP1/PP2) Alerts via popup, sound, push, or email Cu
Advanced Supply Demand MT5
Bernhard Schweigert
4.53 (15)
Best Solution for any Newbie or Expert Trader! This indicator is a unique, high quality and affordable trading tool because we have incorporated a number of proprietary features and a new formula. With this update, you will be able to show double timeframe zones. You will not only be able to show a higher TF but to show both, the chart TF, PLUS the higher TF: SHOWING NESTED ZONES. All Supply Demand traders will love it. :) Important Information Revealed Maximize the potential of Advanced Supply
PZ Trend Trading MT5
PZ TRADING SLU
3.8 (5)
Capture every opportunity: your go-to indicator for profitable trend trading Trend Trading is an indicator designed to profit as much as possible from trends taking place in the market, by timing pullbacks and breakouts. It finds trading opportunities by analyzing what the price is doing during established trends. [ Installation Guide | Update Guide | Troubleshooting | FAQ | All Products ] Trade financial markets with confidence and efficiency Profit from established trends without getting whip
More from author
Shortcuts MT5 Hotkeys Scalping
Pablo Filipe Soares De Almeida
5 (2)
https://www.mql5.com/en/blogs/post/768319 Key Commands B - Buy. S - Sell. 1-2-3 - Buy (customizable lots) 4-5-6 - Sell (customizable lots) L - Buy Limit. M - Sell Limit. U - Buy Stop. N - Sell Stop. Q - Remove Stop Loss. W - Remove Take Profit C - Closes all open positions. X - Closes a specific position. Z - Cancels all pending orders. T - Trailing stop. P - Partial. K - Breakeven. O - Positions 7-8-9 - Custom Timeframes A - Draw Risk/Reward Guide F - Draw Fibonacci Retracement R - Draw Recta
MA Alerts
Pablo Filipe Soares De Almeida
5 (1)
Moving Average Alerts is a simple and efficient indicator that contains 4 fully configurable moving averages, allowing the trader to choose periods, methods, and settings according to their strategy. Each moving average has two independent alerts, which can be enabled or disabled separately: Alert when the price closes above the moving average Alert when the price closes below the moving average The alerts are triggered only at candle close, avoiding repeated or false signals during price forma
FREE
Stochastic Color Alerts
Pablo Filipe Soares De Almeida
5 (1)
Stochastic Color Alerts Stochastic Color is a custom Stochastic oscillator with dynamic color changes and an integrated alert system to identify momentum direction and crossover signals. The main line (%K) changes color automatically: Green: upward momentum Red: downward momentum Orange: current forming candle The indicator is based on classic %K, %D and Slowing parameters, with configurable periods and standard levels at 20 and 80. Alert types included: Buy/Sell alerts on %K and %D cross in o
FREE
Scale Fixed
Pablo Filipe Soares De Almeida
5 (1)
Fixed Scale Indicator for MetaTrader 5 Just click three times to enable or disable the centered price scale. The scale automatically adjusts according to market movement. Functionality Toggle Fixed Scale: Enable or disable the fixed scale by clicking three times on the price axis (right side of the chart). Price Centering: Maintains the price centered on the chart during market movements. Scale Adjustment: Automatically adjusts the chart scale based on price changes.
ROC Color
Pablo Filipe Soares De Almeida
Colored ROC with Moving Average and Alerts - Advanced Momentum Indicator Enhanced Rate of Change (ROC)! This custom indicator for MetaTrader 5 offers a clear and intuitive view of market momentum, ideal for traders seeking precise signals of trend acceleration or deceleration. What is ROC and its advantages? The Rate of Change (ROC) is a pure momentum oscillator that measures the percentage change in price relative to a previous period. It highlights the speed and strength of price movements: Po
Trading Report
Pablo Filipe Soares De Almeida
TRADING REPORT Mini-dashboard for MetaTrader 5 Main features Updates on every tick (open position and floating P/L in real time) Current position details (BUY/SELL + volume + entry price + floating P/L with green/red color) Daily P/L and today’s balance change  Full statistics: Balance, Equity, Total trades, Wins/Losses, Winrate (%), Profit Factor, Best trade, Worst trade Clickable “Report” button: one click to show, one click to completely hide the panel (perfect for cleaning the screen) Fully
FREE
Shortcuts MT4 Hotkeys Scalping
Pablo Filipe Soares De Almeida
MT4 Hotkeys – Order and Position Management Tool This tool enables users to manage orders and positions on the MetaTrader 4 platform using keyboard shortcuts. It supports order execution, position closure, trailing stop adjustments, and risk management through customizable settings. Key Commands "B": Places a buy order. "S": Places a sell order. "C": Closes all open positions. "X": Closes a specific position (oldest or most recent, based on configuration). "T": Activates a trailing stop, adjust
ClassicMACD
Pablo Filipe Soares De Almeida
5 (1)
Classic MACD for MetaTrader 5 This indicator delivers a faithful implementation of the classic Moving Average Convergence Divergence (MACD) as originally designed by Gerald Appel, tailored specifically for MetaTrader 5. It empowers traders to identify market trends, momentum shifts, and potential reversal points through its core components: the MACD line, signal line, and histogram. The MACD line is calculated as the difference between two exponential moving averages (typically 12-period and 26
MultiChart Pro
Pablo Filipe Soares De Almeida
MultiChart Pro – Chart Management Tool for MetaTrader 5 This Expert Advisor (EA) enables users to automate the opening and configuration of charts in MetaTrader 5. It supports the setup of up to four charts with specified timeframes and templates, including offline charts. Functionality Chart Opening: Opens up to three additional charts (e.g., D1, M1, M15) and one offline chart (e.g., 10 seconds), while configuring the current chart (e.g., M5). Template Application: Applies user-defined templat
Time and Sales Tick
Pablo Filipe Soares De Almeida
Time & Sales Tick Indicator for MetaTrader 5 This indicator displays real-time trading tick information on MetaTrader 5 charts. It presents price, tick volume, and time. Functionality Displays tick data, including price, volume, and time, in a panel on the chart. Groups ticks into user-defined intervals, with color-coded price movements (green for upward, red for downward). Allows panel positioning in any chart corner.
Partial
Pablo Filipe Soares De Almeida
Partial Close Manager – Trade Volume Adjustment Tool This tool enables users to perform partial closes on open trades in MetaTrader 5. Functionality Partial Close: Close a portion of open trades with one action. Volume Calculation: Automatically calculates the volume to be closed, eliminating manual input. Multi-Order Support: Applies partial closes to all open orders on the same symbol simultaneously. Draggable Table: Click and hold the header to move the table anywhere on the chart.
HighLow Fury EA
Pablo Filipe Soares De Almeida
HighLow Fury EA Breakout trading robot with risk and capital management. Dynamic lot sizing based on account risk % or fixed lots Daily gain/loss limits to protect equity Smart capital reduction after target profits/losses Multiple trailing stop options (Highest/Lowest, previous candles) Custom time/day filters + position lifetime control Configured with optimized parameters for XAUUSD (2025). Users can adjust all settings to suit their strategy.
Volume Candle Indicator
Pablo Filipe Soares De Almeida
Volume Color Histogram for MetaTrader 5. This indicator displays volume as a histogram in a separate window. The bars are colored based on the direction of the price candle: green for bullish (close > open) and red for bearish (close < open). Key Features Volume source: Tick volume or real volume (user-selectable). Optional moving average line over the volume histogram, which can be enabled via input. Supported average types: SMA, EMA, SMMA, LWMA. Average period is configurable. Compatible with
Day Of Week SMA
Pablo Filipe Soares De Almeida
The Day Of Week SMA indicator calculates a moving average based on the closing prices of a specific day of the week chosen by the user. It supports various types of moving averages including Simple (SMA), Exponential (EMA), Smoothed (SMMA), and Linear Weighted (LWMA). The period defines how many instances of the selected day to include in the calculation. This tool is useful for analyzing weekly patterns in financial markets, helping traders identify trends specific to certain days. By focusing
High Low MTF
Pablo Filipe Soares De Almeida
High Low MTF – Multi-Timeframe High & Low Levels High Low MTF is a professional indicator designed for traders who want to visualize powerful support and resistance zones based on highs and lows from any timeframe. It allows you to display maximum and minimum levels from smaller or higher periods directly on your current chart, providing a complete multi-timeframe market view. It works for day traders, scalpers, swing traders and even algorithmic systems using iCustom. The indicator automatical
Seasonal Cycle
Pablo Filipe Soares De Almeida
Seasonal MT5 Indicator  Discover the power of market seasonality with the Seasonal MT5 indicator, designed for the daily timeframe to identify and visualize recurring price patterns based on historical data. Perfect for traders seeking a data-driven edge in forex, stocks, or commodities. Key Functionalities: - Plots a seasonal trend line based on historical daily price data, highlighting predictable market cycles. - Displays a straight line connecting seasonal extremes for trend reference. - D
GSV Williams
Pablo Filipe Soares De Almeida
GSV – Guided Swing Value Levels The GSV – Guided Swing Value Levels is a unique indicator developed for traders who want to find price regions where the market tends to react with greater statistical accuracy. Its calculation is inspired by concepts presented by Larry Williams in his book “Long-Term Secrets to Short-Term Trading” , which highlights the importance of the statistical average of market swings to forecast areas where price will likely stop, correct, or reverse. This indicator uses t
Pivot Price Round
Pablo Filipe Soares De Almeida
Pivot Round Price is an indicator based on the classic Pivot Points formulas (Classic Pivots), maintaining exactly the original calculations of support, resistance, and central pivot, without changing any part of the standard mathematics used. The difference and main advantage of this indicator is that the levels are automatically adjusted to rounded prices, making visualization easier on assets with multiple decimal places and making the levels much more relevant on the actual asset chart. With
Avwap
Pablo Filipe Soares De Almeida
Avwap Main features: Automatic Daily VWAP (perfect reset every day at 00:00 server time) 8 price types for calculation: Close, (H+L+C)/3, (H+L)/2, (O+C)/2, (O+H+L+C)/4 and more Anchored VWAP mode: just drag the vertical line to any point in the past and VWAP instantly recalculates from that moment Color, thickness and vertical line style 100% customizable (you choose how you want to view the anchor) No labels or texts on the chart Extremely optimized code The big advantage of Anchored VWAP: The
LBR Oscillator
Pablo Filipe Soares De Almeida
LBR Oscillator – 3/10 Oscillator The LBR Oscillator is an enhanced version of the classic 3/10 Oscillator, widely used and popularized by professional trader Linda Raschke. This indicator was developed following the original standard configuration used by Linda Raschke, with 3- and 10-period moving averages and a 16-period signal line, focused on reading momentum and changes in market rhythm. Conceptual Basis – How Linda Raschke Uses the 3/10 Oscillator Linda Raschke uses the 3/10 Oscillator as
Keltner Channel Color
Pablo Filipe Soares De Almeida
The Keltner Channel Color is a custom indicator for MetaTrader 5 (MQL5) designed to enhance the visualization of trends and volatility on the chart. It colors the bars or candles based on their relative position to the Keltner Channel, helping traders quickly identify high, low, and breakout zones. Ideal for trend following, scalping, or volatility analysis strategies, this indicator simplifies market reading by highlighting bars above or below the Keltner bands, as well as bars that close above
Taylor Pivot
Pablo Filipe Soares De Almeida
Note: This indicator plots only the Taylor Pivot . The ROC indicator is not included and is not displayed separately. The Taylor Pivot is an indicator based on a classic short-term trading technique originally developed by Taylor and later popularized by professional trader Linda Raschke in her book. Raschke highlights this approach as a simple way to identify the market’s likely short-term direction, focusing on a single positioning decision per day (buy or sell), which reduces psychological s
Bollinger Alerts
Pablo Filipe Soares De Almeida
Bollinger Alerts is a classic Bollinger Bands indicator enhanced with an intelligent alert system, designed to help traders clearly identify overbought and oversold conditions. The indicator plots the three traditional bands: Upper Band Middle Band (Moving Average) Lower Band In addition, it features configurable alerts, allowing traders to be automatically notified whenever price reaches statistically extreme regions. Integrated Alert System Alerts are generated only at candle close, ensuring g
Tick Chart Custom
Pablo Filipe Soares De Almeida
Tick Chart Custom Advanced Tick Chart + Full Order Mirror on Offline Chart An essential tool for scalpers, day traders, and anyone seeking maximum detail in price movements. Unlike traditional time-based charts (such as M1), Tick Chart MT5 generates bars based on real N ticks (configurable from 10 to 1000+). This means: Granular market visualization: Each bar represents an exact number of ticks, capturing real movements that time-based bars ignore. Perfect for identifying fast patterns, squeeze
Scanner Market
Pablo Filipe Soares De Almeida
Scanner Market Scanner Market lets you open any asset with a single click directly in the same chart window. No need to open new charts or scroll through Market Watch — one click and the selected symbol is loaded instantly. Designed for traders who need speed, such as scalpers and tape readers. The scanner uses a fully customizable floating panel that can be dragged to any area of the chart and hidden with one click using the Screener button. Available filters and sorting: Daily % (High → Low)
Fractal Zones Decision
Pablo Filipe Soares De Almeida
FRACTAL ZONES DECISION – The Indicator That Turns Fractals into Real Decision Zones It identifies Double Fractals (when a candle forms both a bullish and bearish fractal at the same time), creating real zones of market indecision. These zones act as true institutional support and resistance, much stronger than traditional fractals. What the indicator does for you: Draws classic fractals with arrows (can be turned off if desired) Draws special dotted lines highlighting indecision zones (with se
Filter:
No reviews
Reply to review