Published products

https://www.mql5.com/en/blogs/post/768319 Key Commands i - EA Control Panel. E - Trade Assistant. G - Performance Panel J - News Filter Panel B - Buy. S - Sell. 1-2-3 - Buy (customizable lots) 4-5-6 - Sell (customizable lots) L - Buy Limit. M - Sell Limit. U - Buy Stop. N - Sell Stop. Q - Remove Stop Loss. W - Remove Take Profit C - Closes all open positions. X - Closes a specific position. Z - Cancels all pending orders. T - Trailing stop. P - Partial. K - Breakeven. O - Positions 7-8-9 - Custo

Tick Chart Custom
Anti-Repaint Persistence & Smart Refresh System One of the most powerful features of this indicator is the "Use Anti-Repaint Persistence" . This function was created so that even if you close MetaTrader 5 or reopen the chart after hours or days, the tick chart will be restored exactly as it was, preserving the exact same visual appearance and all calculated data. This ensures that your indicators (especially those sensitive to bar history) continue working with the same parame
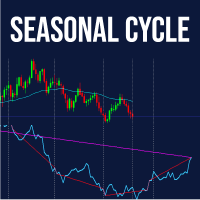
Seasonal MT5 Indicator
Discover the power of market seasonality with the Seasonal MT5 indicator, designed for the daily timeframe to identify and visualize recurring price patterns based on historical data. Perfect for traders seeking a data-driven edge in forex, stocks, or commodities.
Key Functionalities: - Plots a seasonal trend line based on historical daily price data, highlighting predictable market cycles.
- Displays a straight line connecting seasonal extremes for trend reference.
- D

TRADING REPORT Mini-dashboard for MetaTrader 5 Main features Updates on every tick (open position and floating P/L in real time) Current position details (BUY/SELL + volume + entry price + floating P/L with green/red color) Daily P/L and today’s balance change Full statistics: Balance, Equity, Total trades, Wins/Losses, Winrate (%), Profit Factor, Best trade, Worst trade Clickable “Report” button: one click to show, one click to completely hide the panel (perfect for cleaning the screen) Fully
FREE
MT4 Hotkeys – Order and Position Management Tool This tool enables users to manage orders and positions on the MetaTrader 4 platform using keyboard shortcuts. It supports order execution, position closure, trailing stop adjustments, and risk management through customizable settings. Key Commands "B": Places a buy order. "S": Places a sell order. "C": Closes all open positions. "X": Closes a specific position (oldest or most recent, based on configuration). "T": Activates a trailing stop, adjust

"Renko Chart Custom"
This Expert Advisor creates a custom offline Renko chart in real time with high precision and stability. Perfect for traders looking for a clean market view, eliminating noise and focusing on the true price direction. Main Features
6 Advanced Brick Size Methods "Fixed" — Fixed size in points
"ATR M1" — Based on ATR from the M1 timeframe
"ATR Daily" — Daily ATR divided by a divisor (great for real daily volatility)
"% of Price" — Percentage of the current price (ideal for XA

Time Boxes – Precision and Detailed Market Reading If you've ever tried trading with tick charts, Renko, or even multiple timeframes, you know how difficult it is to understand exactly what's happening inside each candle. That's exactly why I developed Time Boxes . I mainly use this indicator to calibrate my offline tick chart with the current chart , allowing me to visualize the exact number of candles that form each tick bar. This makes it much clearer to identify when the market is accelerati

RSI Color Alerts
RSI Color Alerts is a custom indicator based on the classic Relative Strength Index (RSI), developed by J. Welles Wilder.
The RSI is a momentum oscillator that measures the speed and strength of recent price movements. It oscillates between 0 and 100 and helps traders identify overbought (above 70) and oversold (below 30) conditions, signaling potential reversal or correction points in the market. Key Indicator Highlights: RSI Line with Dynamic Coloring
The RSI line changes co

FRACTAL ZONES DECISION – The Indicator That Turns Fractals into Real Decision Zones
It identifies Double Fractals (when a candle forms both a bullish and bearish fractal at the same time), creating real zones of market indecision. These zones act as true institutional support and resistance, much stronger than traditional fractals.
What the indicator does for you:
Draws classic fractals with arrows (can be turned off if desired)
Draws special dotted lines highlighting indecision zones (with se

MA Distance Histogram The MA Distance Histogram is an indicator that displays, in histogram form, the distance between the closing price (Close) and a Moving Average, providing a clear visualization of market strength and momentum. Positive values indicate that the price is above the moving average, representing buying pressure (bulls).
Negative values indicate that the price is below the moving average, representing selling pressure (bears). The indicator uses ATR (Average True Range) to normal

Scanner Market Scanner Market lets you open any asset with a single click directly in the same chart window.
No need to open new charts or scroll through Market Watch — one click and the selected symbol is loaded instantly. Designed for traders who need speed, such as scalpers and tape readers. The scanner uses a fully customizable floating panel that can be dragged to any area of the chart and hidden with one click using the Screener button. Available filters and sorting: Daily % (High → Low)

Bollinger Alerts is a classic Bollinger Bands indicator enhanced with an intelligent alert system, designed to help traders clearly identify overbought and oversold conditions. The indicator plots the three traditional bands: Upper Band
Middle Band (Moving Average)
Lower Band In addition, it features configurable alerts, allowing traders to be automatically notified whenever price reaches statistically extreme regions. Integrated Alert System Alerts are generated only at candle close, ensuring g

Stochastic Color Alerts
Stochastic Color is a custom Stochastic oscillator with dynamic color changes and an integrated alert system to identify momentum direction and crossover signals. The main line (%K) changes color automatically:
Green: upward momentum
Red: downward momentum
Orange: current forming candle The indicator is based on classic %K, %D and Slowing parameters, with configurable periods and standard levels at 20 and 80. Alert types included:
Buy/Sell alerts on %K and %D cross in o

Moving Average Alerts is a simple and efficient indicator that contains 4 fully configurable moving averages, allowing the trader to choose periods, methods, and settings according to their strategy. Each moving average has two independent alerts, which can be enabled or disabled separately: Alert when the price closes above the moving average
Alert when the price closes below the moving average The alerts are triggered only at candle close, avoiding repeated or false signals during price forma

Note: This indicator plots only the Taylor Pivot . The ROC indicator is not included and is not displayed separately.
The Taylor Pivot is an indicator based on a classic short-term trading technique originally developed by Taylor and later popularized by professional trader Linda Raschke in her book. Raschke highlights this approach as a simple way to identify the market’s likely short-term direction, focusing on a single positioning decision per day (buy or sell), which reduces psychological s

Colored ROC with Moving Average and Alerts - Advanced Momentum Indicator Enhanced Rate of Change (ROC)! This custom indicator for MetaTrader 5 offers a clear and intuitive view of market momentum, ideal for traders seeking precise signals of trend acceleration or deceleration. What is ROC and its advantages? The Rate of Change (ROC) is a pure momentum oscillator that measures the percentage change in price relative to a previous period. It highlights the speed and strength of price movements: Po

LBR Oscillator – 3/10 Oscillator The LBR Oscillator is an enhanced version of the classic 3/10 Oscillator, widely used and popularized by professional trader Linda Raschke.
This indicator was developed following the original standard configuration used by Linda Raschke, with 3- and 10-period moving averages and a 16-period signal line, focused on reading momentum and changes in market rhythm. Conceptual Basis – How Linda Raschke Uses the 3/10 Oscillator Linda Raschke uses the 3/10 Oscillator as

XAU vs USD — AUTOMATED EXPERT ADVISOR FOR GOLD (XAUUSD) - 24H XAU vs USD is an Expert Advisor developed exclusively to trade the XAUUSD pair, focused on ease of use and built-in risk management. SIMPLE SETUP, NO HASSLE.
The EA comes ready to use, with a conservative configuration and minimum lot size (0.01), ideal for those who want to test safely or trade with low risk from the start. There's no need to adjust dozens of parameters — just attach it to the chart. AUTOMATIC BROKER COMPATIBILITY
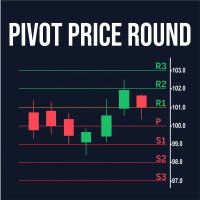
Pivot Round Price is an indicator based on the classic Pivot Points formulas (Classic Pivots), maintaining exactly the original calculations of support, resistance, and central pivot, without changing any part of the standard mathematics used. The difference and main advantage of this indicator is that the levels are automatically adjusted to rounded prices, making visualization easier on assets with multiple decimal places and making the levels much more relevant on the actual asset chart. With
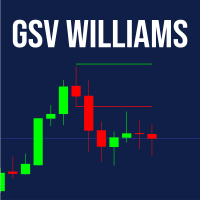
GSV – Guided Swing Value Levels The GSV – Guided Swing Value Levels is a unique indicator developed for traders who want to find price regions where the market tends to react with greater statistical accuracy.
Its calculation is inspired by concepts presented by Larry Williams in his book “Long-Term Secrets to Short-Term Trading” , which highlights the importance of the statistical average of market swings to forecast areas where price will likely stop, correct, or reverse. This indicator uses t
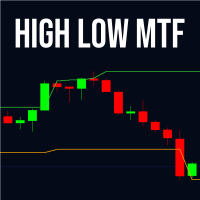
High Low MTF – Multi-Timeframe High & Low Levels High Low MTF is a professional indicator designed for traders who want to visualize powerful support and resistance zones based on highs and lows from any timeframe. It allows you to display maximum and minimum levels from smaller or higher periods directly on your current chart, providing a complete multi-timeframe market view. It works for day traders, scalpers, swing traders and even algorithmic systems using iCustom. The indicator automatical
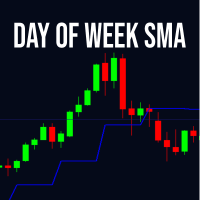
The Day Of Week SMA indicator calculates a moving average based on the closing prices of a specific day of the week chosen by the user. It supports various types of moving averages including Simple (SMA), Exponential (EMA), Smoothed (SMMA), and Linear Weighted (LWMA). The period defines how many instances of the selected day to include in the calculation. This tool is useful for analyzing weekly patterns in financial markets, helping traders identify trends specific to certain days. By focusing

Volume Color Histogram for MetaTrader 5.
This indicator displays volume as a histogram in a separate window. The bars are colored based on the direction of the price candle: green for bullish (close > open) and red for bearish (close < open). Key Features Volume source: Tick volume or real volume (user-selectable). Optional moving average line over the volume histogram, which can be enabled via input. Supported average types: SMA, EMA, SMMA, LWMA. Average period is configurable. Compatible with
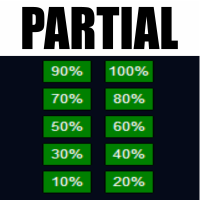
Partial Close Manager – Trade Volume Adjustment Tool This tool enables users to perform partial closes on open trades in MetaTrader 5. Functionality Partial Close: Close a portion of open trades with one action. Volume Calculation: Automatically calculates the volume to be closed, eliminating manual input. Multi-Order Support: Applies partial closes to all open orders on the same symbol simultaneously. Draggable Table: Click and hold the header to move the table anywhere on the chart.

Time & Sales Tick Indicator for MetaTrader 5 This indicator displays real-time trading tick information on MetaTrader 5 charts. It presents price, tick volume, and time. Functionality Displays tick data, including price, volume, and time, in a panel on the chart. Groups ticks into user-defined intervals, with color-coded price movements (green for upward, red for downward). Allows panel positioning in any chart corner.
MultiChart Pro – Chart Management Tool for MetaTrader 5 This Expert Advisor (EA) enables users to automate the opening and configuration of charts in MetaTrader 5. It supports the setup of up to four charts with specified timeframes and templates, including offline charts. Functionality Chart Opening: Opens up to three additional charts (e.g., D1, M1, M15) and one offline chart (e.g., 10 seconds), while configuring the current chart (e.g., M5). Template Application: Applies user-defined templat
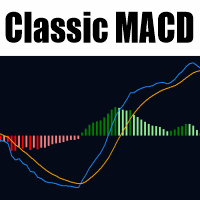
Classic MACD for MetaTrader 5 This indicator delivers a faithful implementation of the classic Moving Average Convergence Divergence (MACD) as originally designed by Gerald Appel, tailored specifically for MetaTrader 5. It empowers traders to identify market trends, momentum shifts, and potential reversal points through its core components: the MACD line, signal line, and histogram. The MACD line is calculated as the difference between two exponential moving averages (typically 12-period and 26

Fixed Scale Indicator for MetaTrader 5 Just click three times to enable or disable the centered price scale. The scale automatically adjusts according to market movement. Functionality Toggle Fixed Scale: Enable or disable the fixed scale by clicking three times on the price axis (right side of the chart). Price Centering: Maintains the price centered on the chart during market movements. Scale Adjustment: Automatically adjusts the chart scale based on price changes.

Keltner Channel Color is a custom indicator for MetaTrader 5 (MQL5) designed to enhance the visualization of trend and volatility on the chart. It colors bars or candles based on their relative position to the Keltner Channel, helping traders quickly identify bullish, bearish, and breakout zones. Ideal for trend following, scalping, or volatility analysis strategies, this indicator simplifies market reading by highlighting bars above or below the Keltner bands, as well as bars closing above prev

Volume Profile POC
POC stands for Point of Control : the price level where the highest volume was traded within the analyzed period — the region that most interested buyers and sellers, and which frequently acts as a price magnet, support or resistance. Real-Time Volume Profile, Adapted to Every Timeframe Volume Profile POC calculates and draws the volume profile directly on your chart, showing exactly at which price levels the market traded the most. Unlike generic indicators, it automatically