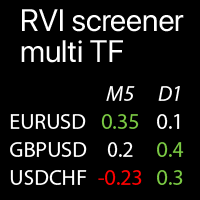
RVI Table MTF
- Indicators
-
Makarii Gubaydullin
 Multifunctional Trade Assistant:
MT5: https://www.mql5.com/en/market/product/71145 - Version: 1.0
- Activations: 10
Multi-timeframe RVI values on the selected Symbols: compare the current market trends
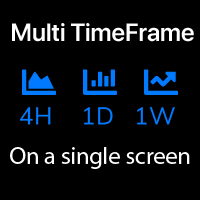
The indicator displays Relative Vigor Index values from all selected timeframes and Symbols in a single table, which allows you to quickly analyze current market price trends.
Each Symbol can be customized: removed or replaced. You can add up to 40 Symbols.
Panel can be moved to any place of the chart (drag anywhere).
In the input settings you can configure:
- RVI indicator settings: MA Period, Displayed data: "Signal" or "Value".
- Each timeframe may be enabled / disabled.
- Highlight option: if enabled - extreme levels will be highlighted in the custom colors.
- Extreme levels settings: High value, and Low value.
- Alerts: may be enabled for Extreme levels: high RVI / low RVI / both.
-
Visual styles: size, dark / white theme, highlight colors.
The RVI (Relative Vigor Index):
It's a momentum oscillator used in technical analysis that measures the conviction of a price trend by comparing a security's closing price to its trading range. The core premise is simple: "vigor" or momentum is typically stronger in an upward-trending market when the price closes higher than it opened, and weaker in a downward trend.
Unlike more common oscillators, the RVI is designed to lead price action, often providing signals before a reversal occurs. It's based on the observation that in a strong bullish trend, prices tend to close higher than they open. Conversely, in a bearish trend, prices tend to close lower than they open.
The RVI formula normalizes this relationship and smooths it with a simple moving average (SMA).
The calculation involves several steps:
-
Calculate the "Vigor" for each period:
Vigor = (Close - Open) / (High - Low). -
Smooth the values: The resulting values are then smoothed with a 4-period Simple Moving Average (SMA).
This creates what is often called the "RVI Line" or the main RVI value. -
Create a Signal Line: A second 4-period SMA is applied to the main RVI values, creating a "Signal Line" (similar to the MACD indicator).
The standard RVI setting is a 10-period lookback for the final calculation, but this can be adjusted.
The RVI Formula in a Nutshell: RVI Line = SMA( [ (Close - Open) / (High - Low) ], 4 ) for 10 period Signal Line = 4-period SMA of the RVI Line
How to Trade Using the RVI Indicator: Key Signals
Traders use the RVI in several ways, with the most common signals being crossovers, divergences, and centerline breaks.
1. RVI Crossovers (The Most Common Signal)
This is the primary trading method for the RVI.
-
Bullish Signal: When the RVI line crosses above its Signal Line, it indicates building bullish momentum.
This is often seen as a buy signal. -
Bearish Signal: When the RVI line crosses below its Signal Line, it indicates increasing bearish momentum.
This is often seen as a sell signal.
2. RVI Divergences (High-Probability Reversal Signals)
Divergences occur when the price action and the RVI indicator move in opposite directions. They can signal a potential trend reversal.
-
Bullish Divergence: The price makes a lower low, but the RVI makes a higher low.
This suggests that the downward momentum is weakening and a bullish reversal may be imminent. -
Bearish Divergence: The price makes a higher high, but the RVI makes a lower high.
This suggests that the upward momentum is fading and a bearish reversal may be coming.
3. Centerline Crossover
The RVI oscillates around a centerline (usually zero).
-
When the RVI is above zero, it suggests a bullish bias.
-
When the RVI is below zero, it suggests a bearish bias.
A crossover of the centerline can be used to confirm the overall trend direction.
RVI vs. RSI: What's the Difference?
Many traders confuse the RVI with the more popular Relative Strength Index (RSI). While both are momentum oscillators, they measure different things:
|
|---|
Limitations of the RVI Indicator
No indicator is perfect, and the RVI is no exception.
-
Whipsaws: In sideways or choppy markets, the RVI can produce many false crossover signals (whipsaws), leading to potential losses.
-
Lagging Nature: Like all indicators based on moving averages, it is inherently lagging. It confirms what has already happened rather than predicting the distant future.
-
Not a Standalone Tool: The RVI should never be used in isolation. It is most effective when combined with other forms of technical analysis, such as trend lines, support/resistance levels, and volume indicators.
For the best results, use the RVI to confirm signals from your primary trading strategy and other indicators. By understanding what the RVI indicator is and how to apply its signals—especially crossovers and divergences—you can make more informed decisions and better assess the true strength of a market trend.