Price Action Pro

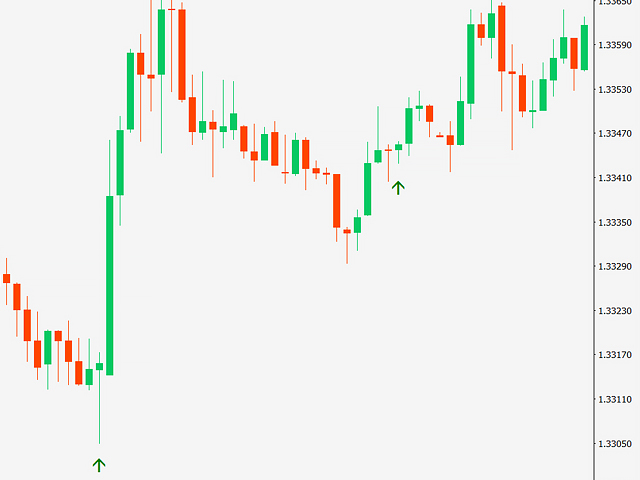
The indicator displays the most important Price Action Patterns that indicate a potential reversal / continuation of the trend.

Check out my #1 Pro Manager: 66+ features, including this indicator  |  Contact me if you have any questions

Avaliable Patterns:

  1. Pin bar;
  2. Engulfing;
  3. Inside bar (Harami);
  4. Morning star;
  5. Evening star;
  6. Dark Cloud Cover;
  7. Piercing Line;
Features:
  • You can select patterns to display and disable unnecessary patterns;
  • Notifications: alerts in the terminal, Email and Push-notifications (to the mobile device);
  • You can customize each pattern: by default, the indicator uses the recommended parameters. But you can set up the patterns for yourself;

Available filters:

  1. Trend filter (using the moving average);
  2. Higher TimeFrame filter: if enabled, the indicator will use the direction of the higher time frame candle (M5->M15, M30->M30);
  3. The filter of the previous candle: show patterns in accordance with the direction of the candle that closed before the signal.  
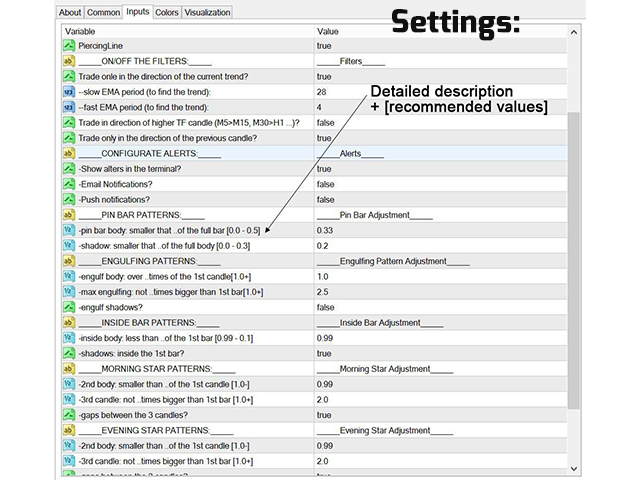
Inout Settings:

  • Pin Bar, Engulfing, Inside Bar, Morning / Evening Stars, Dark Cloud Cover / Piercing Line: only those patterns that are marked (true) will be displayed.
Filters:
  • UseTrendFilter: if (true) - filter the current trend: 1)Bearish patterns will be displayed if the value of the fast moving average with (Filter_FastMA) period is less than slow moving average with (Filter_SlowMA) period; 2)Bullish patterns will be displayed if the value of the fast moving average with (Filter_FastMA) period is more than slow moving average with (Filter_SlowMA) period. 
  • HigherTfFilter: if (true) - patterns will be displayed if the last closed candle on the higher time frame coincides with the direction of the signal candle.
  • PrevBarFilter: if (true) - patterns will be displayed if the previous closed candle matches the direction of the signal candle;
Notifications:
  • Show Alerts: if (true) - you will receive notifications in the trading terminal (Alerts);
  • Email Notifications: if (true) - you will receive notifications by Email (additional configuration via Tools>Options>Email is required);
  • Push Notifications: if (true) -  you will receive Push notifications on your mobile device (requires configuration via Tools>Options>Notifications);

Pin Bar Configuration:

  • Pin Bar Body: the ratio of the size of the candle's body (Open-Close) vs total size (High-Low): the body of the candle must be less than or equal than the total size multiplied by the specified value; [0.25 means that the body of the pattern must be less than or equal to 25% of the total length of the candle ((High-Low)*0.25)];
  • Shadows: the size ratio of the small shadow(   bottom shadow - for bearish patterns,   upper shadow - for bullish patterns) compared to the total size (High-Low): small shadow should be less than or equal to the total size multiplied by the specified value; [0.15 means that a small shadow must be less than or equal to 15% percent of the total length of the candle ((High-Low)*0.15)];
Engulfing Patterns Configuration:
  • Engulf Body Over: minimum candle engulfing percentage [1.1 means that the second candle must be greater than or equal to 110% of the first candle];
  • Max Engulfing: the maximum difference in the length of the second candle [2.0 means that the second candle should not be greater than the first candle*2.0];
  • Engulf Shadows: if (true): engulf shadows of the first candle;
Inside Bars:
  • Inside Body Less: the size of the inner candle must be smaller than the size of the first candle multiplied by the specified value [0.9 = 90%];
  • Shadow Inside: if (true) - candle shadows must be inside the first candle;
Morning Star / Evening Star Patterns:
  • 2nd body: the second candle must be less than or equal to the first candle multiplied by the specified number;
  • 3rd candle: the maximum difference in the length of the third candle compared to the first candle;
  • Gaps: if (true): required gaps between the second candle;

Dark Cloud Cover / Piercing Line Patterns:

  • 2nd candle: the second candle should close below/above the specified level [0.5 = close below the center of the first candle];

Visual Settings:

  • Bullish/Bearish Color: the color of the arrows that will be shown on the chart;
Recommended products
Price Magnet — Price Density and Attraction Levels Indicator Price Magnet is a professional analytical tool designed to identify key support and resistance levels based on statistical Price Density. The indicator analyzes a specified historical period and detects price levels where the market spent the most time. These zones act as “magnets,” attracting price action or forming a structural base for potential reversals. Unlike traditional Volume Profile tools, Price Magnet focuses on price-time d
Trend Ray
Andriy Sydoruk
The indicator shows the potential trend direction by cyclical-wave dependence. Thus, all the rays of the intersection will be optimal rays, in the direction of which the price is expected to move, taking into account the indicator period. Rays can be used as a direction for potential market movement. But we must not forget that the approach must be comprehensive, the indicator signals require additional information to enter the market.
Auto Fibo Pro m
DMITRII GRIDASOV
"Auto FIBO Pro"   Crypto_Forex  indicator  - is great auxiliary tool in trading! Indicator automatically calculate and place on chart Fibo levels and local trend lines (red color). Fibonacci levels indicate key areas where price can reverse. Most important levels are 23.6%, 38.2%, 50% and 61.8%. You can use it   for reversal scalping  or for zone grid trading. There are plenty of opportunities to  improve your current system using Auto FIBO Pro indicator as well. It has Info Spread Swap Displa
Noize Absorption Index MT4
Ekaterina Saltykova
5 (1)
Noize Absorption Index - is the manual trading system that measures the difference of pressure between bears forces and bulls forces. Green line - is a noize free index that showing curent situation. Zero value of index shows totally choppy/flat market.Values above zero level shows how powerfull bullish wave is and values below zero measures bearish forces.Up arrow appears on bearish market when it's ready to reverse, dn arrow appears on weak bullish market, as a result of reverse expectation. S
VR Cub
Vladimir Pastushak
VR Cub is an indicator for getting high-quality entry points. The indicator was developed to facilitate mathematical calculations and simplify the search for entry points into a position. The trading strategy for which the indicator was written has been proving its effectiveness for many years. The simplicity of the trading strategy is its great advantage, which allows even novice traders to successfully trade with it. VR Cub calculates position opening points and Take Profit and Stop Loss targe
TWO PAIRS SQUARE HEDGE METER INDICATOR Try this brilliant 2 pairs square indicator It draws a square wave of the relation between your two inputs symbols when square wave indicates -1 then it is very great opportunity to SELL pair1 and BUY Pair2 when square wave indicates +1 then it is very great opportunity to BUY pair1 and SELL Pair2 the inputs are : 2 pairs of symbols         then index value : i use 20 for M30 charts ( you can try other values : 40/50 for M15 , : 30 for M30 , : 10 for H1 ,
Super Reversal Pattern
Parfait Mujinga Ndalika
Super Reversal Pattern Indicator Unlock the power of advanced pattern recognition with our Super Reversal Pattern Indicator. Designed for traders seeking precision and reliability, this indicator identifies one of the most effective reversal patterns in technical analysis, offering a significant edge in your trading strategy. Key Features: Non-Repainting Accuracy: Enjoy the confidence of non-repainting technology. Once a Super Reversal Pattern is detected, it remains static, providing consiste
PZ Harmonacci Patterns
PZ TRADING SLU
3.17 (6)
Trade smarter, not harder: Empower your trading with Harmonacci Patterns This is arguably the most complete harmonic price formation auto-recognition indicator you can find for the MetaTrader Platform. It detects 19 different patterns, takes fibonacci projections as seriously as you do, displays the Potential Reversal Zone (PRZ) and finds suitable stop-loss and take-profit levels. [ Installation Guide | Update Guide | Troubleshooting | FAQ | All Products  ] It detects 19 different harmonic pric
The indicator detects and displays 3 Drives harmonic pattern (see the screenshot). The pattern is plotted by the extreme values of the ZigZag indicator (included in the resources, no need to install). After detecting the pattern, the indicator notifies of that by a pop-up window, a mobile notification and an email. The indicator highlights the process of the pattern formation and not just the complete pattern. In the former case, it is displayed in the contour triangles. After the pattern is com
Alpha Trend sign has been a very popular trading tool in our company for a long time. It can verify our trading system and clearly indicate trading signals, and the signals will not drift. Main functions: Based on the market display of active areas, indicators can be used to intuitively determine whether the current market trend belongs to a trend market or a volatile market. And enter the market according to the indicator arrows, with green arrows indicating buy and red arrows indicating se
Daily Candle Predictor is an indicator that predicts the closing price of a candle. The indicator is primarily intended for use on D1 charts. This indicator is suitable for both traditional forex trading and binary options trading. The indicator can be used as a standalone trading system, or it can act as an addition to your existing trading system. This indicator analyzes the current candle, calculating certain strength factors inside the body of the candle itself, as well as the parameters of
Quantum Falcon Signal Free is a smart visual trading indicator for MetaTrader 4 designed for Forex and Gold traders. The indicator combines: • Trend analysis • RSI momentum confirmation • MACD momentum filtering • ATR volatility filtering • Higher timeframe confirmation • Smart exit signal detection Main Features: • Smart Buy and Sell signals • Exit Buy / Exit Sell alerts • Real-time dashboard on chart • Professional candle arrows • Multi-timeframe trend confirmation • ATR market volatility filt
FREE
The SMC Venom Model BPR indicator is a professional tool for traders working within the Smart Money (SMC) concept. It automatically identifies two key patterns on the price chart: FVG (Fair Value Gap) is a combination of three candles, in which there is a gap between the first and third candles. It forms a zone between levels where there is no volume support, which often leads to a price correction. BPR (Balanced Price Range) is a combination of two FVG patterns that form a “bridge” - a zone of
The indicator displays the data of the Stochastic oscillator from a higher timeframe on the chart. The main and signal lines are displayed in a separate window. The stepped response is not smoothed. The indicator is useful for practicing "manual" forex trading strategies, which use the data from several screens with different timeframes of a single symbol. The indicator uses the settings that are identical to the standard ones, and a drop-down list for selecting the timeframe. Indicator Paramet
We present you the indicator "Candle closing counter", which will become your indispensable assistant in the world of trading. That’s why knowing when the candle will close can help: If you like to trade using candle patterns, you will know when the candle will be closed. This indicator will allow you to check if a known pattern has formed and if there is a possibility of trading. The indicator will help you to prepare for market opening and market closure. You can set a timer to create a pre
The indicator detects and displays Shark harmonic pattern (see the screenshot). The pattern is plotted by the extreme values of the ZigZag indicator (included in the resources, no need to install). After detecting the pattern, the indicator notifies of that by a pop-up window, a mobile notification and an email. The indicator highlights the process of the pattern formation and not just the complete pattern. In the former case, it is displayed in the contour triangles. After the pattern is comple
PZ Support Resistance
PZ TRADING SLU
3.33 (3)
Unlock key market insights with automated support and resistance lines Tired of plotting support and resistance lines? This is a multi-timeframe indicator that detects and plots supports and resistance lines in the chart with the same precision as a human eye would. As price levels are tested over time and its importance increases, the lines become thicker and darker, making price leves easy to glance and evaluate. [ Installation Guide | Update Guide | Troubleshooting | FAQ | All Products ] Boos
Trend PA
Mikhail Nazarenko
5 (3)
The Trend PA indicator uses   Price Action   and its own filtering algorithm to determine the trend. This approach helps to accurately determine entry points and the current trend on any timeframe. The indicator uses its own algorithm for analyzing price changes and Price Action. Which gives you the advantage of recognizing, without delay, a new nascent trend with fewer false positives. Trend filtering conditions can be selected in the settings individually for your trading style. The indicator
Phase Analytics Pro: Advanced Cyclic Market Analyzer Phase Analytics Pro is a sophisticated technical tool designed for traders who prioritize mathematical precision over lag-heavy traditional indicators. Based on the principles of digital signal processing, this indicator decomposes price action into phase and quadrature components to identify the dominant market cycle. How it works: The algorithm calculates the instantaneous phase of the market, allowing it to distinguish between trending and
Trendiness Index
Libertas LLC
5 (3)
"The trend is your friend" is one of the best known sayings in investing, because capturing large trendy price movements can be extremely profitable. However, trading with the trend is often easier said than done, because many indicators are based on price reversals not trends. These aren't very effective at identifying trendy periods, or predicting whether trends will continue. We developed the Trendiness Index to help address this problem by indicating the strength and direction of price trend
Risk Management and Limit Monitoring Indicator for Professional Traders and Evaluation Accounts (Prop) This tool only displays precise risk management and limit information on the chart to help you make more focused decisions. The indicator does not open/close/modify trades and does not interfere with Expert Advisors (EAs). Features Monitoring daily and total drawdown Calculates and displays daily and total drawdown based on Balance or Equity (configurable). Shows the remaining percentage to th
This is a new strategy for SUPPLY DEMAND areas It is based on a calculation using the tick volume to detect the big price action in market for both bear /bull actions this smart volume action candles are used to determine the supply and demand areas prices in between main supply and demand lines indicate sideway market  up arrows will be shown when prices moves above the main supply and the secondary supply lines Down arrows will be shown when prices moves below the main demand and the secondary
Trade with Gann on your side!! MASTER CIRCLE 360 CIRCLE CHART, originally created by Gann admitted that this is “The Mother of all charts”. It is one of the last studies that this great trader left for us. The numeric tab le is apparently quite simple like all the tables and is based on square numbers, the SQUARE OF 12 and is by evolution, one of the most important square numbers. Here we can find CYCLE, PRICE AND TIME thanks to angles and grades, to show past and future support and resistance.
Happy Scalping Indicator
Leandro Bernardez Camero
This indicator was designed for aggressive scalping and quick entries in binary options , generating signals on every candle , so you can know exactly what is happening at all times. Join the Happy Scalping channel: MQL5 It does not repaint : the current candle's signal is generated in REAL TIME , which means it may change while the candle is still forming, depending on whether the price rises or falls compared to the previous candle's close. But once the candle closes , the signal color becom
Double HMA lines MTF
Pavel Zamoshnikov
5 (1)
This is a multi-timeframe version of the popular Hull Moving Average (HMA). The Double HMA MTF Light indicator combines two timeframes on a single chart. The HMA of the higher timeframe defines the trend, and the HMA of the current timeframe defines short-term price movements. The indicator is freely distributed and hasn't audio signals or messages. Its main function is the visualization of price movements. If you need advanced functionality of the HMA multi-timeframe indicator (information ab
FREE
Magic Balance
Daniil Evstratenko
The indicator shows which trading pairs, strategies, robots and signals that you use are profitable and which are not. The statistic of trades and balance graph are displayed in the account currency and pips - to switch simply click on the graph. button "$"(top left) - minimize/expand and move the indicator panel button ">"(bottom right) - stretching and resetting to the original size Statistic of trades 1 line - account balance, current profit and lot of open trades; 2 line - the number of all
Crypto_Forex Indicator  " Morning  Star  pattern" for MT4. Indicator "Morning Star pattern" is a very powerful indicator for Price Action trading:   No repaint, No delay. Indicator   detects bullish Morning Star patterns on chart:  Blue arrow signal on chart (see pictures). With P C, Mobile & Email alerts. Also its brother - bearish  " Evening Star pattern" indicator is available (follow the link below). Indicator  " Morning Star pattern" is excellent to   combine with Support/Resistance Levels
Rainbow Price Visualizer v1.21 See where the market really breathes. Turns your MT4 chart into an ultra-precise heatmap that highlights price zones favored by big players. Why it matters 300 price levels at 0.2‑pip resolution — microscopic detail. 8 visual themes (Rainbow, Fire, Ocean…) for instant readibility. Smart opacity: low noise fades, real zones pop. Lightweight rendering with automatic cleanup. Fully customizable: saturation, opacity, resolution, history depth. Bands project into the f
This is an MTF indicator of support and resistance levels based on Advanced ZigZag Dynamic and/or Extended Fractals indicator extremums with price labels (can be disabled). More higher TFs can be selected for MTF mode. By default, the levels are generated based on ZigZag indicator dots. Fractals indicator dots can also be used together with ZigZag or instead of it. In order to simplify the use and save CPU time, calculation is performed once per each bar at its opening. Parameters: ForcedTF - ch
An indicator of pattern #31 ("Long Island") from Encyclopedia of Chart Patterns by Thomas N. Bulkowski. The second gap is in the opposite direction. Parameters: Alerts - show alert when an arrow appears   Push - send a push notification when an arrow appears (requires configuration in the terminal) GapSize - minimum gap size in points ArrowType - a symbol from 1 to 17 ArrowVShift - vertical shift of arrows in points   ShowLevels - show levels ColUp - color of an upward line ColDn - color of a
Buyers of this product also purchase
Genesis Matrix Pro is a professional multi-timeframe trend detection indicator designed to help traders identify high-quality market alignment with clarity and structure. It combines 12 different technical indicators into one visual alignment matrix, allowing traders to quickly see when market conditions are bullish, bearish, or neutral. A signal is generated only when the selected strategies are aligned, helping reduce noise and improve decision-making. PLEASE CONTACT ME AFTER PURCHASE TO GET
Gann Made Easy
Oleg Rodin
4.83 (163)
Gann Made Easy is a professional and easy to use Forex trading system which is based on the best principles of trading using the theory of W.D. Gann. The indicator provides accurate BUY and SELL signals including Stop Loss and Take Profit levels. You can trade even on the go using PUSH notifications. PLEASE CONTACT ME AFTER PURCHASE TO GET TRADING  INSTRUCTIONS AND GREAT EXTRA INDICATORS   FOR FREE! Probably you already heard about the Gann trading methods before. Usually the Gann theory is a ve
The Propfolio Master Suite is the ultimate all-in-one analytical workstation for professional traders. Combining the power of the Beat The Market Maker (BTMM) methodology, Smart Money Concepts (SND/Liquidity), and Advanced Volume Profile, this suite replaces multiple different indicators with one optimized engine. Monitor up to 14 pairs simultaneously from a single chart, instantly identify market cycles, and seamlessly map institutional footprints with the click of a button. The Command Center
Scalper Inside PRO
Alexey Minkov
4.74 (69)
Scalper Inside PRO Scalper Inside PRO is an intraday trend and scalping indicator for MetaTrader 4 that uses an exclusive algorithm to quickly detect market direction and key target levels. It automatically calculates entry, exit and multiple profit targets, and shows detailed performance statistics so you can see how different instruments and strategies performed. This helps you choose the most suitable trading instruments for the current market conditions. Additionally, you can easily integrat
M1 Sniper
Oleg Rodin
5 (23)
M1 SNIPER is an easy to use trading indicator system. It is an arrow indicator which is designed for M1 time frame. The indicator can be used as a standalone system for scalping on M1 time frame and it can be used as a part of your existing trading system. Though this trading system was designed specifically for trading on M1, it still can be used with other time frames too. Originally I designed this method for trading XAUUSD and BTCUSD. But I find this method helpful in trading other markets a
PRO Renko System
Oleg Rodin
5 (30)
PRO Renko System is a highly accurate trading system specially designed for trading RENKO charts. The ARROWS and Trend Indicators DO NOT REPAINT! The system effectively neutralizes so called market noise giving you access to accurate reversal signals. The indicator is very easy to use and has only one parameter responsible for signal generation. You can easily adapt the tool to any trading instrument of your choice and the size of the renko bar. I am always ready to provide extra support to help
Auto Optimized Parabolic RSI: Advanced 3D Momentum Engine Most retail indicators fail because they rely on static inputs that break the moment market volatility shifts. Auto Optimized Parabolic RSI solves the problem of "indicator decay" by continuously recalculating its own mathematical edge, bringing institutional-grade quantitative adaptation directly to your MT5 terminal. The Core Advantage: Custom In-Memory 3D Optimization   Standard auto-optimizers often freeze the MT5 platform because the
NAM Order Blocks
NAM TECH GROUP, CORP.
3.67 (3)
MT4 Multi-timeframe Order Blocks detection indicator. Features - Fully customizable on chart control panel, provides complete interaction. - Hide and show control panel wherever you want. - Detect OBs on multiple timeframes. - Select OBs quantity to display. - Different OBs user interface. - Different filters on OBs. - OB proximity alert. - ADR High and Low lines. - Notification service (Screen alerts | Push notifications). Summary Order block is a market behavior that indicates order collection
First of all Its worth emphasizing here that this Trading Tool is Non-Repainting Non-Redrawing and Non-Lagging Indicator Which makes it ideal for professional trading . [Online course] ,   and   [manual] The Smart Price Action Concepts Indicator is a very powerful tool for both new and experienced traders . It packs more than 20 useful indicators into one combining advanced trading ideas like Inner Circle Trader Analysis and Smart Money Concepts Trading Strategies . This indicator focuses on Sm
Quants HL Break
Ferhat Mutlu
5 (2)
Advanced calculation made by pure price action to find LH and HL breakouts. It will give you a great reversal points in the market. LH and HL signals can used for the traingle breakouts as well. Once breakout happens its indicate strong reversal. Nice filter for Moving Averages. I highly suggest to use that with trend indicators. Can be used as an extra confirmation for support and resistance , supply demand indicators. The indicator is not repainting. Buffers :   SetIndexBuffer ( 0 ,UpBar);
Dynamic Forex28 Navigator
Bernhard Schweigert
4.43 (7)
Specials Discount now. The Next Generation Forex Trading Tool. Dynamic Forex28 Navigator is the evolution of our long-time, popular indicators, combining the power of three into one: Advanced Currency Strength28 Indicator (695 reviews) + Advanced Currency IMPULSE with ALERT (520 reviews) + CS28 Combo Signals (recent Bonus) Details about the indicator  https://www.mql5.com/en/blogs/post/758844 What Does The Next-Generation Strength Indicator Offer? Everything you loved about the originals, now
RFI levels PRO
Roman Podpora
5 (1)
The indicator accurately shows the reversal points and price return zones where the   Major players . You see where new trends are forming and make decisions with maximum precision, maintaining control over every trade. VERSION MT5     -     Reveals its maximum potential when combined with the   TREND LINES PRO   indicator What the indicator shows: Reversal structures and reversal levels with activation at the beginning of a new trend. Display of   TAKE PROFIT   and   STOP LOSS   levels with mi
Trend Catcher ind
Ramil Minniakhmetov
TREND CATCHER INDICATOR Trend Catcher Indicator analyzes market price movements, using a combination of the author’s proprietary and customized adaptive trend-analysis indicators.  It identifies the true market direction by filtering out short-term noise and focusing on underlying momentum strength, volatility expansion, and price structure behavior.  It also uses a combination of smoothing and trend-filtering customized indicators such as moving averages, RSI, and volatility filters.   Real ope
Apollo SR Master is a Support/Resistance indicator with special features which make trading with Support/Resistance zones easier and more reliable. The indicator calculates Support/Resistance zones in real-time without any time lag by detecting local price tops and bottoms. Then to confirm the newly formed SR area, the indicator shows special signal which signalizes that the SR zone can be taken into consideration and used as an actual SELL or BUY signal. In this case the strength of the SR zone
Grabber System
Ihor Otkydach
5 (2)
Let me introduce you to an excellent technical indicator – Grabber, which works as a ready-to-use "All-Inclusive" trading strategy. Within a single code, it integrates powerful tools for technical market analysis, trading signals (arrows), alert functions, and push notifications. Every buyer of this indicator also receives the following for free: Grabber Utility for automatic management of open orders Step-by-step video guide: how to install, configure, and trade with the indicator Custom set fi
Advanced Supply Demand
Bernhard Schweigert
4.91 (300)
Trading Special – 40% OFF Best Solution for any Newbie or Expert Trader! This indicator is a unique, high quality and affordable trading tool because we have incorporated a number of proprietary features and a new formula. With this update, you will be able to show double timeframe zones. You will not only be able to show a higher TF but to show both, the chart TF, PLUS the higher TF: SHOWING NESTED ZONES. All Supply Demand traders will love it. :) Important Information Revealed Maximize the pot
GoldRush Trend Arrow Signal V1.6 The GoldRush Trend Arrow Signal indicator V1.6 continues to provide precise, real-time trend analysis tailored for high-speed, short-term scalpers in XAU/USD , but it now has additional features and improved efficiency and reliability. Built specifically for the 1-minute time frame, this tool displays directional arrows for clear entry points, allowing scalpers to navigate volatile market conditions with confidence. The indicator consists of PRIMARY and SECONDARY
Introduction to Fractal Pattern Scanner Fractal Indicator refers to the technical indicator that makes use of the fractal geometry found in the financial market. Fractal Pattern Scanner is the advanced Fractal Indicator that brings the latest trading technology after the extensive research and development work in the fractal geometry in the financial market. The most important feature in Fractal Pattern Scanner is the ability to measure the turning point probability as well as the trend probabi
Trading Special –40% OFF Best Solution for any Newbie or Expert Trader! This Indicator is a unique, high quality and affordable trading tool because we have incorporated a number of proprietary features and a new formula. With only ONE chart you can read Currency Strength for 28 Forex pairs! Imagine how your trading will improve because you are able to pinpoint the exact trigger point of a new trend or scalping opportunity? User manual: click here That's the first one, the original! Don't buy a
Cycle Sniper
Elmira Memish
4.39 (36)
Please contact us after your purchase and we will send you the complimentary indicators to complete the system Cycle Sniper is not a holy grail but when you use it in a system which is explained in the videos, you will feel the difference. If you are not willing to focus on the charts designed with Cycle Sniper and other free tools we provide, we recommend not buying this indicator. We recommend watching the videos about the indiactor and system before purchasing. Videos, settings  and descri
Market Structure Patterns MT4
Samuel Manoel De Souza
5 (18)
Market Structure Patterns   is an indicator based on   smart money concepts   that displays   SMC/ICT   elements that can take your trading decisions to the next level. Take advantage of the   alerts ,   push notifications   and   email messages   to keep informed from when an element is formed on the chart, the price crosses a level and/or enters in a box/zone. Developers can access the values of the elements of the indicator using the   global variables  what allows the automation of trading d
Advanced UT BOT ALERTS for MT4 Professional Multi-Filter Trend Detection System | Enhanced UT BOT Engine We only provide high-quality indicators.  Advanced UT BOT is built for professional use, featuring a stable signal logic and secure calculation process that prevents any delays or false updates. It does not repaint, redraw, remove, or modify past signals in any way. All BUY and SELL signals are generated only after the candle has closed , ensuring consistent accuracy and reliability. There is
Contact me after purchase to get Bonus EA based on this indicator. The Self Optimizing Double MA Strategy is a professional-grade trading tool designed to eliminate parameter guesswork. Powered by a built-in auto-optimization engine, it continuously adapts to shifting market conditions by simulating thousands of parameter combinations in the background to maintain a statistical edge. Instead of relying on static, outdated settings, the indicator dynamically updates its own logic to find the mos
Day Trader Master is a complete trading system for traders who prefer intraday trading. The system consists of two indicators. The main indicator is the one which is represented by arrows of two colors for BUY and SELL signals. This is the indicator which you actually pay for. I provide the second indicator to my clients absolutely for free. This second indicator is actually a good trend filter indicator which works with any time frame. THE INDICATORS DO NOT REPAINT AND DO NOT LAG! The system is
Candle Power Pro
Thushara Dissanayake
4.5 (8)
The   Candle Power Pro   is a sophisticated trading tool designed to decode   real volume pressure, tick data imbalances, and institutional order flow dynamics   by measuring the   battle between bull ticks and bear ticks   in real time. This indicator transforms raw   volume data into actionable insights , helping traders identify   Smart Money movements, liquidity hunts, and hidden market psychology   behind each price candle. By analyzing   buyer/seller volume percentages, divergence pattern
If you trade Forex, having detailed information about the currency strength and currency pairs correlation can take your trading to new heights. The correlation will help to cut your risk in half, and strength analysis will help to maximize the profits. This indicator provides a hybrid approach for selecting the most appropriate currency pairs using the strength analysis and currency pairs correlation. How to use the Currency Strength Analysis Suppose your trading strategy provides a buying opp
CRT Candle Range Theory HTF MT4.   Ultimate CRT Indicator: Advanced ICT Concepts and Malaysian SnR Trading System Discounted   Price   $50  !!     Secure your lifetime access   now   before it switches to   subscription-only ! Master the Market Maker's Footprints with the Most Advanced Candle Range Theory Indicator Unlock the true power of   Smart Money Concepts (SMC)   and trade precisely like the institutions with the   Ultimate CRT Indicator . Built exclusively for serious traders, this indic
Route Lines Prices is an indicator designed for finding price directions. Its simple interface contains multiple algorithms for price behavior and future direction calculations. These algorithms include volatility calculations and price smoothing based on the timeframes used. The indicator has a single parameter for changing the " Calculating Price Values " value. The default value of 1 provides a balanced automatic calculation, which can be used without manually configuring the indicator. By m
KURAMA GOLD SIGNAL PRO (MT4) — Complete XAUUSD Trading System with 7-Layer Filter, Auto TP/SL, and Quality Scoring NON-REPAINTING. NON-REDRAWING. NON-LAGGING. Every signal is permanent. What you see is what you get. BONUS: Buy the lifetime license and receive AI Zone Radar ($59 value) + full PDF manual FREE. Message me after purchase. AI Zone Radar: https://www.mql5.com/en/market/product/175834 TRUSTED BY TRADERS: Already used by an active community of Gold traders. Praised for accuracy and
Master head and shoulders patterns for better trading decisions A head and shoulders pattern is a chart formation that resembles a baseline with three peaks, the outside two are close in height and the middle is highest. It predicts a bullish-to-bearish trend reversal and is believed to be one of the most reliable trend reversal patterns. It is one of several top patterns that signal, with varying degrees of accuracy, that a trend is nearing its end. [ Installation Guide | Update Guide | Trouble
More from author
Trade Assistant 38 in 1
Makarii Gubaydullin
4.91 (23)
Multifunctional tool: Lot Calculator, Grid Orders, R/R ratio, Trade Manager, Supply and Demand zones, Price Action and much more Demo version   |   User manual Trade Assistant   doesn't work in the strategy tester : you can download the   Demo Version HERE  to test the utility . Contact me   for any questions  / ideas for improvement / in case of a bug found If you need a MT4 version, it is available here Simplify, speed up and automate your trading   process . Expand the standard terminal capa
Automatically plots Fibo levels, based on the High & Low prices from the specified time frame Multiple bars may be united: e.g. you can get a Fibo based on the 10-days Highs and Lows My   #1 Utility : 65+ features, including this indicator  |   Contact me  for any questions  |  MT5 version Helps to see potential reversal levels; Patterns formed at the Fibo levels tend to be stronger; Significantly reduces the time spent on manual  plotting ; Settings: Timeframe to calculate the base High & Low p
Breakeven Pro
Makarii Gubaydullin
Breakeven levels: manual and automatic Using this utility , you can quickly move trades to breakeven in just 1 click : especially important in short -term trading. You can also set the automatic  SL  movement when the trade reaches a desired  profit.  Offset option is also available. Multifunctional utility : 66+ features, including extended operations with a BE levels  |   Contact me  if you have any questions  |   MT4 version This tool consists of 2 subsections: 1. [Move SL to BE now]: manual
Trade Assistant Pro 36 in 1
Makarii Gubaydullin
4.76 (21)
Multifunctional tool: Lot Calculator, Grid Orders, R/R ratio, Trade Manager, Supply and Demand zones, Price Action and much more Demo version   |   User manual Trade Assistant   doesn't work in the strategy tester: you can download the Demo Version HERE  to test the utility . Contact me for any questions  / ideas for improvement / in case of a bug found If you need a MT5 version, it is available   here Simplify, speed up and automate your trading process . Expand the standard terminal capabilit
Lot Size Calc
Makarii Gubaydullin
Quickly find the lot size  directly in the terminal , to comply with risk management. Check out my  #1 Trade Manager : 66+ features, including PRO risk management  |   Contact me  if you have any questions it works on any trading instruments: Forex, Stocks, Futures, Indices, CFD, Bonds, Cryptocurrencies; interface minimization function; flexibility of use; money management; It is especially useful for short-term traders, when they need to act  quickly . For calculation it is necessary to specify
Countdown Bar Timer
Makarii Gubaydullin
Countdown timer till the bar closure, + % Progress status:  #1 multifunctional utility :   66+ features, including this tool  |   Contact me  if you have any questions   |    MT5 version In the settings of the indicator, you can configure: Timeframe for Calulculation; true / false: Higher TimeFrame option (next from the currently used: M15->M30, H4->D1...) Position: 1 = Bottom Left corner; 2 = Bottom Right corner; 3 = Top Left corner; 4 = Top Right corner; Font Size; Color; Font Style;
FREE
Timer Countdown
Makarii Gubaydullin
5 (3)
Countdown timer till the bar closure, + % Progress status:  #1 multifunctional utility :   66+ features, including this tool  |   Contact me  if you have any questions   |    MT4 version In the settings of the indicator, you can configure: Timeframe for Calulculation; true / false:   Higher TimeFrame option (next from the currently used: M15->M30, H4->D1...) Position: 1 = Bottom Left corner; 2 = Bottom Right corner; 3 = Top Left corner; 4 = Top Right corner; Font Size; Color; Font Style;
FREE
Swap and Spread
Makarii Gubaydullin
Displays the current market information with a per-second update. Spread size; Swap size: for short and long positions; Local time (optionally); Multifunctinal utility : 66+ features, including this tool  |   Contact me  if you have any questions   |    MT4 version In the settings of the indicator, you can configure: Font size; Text color; Select the positioning: left / right corner of the chart; Local time: on/off; The program file should be placed to the " Indicators " directory.
FREE
Spread and Swap
Makarii Gubaydullin
5 (1)
Displays the current market information with a per-second update. Spread size; Swap size: for short and long positions; Optionally, you can enable the display of the current time; Multifunctional utility : 66+ features, including this tool  |   Contact me  if you have any questions   |  MT5 version In the settings of the indicator, you can configure: Font size; Text color; Select the positioning: left / right corner of the chart; Turn on / off the display of the current time (local time onyour
FREE
The indicator displays the levels that are extremes for the specified time frames. Resistance level is the maximum price of the last closed bar; Support level is the minimum price of the last closed bar; Check out my  #1 Trade Assistant : 66+ fueatures, including this indicator  |   Contact me  if you have any questions 2 operating modes: Real bodies:  Open and Close prices will be used; Extremes:  High and Low prices will be used; This indicator: Helps to see potential reversal levels; Patter
The indicator shows the operating time of the world exchanges. Help you to see which markets are currently most active Check out my  #1 Pro  Utility : 66+ features, including this tool  |   Contact me  if you have any questions Helps to select the most volatile instruments at the moment; Especially useful for an intraday traders; 1) When using on time frames 1H and below: the lines will correspond to the actual location of the bars on the chart, and when moving the chart, the lines of the tradi
Lines of risk
Makarii Gubaydullin
The indicator displays the   specified Risk Level   on the chart, for long and short positions. Check out my  #1 Trade Manager : 66+ features, including this tool  |   Contact me  if you have any questions It may be useful when setting the Stop Loss level, the value of which is visible on the right price axis. To calculate the level of risk, a   Fixed  / or   Last used   lot size is used. Imput Settings: Last traded lot:  set " true " to make the calculation for your last used   trading lot; Lo
Candle Size
Makarii Gubaydullin
Finds the bars that exceed the specified size Check out my  #1 Trade Assistant : 66+ features, including this indicator  |   Contact me  if you have any questions 2 operating modes: Real body:  the difference between the   open and close   prices will be used; Extremes:  the difference between the   maximum and minimum   prices will be used; This Indicator: Convenient for   filter patterns   in a period of low volatility; Indicates the   beginning of a trend ; Helps to see the most   significa
Shows the direction of the bars on all major timeframes. Multifunctional utility : 65+ features, including this indicator      |     Version for MT5 The meaning of the visual signals ( squares): Red : Close price is  lower  than the Open price: Close < Open;  Green : Close price is  higher  than the Open price: Close > Open; Blue : Close price is  equal  to the Open price: Close = Open; You can set the Shift of the calculated bar, relative to the current bar: Shift = 0: the direction of the c
Informer for calculating the results of open trades Check out my  #1 Trade Manager : 66+ features, including this tool  |   Contact me  if you have any questions The information panel groups open orders into 2 categories: Buys Sells For each category, the symbol and the current number of pips are displayed. The total result for all open trades is shown below. Notifications can be enabled or disabled by simply clicking on the button: When the notification is enabled, you will know when the profi
Indicators 14 in 1
Makarii Gubaydullin
5 (1)
14 Indicators and auxiliary tools for convenient trading This utility contains 14 additional tools that can be useful for certain actions of the trader,   thereby simplifying and speeding up the trading process. Check out my  #1 Trade Manager : includes 66+ features and indicators  |   Contact me  if you have any questions Due to the different monitor resolutions, some users may encounter the fact that the labels will be displayed with an overlay or be too small. If you encounter such a problem,
Daily Pips Target
Makarii Gubaydullin
Informer for tracking your daily trading results Check out my  #1 Trade Assistant : 66+ features, including this tool  |   Contact me  if you have any questions In the upper part of the panel, you set the daily profit target (in pips): Manually entering a value; Using the + and - buttons (the change step can be configured in the settings); The dashboard then groups trades into 2 categories: Current floating result; Summing up closed trades; The final result is displayed at the bottom: achieveme
Gap indicator
Makarii Gubaydullin
Displays the appearance of a gap on the chart (when the closing price of the previous bar differs from the opening price of the new bar). #1 multifunctional utility:  66+ features, including this indicator  |   Contact me  if you have any questions  |   MT5 version In the initial settings you can configure: The size of the gap (in points): only gaps that exceed this value will be displayed. Arrow color : separate for up and down gaps. When you hover the mouse over the gap arrows on the chart, t
Market information
Makarii Gubaydullin
Market information and detailed statistics: analysis of volatility and price bars. Check out my  # 1 Trade Assistant : 66+ features, including this tool  |   Contact me  if you have any questions Specify any currency pair/trading instrument to get information: Market information: Current spread; Swap for long positions (buys); Swap for short positions (sells); Select a time frame and number of periods to analyze price changes: Average volatility; Maximum volatility; Minimum volatility; Maximum
Market watch list
Makarii Gubaydullin
Monitor your favorite Symbols Multifunctional utility:  66+ features, including this tool  |   Contact me  if you have any questions   |   MT5 version This tool opens in a separate window: it can be moved (drag anywhere), and minimized [v]. You can adjust the Watchlist on the panel: Click [edit list] to add / remove the Symbols from the Watchlist. Calculated value: it may either be the last [closed bar], or the current [floating bar]. Select the [timeframe] for calculation. There are 2 types of
Multi Timeframe
Makarii Gubaydullin
The indicator helps you to analyze 3 different Time Intervals on a single screen: so that you can see the overall price action. Check out my  #1 Trade Manager : 66+ features, including this tool  |   Contact me  if you have any questions In the initial settings you can configure: TimeFrame 1; TimeFrame 2; TimeFrame 3; The number of bars to be shown; Colors of bullish and bearish bars; Product file should be located in the 'Indicators' directoty.
Trade statistics
Makarii Gubaydullin
Detailed statistics of your trading for the selected time period Check out my  #1 Trade Manager : 66+ features, including extended statistics  |   Contact me  if you have any questions Statistics display modes: For the  selected   currency pair/trading instrument Statistics for  all trades   (" ALL ") You can select the period for which you want to get statistics: 1 day 1 week 1 month 2   months 3   months 6   months 1 year 2 years All trading history Displayed information:  Gross profit Gross l
Alert Levels PRO
Makarii Gubaydullin
Utility for setting notifications when a given price level is reached Check out my  #1 Trade Manager : 66+ features, including Alerts and Trend Line alerts  |   Contact me  if you have any questions The alert can be set in three ways: Manual entry of the price level; Setting the price change: in percent / in pips / in market points; By moving the level with the mouse: there is also a magnet function, when activated, the level will snap to the nearest OHLC values; Optionally, you can enable / di
Manage trades
Makarii Gubaydullin
Management of active and pending orders: automatic breakeven, TP/SL changes, partial / full closing, visual display of levels on the chart Check out my #1  Utility : 66+ features, including PRO trade management   |    Contact me  if you have any questions 1) Main window: to manage orders, you can set a specific symbol [Symbol], or select all symbols [ALL] Close all active positions [ALL] Close all profitable trades [profits] Close all loosing trades [losses] Close all long trades (for buy) [long
Detailed statistics of your trading for the selected period Check out my  #1 Trade Assistant : 66+ features, including this tool  |   Contact me  if you have any questions The utility includes 2 separate tools: Trade Statistics WeekDays Analyzer Statistics display modes: For the selected  currency pair/trading instrument Statistics for all trades   (" ALL ") You can select the period for which you want to get statistics: 1 day 1 week 1 month 2   months 3   months 6   months 1 year 2 years All tr
Future bar
Makarii Gubaydullin
The indicator shows the currently forming candle of the selected time frame Multiple bars may be optionally united into a single candle: helps to see the bigger picture Multifunctional Utility : 65+ features, including this indicator  |   Contact me  for any questions  |   MT5 version In the input settings, select the timeframe  that will be used for the future bar: To the right of the current price, you will see a bar forming on the specified interval. If activated in the settings, the Countdow
Profit/loss statistics for each day of the week Check out my  #1 Utility : 66+ features, including extended statistics  |   Contact me  if you have any questions Statistics display modes: For the  selected   currency pair/trading instrument Statistics for  all trades   (" ALL ") You can select the period for which you want to get statistics: 1 day 1 week 1 month 2   months 3   months 6   months 1 year 2 years All trading history Displayed information:  You will see statistics for each day of the
Trend on market
Makarii Gubaydullin
Trend dashboard: multi timeframe indicator, shows you the summary of the current trend This tool  is based on the 3 major indicators: RSI,  Stochastic and Commodity Channel Index. The   alerts   option   will help  you   not   to   miss   the   beginning   of the   trend. Multifunctional utility : includes 66+ features  |   Contact me  if you have any questions  |   MT5 version A variety of options will allow you to customize the indicator according to your needs. Settings: Calculated bar: eith
Multi TF Charts
Makarii Gubaydullin
Analyze up to 3 additional charts of other timeframes , without switching the main chart. Check out my  Multifunctional utility : 66+ features, including this tool  |   Contact me  if you have any questions   |    MT5 version The indicator opens in a  separate window: The window   can be moved   to any place on the chart (using the   [<M>]   button). The window can also be minimized to save space ( [ <^>]  button) In the window that appears, you can configure: The period   of the 1st chart (left
Money Meter
Makarii Gubaydullin
The indicator displays the levels of potential profit/loss for each direction (buy and sell). Check out  #1 Trade Assistant : 66+ features, including this tool  |   Contact me  if you have any questions You can set:  Lot size (there is also an option to auto-set the last used lot); Grid step : percentage / amount of money (green switch); Number of levels for each direction; Risk calculation for the current account balance / or for the free margin; In the initial settings of the indicator, you c
Filter:
No reviews
Reply to review