Trend Correction Histogram m
- Indicators
- Version: 2.31
- Updated: 5 December 2025
- Activations: 10

Crypto_Forex Indicator "Trend Correction Histogram" for MT4.
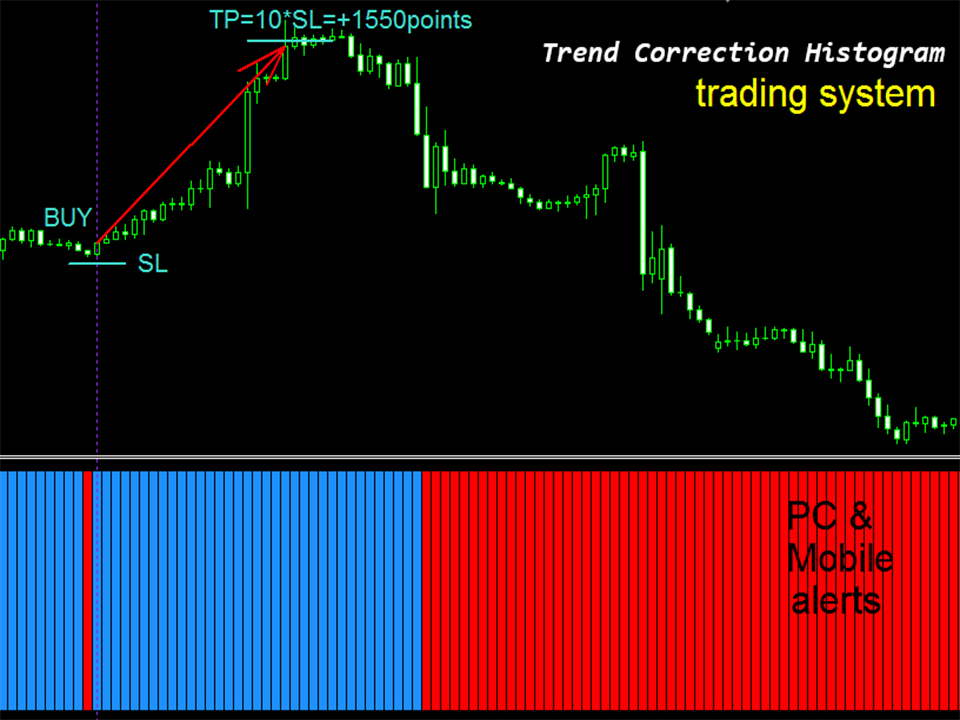
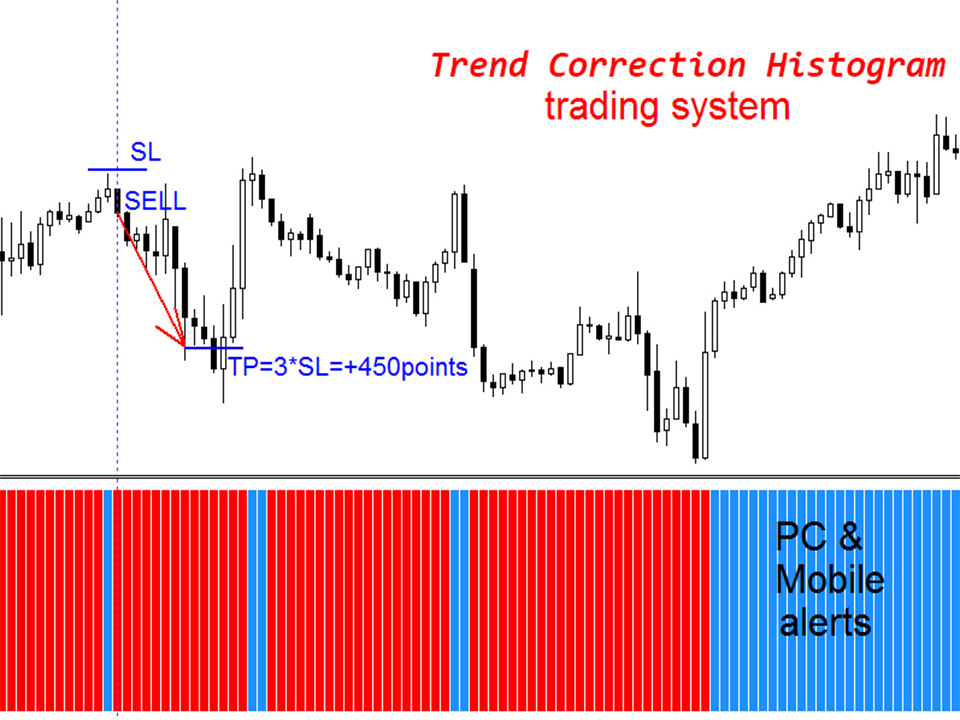
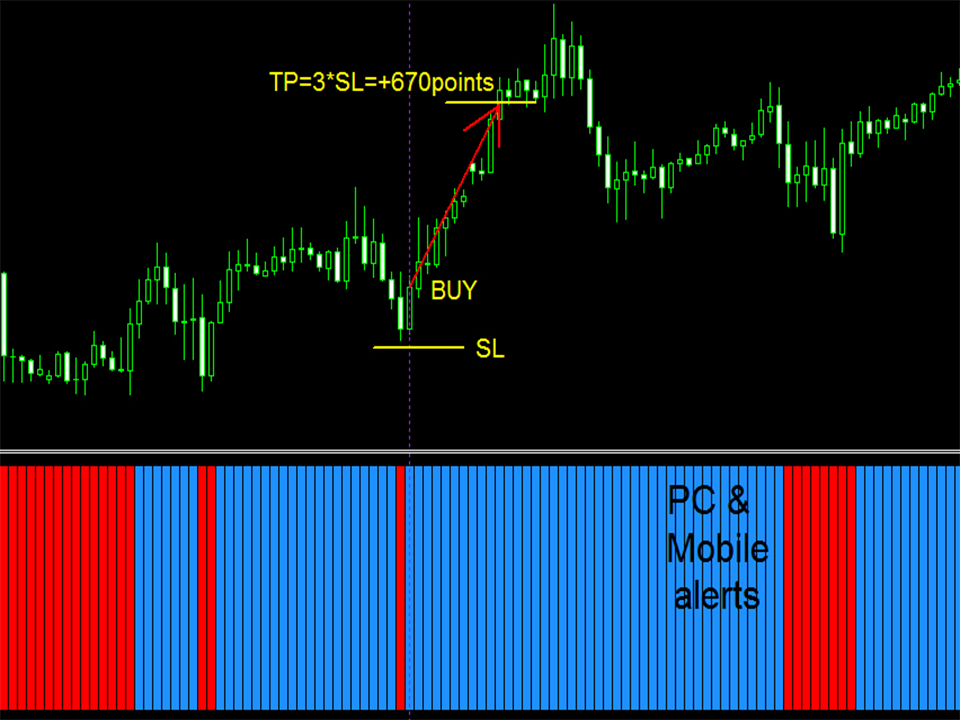
- Trend Correction Histogram can be in 2 colors: red for bearish trend and blue for bullish one.
- 7 consecutive histogram columns of the same color means beginning of new trend.
- Trend Correction Histogram indicator designed with the main purpose - to minimize losses and maximize profit.
- It has parameter - "Period", responsible for indicator's sensitivity.
- Built-in Mobile and PC alerts.
- Trend Correction Histogram can be use as a simple but profitable trading system, See below:
HOW TO USE indicator:
- 1) Check for at least 7 consecutive histogram columns of the same color, it means beginning of new trend. For example, there are more than 7 blue columns on the picture below.
- 2)Wait for just 1 (ONE) opposite color column, red in our case, which is changed again to blue one right after it. It means that it was trend correction.
- 3) Open Long trade when blue column take place, after just one red column before. It means that order was opened to the direction of main trend after correction.
- 4) Arrange SL (see pictures) and TP. TP should be at least 3 times bigger than SL. In this case you will be profitable even if you win only 30%.
- 5) Vice versa for Sell (short) trades (see pictures).
It is original product which is offered only on this MQL5 website.