Multi Pair Range Percentage Scanner
- Indikatoren
- Satya Prakash Mishra
- Version: 1.0
- Aktivierungen: 5
Overview
A Fibonacci levels scanner is a technical analysis tool that automatically identifies and plots key Fibonacci retracement and extension levels across multiple financial instruments or timeframes. It helps traders quickly locate potential support and resistance zones based on mathematical relationships derived from the Fibonacci sequence.
Core Functionality
Automatic Level Detection The scanner identifies significant price swings (swing highs and lows) and calculates Fibonacci ratios at key percentages: 23.6%, 38.2%, 50%, 61.8%, 78.6% for retracements, and 127.2%, 161.8%, 261.8% for extensions. It processes historical price data to find the most relevant pivot points for drawing these levels.
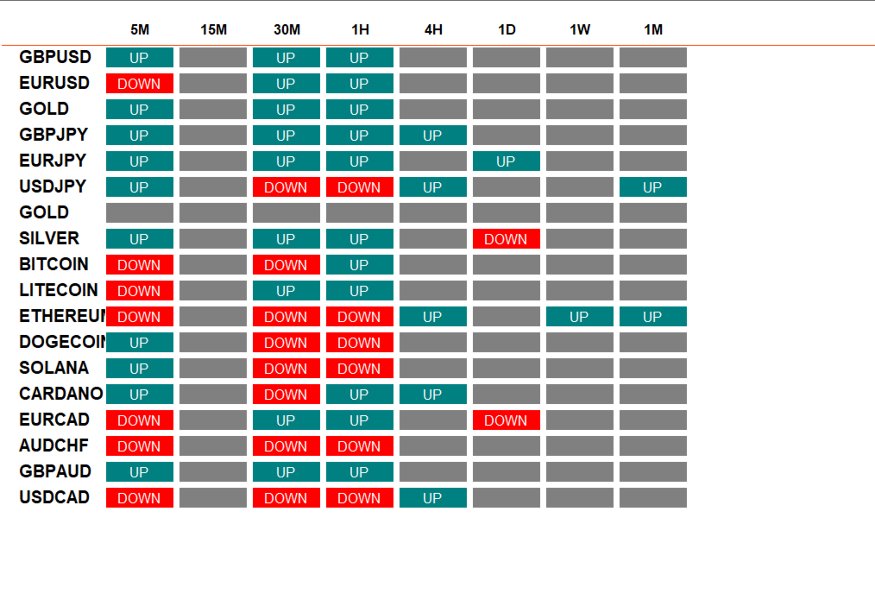
Multi-Instrument Scanning The tool can simultaneously analyze hundreds of stocks, forex pairs, commodities, or cryptocurrencies, ranking them based on how close current prices are to significant Fibonacci levels. This allows traders to quickly identify instruments approaching key technical zones across entire markets.
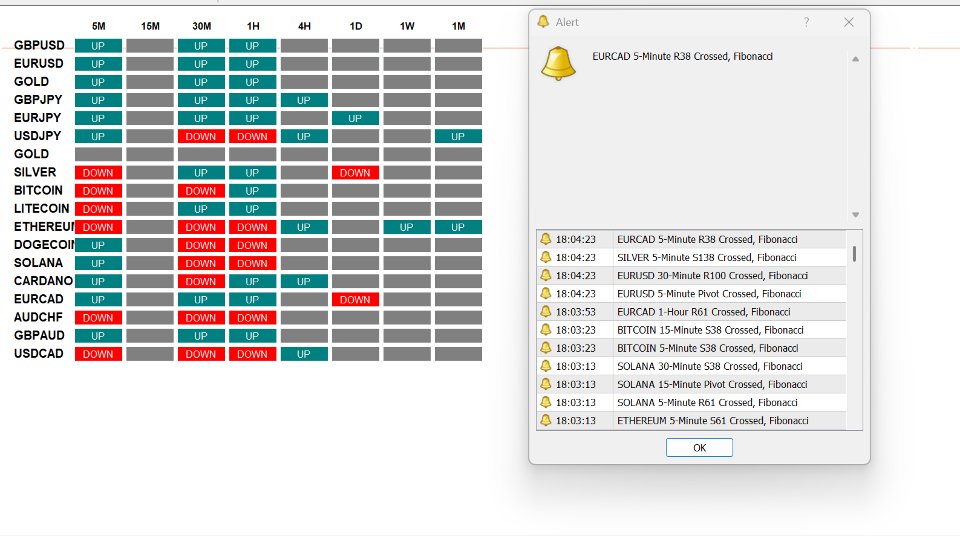
Real-Time Monitoring Advanced scanners provide live updates as prices approach or break through Fibonacci levels, sending alerts when instruments reach predetermined proximity thresholds (typically within 1-5% of a level).
Technical Components
Swing Point Algorithm The scanner uses algorithmic methods to identify significant highs and lows, often employing techniques like:
- Percentage-based swing detection (minimum price movement thresholds)
- Time-based validation (ensuring swing points maintain significance over multiple periods)
- Volume confirmation (incorporating trading volume to validate swing significance)
Level Calculation Engine Mathematical computations determine precise Fibonacci values:
- Retracement levels calculated from recent swing high to swing low
- Extension levels projected beyond current price movements
- Multiple timeframe analysis to identify confluences
Filtering and Ranking System Results are typically filtered and sorted by:
- Proximity to levels (distance from current price)
- Level significance (strength based on historical price reactions)
- Timeframe importance (longer timeframes given higher weight)
- Volume profile at key levels
Output Features
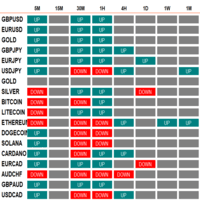
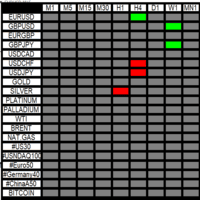
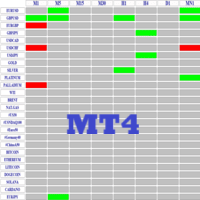
Visual Display Most scanners present results through sortable tables showing instrument names, current prices, nearest Fibonacci levels, percentage distances, and directional bias. Some include mini-charts with plotted levels for quick visual reference.
Alert Systems Customizable notifications trigger when prices approach levels, break through them, or show rejection patterns. Alerts can be delivered via email, SMS, platform notifications, or API webhooks.
Historical Back-Testing Advanced versions include performance analytics showing how frequently prices respect specific Fibonacci levels, helping traders assess the reliability of these technical zones for different instruments.
Practical Applications
Traders use Fibonacci scanners to identify potential entry and exit points, set stop-loss levels, and find confluence zones where multiple technical factors align. The tool is particularly valuable for swing traders and position traders looking to capitalize on mean reversion tendencies at mathematical support and resistance levels.
The scanner essentially automates the manual process of drawing Fibonacci levels across multiple charts, saving significant time while ensuring consistent application of these mathematical ratios across broad market analysis.
