Technische Indikatoren für den MetaTrader 4 - 26

Dieser Indikator basiert auf den Ideen von Dan Valcu.
Kerzenkörper (offen-geschlossen) sind die Hauptkomponente, die verwendet wird, um Trendrichtung, Stärke und Umkehrungen anzuzeigen und zu bewerten.
Der Indikator misst die Differenz zwischen Heikin Ashi schließen und öffnen.
Die Messung der Höhe der Kerzenkörper führt zu extremen Werten, die auf Trendverlangsamungen hinweisen. Auf diese Weise wird der Heikin Ashi quantifiziert, um frühere Signale zu erhalten.
Ich habe diesen Indikator au
FREE
Der Zweck dieser neuen Version des MT4-Standardindikators, der in Ihrer Plattform enthalten ist, besteht darin, in einem Unterfenster mehrere Zeitrahmen desselben Indikators anzuzeigen. Siehe das Beispiel im Bild unten. Aber die Anzeige ist nicht wie bei einem einfachen MTF-Indikator. Dies ist die tatsächliche Anzeige des Indikators in seinem Zeitrahmen. Hier sehen Sie die verfügbaren Optionen des FFx-Indikators: Wählen Sie die anzuzeigenden Zeitrahmen (M1 bis Monthly) Definieren Sie die Breite
FREE
Simulator für Risiko / Reward-Verhältnis-Rechner We-RiskReward ist ein MT4-Indikator, der vom We-Trading-Team entwickelt wurde, um eine Order mit dem Risk / Reward-Rechner zu simulieren.
Horizontale Linien Dieser Indikator zeigt Ihnen 3 horizontale Linien, die sind: Offene Linie Take Profit-Linie Stop-Loss-Linie Sie können die Linien verschieben und Sie sehen die R/R- und Lots-Berechnung in Echtzeit. Sie können mit diesem Indikator Long- und Short-Positionen simulieren.
Parameter des Indikator
FREE

RaysFX Handelsinfo Hallo zusammen, ich freue mich, Ihnen unseren neuesten Indikator vorstellen zu können: RaysFX Trade Info. Dieses Tool wurde entwickelt, um Ihnen detaillierte Informationen über Ihre Trades direkt in Ihrem MT4-Chart anzuzeigen. Hauptmerkmale Echtzeit-Informationen : RaysFX Trade Info liefert Ihnen Echtzeit-Informationen über Ihre offenen und geschlossenen Trades. Sie können den Gewinn in Punkten, Währung und Prozenten sehen. Anpassbar : Der Indikator ist in hohem Maße anpassbar
FREE
BinaryPin ist ein Indikator, der speziell für den Handel mit kurzfristigen binären Optionen entwickelt und angepasst wurde. Der Algorithmus des Indikators analysiert vor der Ausgabe des Signals viele Faktoren, wie z.B. die Marktvolatilität, sucht nach dem PinBar-Muster und berechnet die Erfolgswahrscheinlichkeit beim Abschluss eines Geschäfts. Die Einstellung des Indikators erfolgt auf die übliche Weise. Der Indikator selbst besteht aus einem Informationsfenster, in dem der Name des Handelsinst
FREE

Der Indikator basiert vollständig auf dem klassischen MFI-Indikator. I recommend watching my advisor - Night Zen EA
Er enthält zwei grundlegende Handelsstrategien: Der Ausgang der MFI-Linie aus überkauften/überverkauften Zonen. Der Eintritt der MFI-Linie in die überkauften/überverkauften Zonen. Die Pfeile werden nach Bestätigung des Signals durch die Strategien gezeichnet und werden nicht neu gezeichnet.
Es werden auch Alarme registriert: Warnungen Push-Benachrichtigungen an das mobile Endg
FREE
Entfesseln Sie intelligentes Handeln mit dem Smart Signal Generator Haben Sie genug vom Rätselraten bei Ihrem Handel? Der Smart Signal Generator ist Ihr neues, unverzichtbares Werkzeug, das Ihre Strategie vereinfacht und Ihnen einen entscheidenden Vorteil verschafft. Es handelt sich nicht um einen weiteren Indikator, sondern um ein System, das Ihnen mit hoher Wahrscheinlichkeit Einstiegssignale liefert, die Ihnen Zeit sparen und Ihr Vertrauen stärken. Hauptvorteile und Merkmale Intelligente Sign
FREE

Es gibt viele Candlestick-Muster, aber nur wenige sind wirklich wissenswert. Candlestick-Pattern-Filter erkennt und markiert die zuverlässigsten Candlestick-Muster. Denken Sie daran, dass diese Muster nur dann nützlich sind, wenn Sie verstehen, was in den einzelnen Mustern geschieht. Sie sollten mit anderen Formen der technischen Analyse kombiniert werden, um das beste Ergebnis zu erzielen. Diese Muster sind enthalten: Hammer / Hanging Man Umgekehrter Hammer / Sternschnuppe Bullish / Bearish Eng
FREE

Precision Pulse: Trendfolgender Indikator mit hoher Überzeugungskraft Produktübersicht Precision Pulse ist ein fortschrittlicher, multifaktorieller Trendfolgeindikator, der entwickelt wurde, um Handelssignale mit hoher Wahrscheinlichkeit zu liefern, indem er den langfristigen Trend, das kurzfristige Momentum und die überkauften/überverkauften Bedingungen rigoros aufeinander abstimmt. Er minimiert Marktgeräusche und "Whipsaws", indem er verlangt, dass alle grundlegenden Komponenten konvergieren,
FREE

Dieser Indikator ermöglicht es Ihnen, den Gewinn/Verlust des aktuellen, geschlossenen oder zukünftigen Handels in der Kontowährung zu messen und das Margin-Niveau zum Zeitpunkt des Handelsabschlusses zu schätzen. Der Gewinn/Verlust-Indikator basiert auf dem MT4-eigenen Fadenkreuz-Instrument und hat folgende Eingaben: Handelsrichtung = Kaufen/Verkaufen Losgröße = 0,1 Schriftgröße = 8 Schriftfarbe = DeepSkyBlue Offset horizontal Versatz vertikal
FREE

Verbessern Sie Ihre Price-Action-Strategie: Inside-Bar-Breakouts auf Tastendruck
Dieser Indikator erkennt die Innenseite von Bars in verschiedenen Bereichen und macht es Preis-Aktions-Händlern sehr einfach, Inside-Bar-Breakouts zu erkennen und darauf zu reagieren. [ Installationsanleitung | Update-Anleitung | Fehlerbehebung | FAQ | Alle Produkte ] Einfach zu bedienen und zu verstehen Anpassbare Farbauswahlen Der Indikator implementiert visuelle/mail/push/sound Warnungen Der Indikator wird nicht
FREE

Dieser Indikator zeigt den gestrigen und heutigen Höchst- und Tiefststand an, was sehr nützlich ist, um die Marktstimmung zu verstehen. Um innerhalb der Spanne zu handeln/auszubrechen. Das Tief vom Vortag kann als Unterstützung dienen - kann für einen Pullback oder Ausbruch genutzt werden. Das Hoch vom Vortag kann als Widerstand fungieren - kann für einen Pullback oder Ausbruch genutzt werden. Die Strategie des Hoch-Tief-Ausbruchs am Vortag bezieht sich auf eine Day-Trading-Technik, die Händlern
FREE

BB-Sub – Bollinger-Bänder im Unterfenster BB-Sub ist ein einfacher, aber leistungsstarker Indikator, der Bollinger-Bänder unabhängig im Unterfenster des Charts anzeigt. Im Gegensatz zu den Standard-Bollinger-Bändern, die im Hauptchart erscheinen, arbeitet BB-Sub in einem separaten Unterfenster. Dadurch gibt es keine Überlagerung mit Kerzen oder anderen Indikatoren – ideal für Trader, die sich ganz auf die Bewegung und Form der Bänder konzentrieren möchten. Hauptmerkmale Gleichzeitige Anzeige des
FREE
Signal Mastery: Ihr Vorteil auf dem Markt Haben Sie genug von nachlaufenden Indikatoren und verpassten Chancen? Lernen Sie Signal Mastery (EMA20-MACD-System) kennen - den leistungsstarken, nicht nachzeichnenden Indikator, der Ihnen mit hoher Wahrscheinlichkeit Handelssignale liefert, genau dann, wenn Sie sie brauchen. Dies ist nicht nur ein weiteres MACD- oder EMA-Tool. Es handelt sich um ein professionelles System, das die Logik des EMA 20 und des MACD Crossover intelligent kombiniert, um opti
FREE

Stochastic RSI führt eine stochastische Berechnung auf der Grundlage des RSI-Indikators durch. Der Relative Strength Index (RSI) ist ein bekannter Momentum-Oszillator, der die Geschwindigkeit und Veränderung von Kursbewegungen misst und von J. Welles Wilder entwickelt wurde.
Merkmale Finden Sie überkaufte und überverkaufte Situationen. Warnton, wenn das überkaufte/überverkaufte Niveau erreicht ist. Erhalten Sie E-Mail- und/oder Push-Benachrichtigungen, wenn ein Signal erkannt wird. Der Indikato
FREE

Der Indikator My Big Bars kann Balken (Kerzen) in einem höheren Zeitrahmen anzeigen. Wenn Sie ein H1-Diagramm (1 Stunde) öffnen, zeigt der Indikator darunter ein H4-Diagramm, ein D1-Diagramm und so weiter an. Die folgenden höheren Zeitrahmen können verwendet werden: M3, M5, M10, M15, M30, H1, H3, H4, H6, H8, H12, D1, W1 und MN. Der Indikator wählt nur die höheren Zeitrahmen aus, die über dem aktuellen Zeitrahmen liegen und ein Vielfaches davon sind. Wenn Sie einen M30-Chart (30 Minuten) öffnen,
FREE
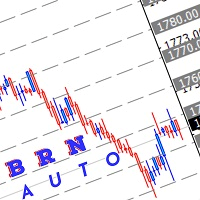
Verwenden Sie diesen Indikator, um mehrere horizontale Linien zur nächsten runden Zahl zu zeichnen Der Bereich für runde Zahlen kann manuell eingestellt werden, je nachdem, wie der Benutzer es verwenden möchte Die Auswahl der Farbe kann auch manuell angepasst werden. Ich hoffe, dieser Indikator kann jemandem bei seinem Handel helfen.
Wie man ihn benutzt: Meistens benutze ich diesen Indikator für Break, Retest und Entry. Beispiel:- aktueller Kurs XAUUSD :1740.00 was bedeutet, dass die nächstgele
FREE
Wie wir wissen, speichern МТ4 und МТ5 keine Tick-Historie, die für die Entwicklung von Handelsstrategien und Marktanalysen notwendig sein kann. Ich habe eine Methode entwickelt, mit der Sie die Tick-Historie sehr einfach erhalten können. Der Indikator sammelt den Tickverlauf in Echtzeit und schreibt ihn in die Datei XXXXXX2.hst, wobei XXXXXX ein Symbolname ist. Diese Datei kann verwendet werden, um einen Offline-Chart oder etwas anderes zu erstellen. Wenn Sie einen Handelsroboter verwenden, star
FREE

Slope Channel Indikator für MetaTrader
Suchen Sie ein Werkzeug zur Analyse von Markttendenzen, das für jeden Handelsstil geeignet ist? Slope Channel – Ihr zuverlässiger Helfer bei der Identifikation von Preisbewegungen und wichtigen Marktlevels! Was ist Slope Channel? Slope Channel ist ein innovativer Indikator, der einen geneigten Kanal im Chart konstruiert und seine Parameter automatisch auf Basis lokaler Extrempunkte berechnet. Dieses Tool hebt die optimale Kanaloption hervor, sodass
FREE

APP System Signals ist ein technischer Indikator, der für aktive Nutzer auf den Finanzmärkten entwickelt wurde. Er verwendet eine Kombination aus exponentiellen gleitenden Durchschnitten (EMA), einfachen gleitenden Durchschnitten (SMA) und Trendanalysen, um Kauf- und Verkaufssignale auf der Grundlage historischer Kursbewegungen und Marktstrukturen zu identifizieren. Alle Parameter sind vollständig anpassbar, sodass der Nutzer das Werkzeug individuell auf seine bevorzugte Analyse- oder Handelsmet
FREE

Der Indikator TwoMA Crosses zeigt Pfeile an, die darauf basieren, ob der kurzfristige gleitende Durchschnitt über oder unter dem langfristigen gleitenden Durchschnitt kreuzt. Ein gleitender Durchschnitt sagt nicht die Kursrichtung voraus. Stattdessen definiert er die aktuelle Richtung. Trotzdem verwenden Anleger gleitende Durchschnitte, um das Rauschen herauszufiltern. Händler und Investoren neigen dazu, den EMA-Indikator zu verwenden, vor allem in einem sehr volatilen Markt, da er empfindliche
FREE

1. Indikator Zweck und Inputs Überblick Der Linear Regression Forecaster ist ein fortschrittlicher analytischer Indikator, der für eine umfassende Trendermittlung und kurzfristige Kursprognosen unter Verwendung der statistischen Methode der linearen Regression (LR) entwickelt wurde.
Er ist für den wöchentlichen (W1) Zeitrahmen optimiert und kombiniert sowohl die langfristige Trendanalyse als auch die kurzfristige rollierende Trenddynamik , um zuverlässige wöchentliche Prognosen zu erstellen. Der
FREE

Beschreibung des Indikators Wenn Sie die zukünftige Volatilität für den Handel kennen müssen, ist dieser Indikator das, was Sie brauchen! Mit dem Predictor der ATR wird Ihr Handelssystem noch perfekter sein. Dieser Indikator sagt die künftige Volatilität voraus, und zwar ziemlich gut. Die Vorhersagegenauigkeit beträgt bis zu 95 % bei einem Abstand von bis zu 5 Takten in die Zukunft (für den Zeitraum H1). Die durchschnittliche Vorhersagegenauigkeit liegt bei etwa 85 %, die Anzahl der vorhergesagt
FREE

Trends sind so etwas wie der "Heilige Gral der Trader": Sie können Ihnen eine höhere Gewinnrate, ein besseres Risiko-Ertrags-Verhältnis, ein einfacheres Positionsmanagement und so weiter bieten...
Aber es ist wirklich schwer, den Trend mit Genauigkeit zu bestimmen, Fase-Signale zu vermeiden und mit dem richtigen Timing, um massive Bewegungen zu nehmen. Deshalb habe ich den Trend Validator entwickelt: ein neues und EINFACHES Tool, das die Identifizierung von Trends und die Entwicklung neuer Stra
FREE

Was ist Macro Kill Boxer? Macro Kill Boxer ist ein Indikator für die technische Analyse, der für die MetaTrader-Plattform entwickelt wurde. Er visualisiert Marktbewegungen während bestimmter Zeitintervalle (z.B. Asien, London Open/Close, New York AM/PM), indem er farbige Boxen auf dem Chart zeichnet. Jedes Kästchen steht für die Höchst- und Tiefstkurse innerhalb des definierten Zeitraums, die oft mit makroökonomischen Ereignissen oder Sitzungen mit hoher Volatilität verbunden sind. Was wird dami
FREE

Ich habe diesen einfachen Indikator erstellt, während ich etwas über Rob Smiths TheStrat lernte, und finde ihn so hilfreich, dass ich dachte, ich würde ihn mit Ihnen teilen. Wenn Sie es nützlich finden, schauen Sie sich bitte die anderen Indikatoren an, die ich auf MQL5 veröffentlicht habe. Der Indikator zeichnet einfach eine einzelne Linie auf dem Chart, die das von Ihnen ausgewählte Preisniveau aus einem höheren Zeitrahmen anzeigt. Mit den Einstellungen haben Sie die volle Kontrolle über den a
FREE

Supreme Direction ist ein Indikator, der auf der Marktvolatilität basiert. Der Indikator zeichnet einen zweilinigen Kanal mit 2 Farben oberhalb und unterhalb des Preises, dieser Indikator malt nicht neu oder zurück und das Signal ist nicht verzögert. Anwendung: Long über der lila Linie, Short unter der goldenen Linie. Parameter : Kanalperiode ========================================================
FREE
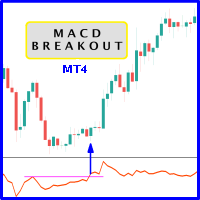
Es besteht die Wahrscheinlichkeit, dass höhere Kurse verzeichnet werden , wenn der MACD aus dem historischen Widerstandsniveau des Oszillators ausbricht. Es wird dringend empfohlen, Kursausbrüche mit Oszillatorausbrüchen zu bestätigen, da sie vergleichbare Auswirkungen haben wie das Durchbrechen von Unterstützungs- und Widerstandsniveaus durch den Kurs; sicherlich werden Short-Trades die gleiche Wahrnehmung haben. Der Vorteil ist, dass der Oszillatorausbruch oft dem Preisausbruch vorausgeht und
FREE

Leonardo Breakout SMC - Fortgeschrittener Handelsindikator
Übersicht Der Leonardo Breakout SMC ist ein Meisterwerk an Präzision und Innovation, geschaffen für alle, die die unsichtbaren Kräfte des Marktes verstehen und nutzen wollen. So wie Da Vinci die natürliche Welt mit akribischer Detailgenauigkeit beobachtete, enthüllt dieser MetaTrader 4 (MT4) Indikator die verborgenen Strukturen der Preisbewegung und ermöglicht es Händlern, die Essenz von Smart-Money-Konzepten (SMC) zu erfassen und make
FREE
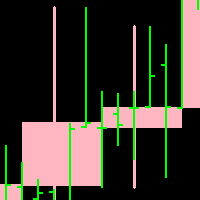
Candleline: Kerzenlinien-Indikator. Zeichnet die Kerzenlinie der angegebenen Periode auf dem aktuellen Chart. Darüber hinaus wird die neue Kerzenlinie mit der Kerzenlinie des aktuellen Charts überlagert.
Hinweis: Die Periode des aktuellen Charts muss kleiner sein als die Periode der zu zeichnenden Kerzenlinie.
Für den spezifischen Effekt der selbstzeichnenden Kerzenlinie sehen Sie bitte das beigefügte Bild unten. Parameter: 1.timeFrame; 2. NumberOfBar; 3.up candle line Farbe; 4.down candle li
FREE

Session Killzone Indikator
Indikator, der Ihnen hilft, die Killzone-Zeiten der Londoner und New Yorker Sitzungen zu identifizieren, die in der Regel die Zeiten hoher Volatilität und des Liquiditätsentzugs auf dem Markt sind. Die Killzone-Zeiten sind über die Indikatorparameter konfigurierbar. Der Indikator passt den Bereich der Killzones auf der Grundlage der täglichen Handelsspanne an.
FREE

Der Indikator sucht nach Markthochs und -tiefs. Sie werden durch Fraktale definiert, d.h. der Markt schafft den Algorithmus und die Struktur des Indikators, im Gegensatz zu ZigZag, das einen starren Algorithmus hat, der das Endergebnis beeinflusst. Dieser Indikator bietet eine andere Sicht auf die Preisreihen und erkennt Muster, die auf Standardcharts und Zeitrahmen nur schwer zu finden sind. Der Indikator wird nicht neu gezeichnet, sondern arbeitet mit einer kleinen Verzögerung. Das erste Frakt
FREE

Der Investment Castle Indicator hat die folgenden Eigenschaften: 1. gibt die Richtung des Trends in verschiedenen Zeitrahmen an . 2. zeigt die Trefferquote und die Gewinnquote auf dem Chart an. 3. Dieser Indikator malt das Diagramm nicht neu. 4. Dieser Indikator ist in den Support & Resistance basierten Investment Castle EA eingebaut, der mit dem Psychological Key Levels "Support & Resistance" Indikator arbeitet.
FREE

Der Durchschnitts-Einstiegspositionen-Indikator (The Average Entry Positions Indicator) Der Durchschnitts-Einstiegspositionen-Indikator bietet Tradern eine klare visuelle Darstellung ihrer durchschnittlichen Kauf- und Verkaufs-Einstiegspreise auf dem Chart. Dieses leistungsstarke Tool berechnet und zeigt nun entscheidende Informationen zum Trade-Management an, was zu besseren Entscheidungen und einer effizienten Positionsverfolgung beiträgt. Durch die Verwendung dieses Tools können Trader ihre G
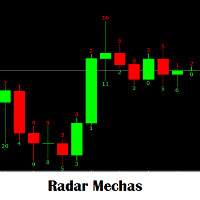
Indikator, der dazu dient, die Größe des Dochts zu sehen, der die Kerzen entsprechend der Größe verlässt, die eine Warnung zur manuellen Eingabe erzeugt. Nutzen Sie es maximal aus, dass eine Strategie Lücken in der Größe des Dochts der vorherigen Kerze oder derselben aktuellen Kerze aufwirft. eingeben, um zu kaufen und zu verkaufen. Es ist ein Indikator, der für jede Analyse erforderlich ist, die für einen neuen Eintrag vorgenommen wird. Es wird Ihr Lieblingswerkzeug sein.
FREE
Dieser Indikator misst die Volatilität in einem Multi-Timeframe-Modus und zielt darauf ab, flache Märkte, Volatilitätsspitzen und Preisbewegungszyklen auf dem Markt zu identifizieren. [ Installationsanleitung | Update-Anleitung | Fehlerbehebung | FAQ | Alle Produkte ] Handeln Sie, wenn die Volatilität auf Ihrer Seite ist Identifizieren Sie kurzfristige Volatilität und Preisspitzen Finden Sie Volatilitätszyklen auf einen Blick Der Indikator ist nicht nachbildend Die Bestandteile des Indikators si
FREE
Beherrschen Sie den Markt mit dem Laguerre Edge Signal Indicator! Hören Sie auf zu raten und fangen Sie an, mit Vertrauen zu handeln! Unser Laguerre Edge-Indikator ist Ihr ultimatives Werkzeug, um Einstiegspunkte mit hoher Wahrscheinlichkeit zu erkennen. Dieser Indikator kombiniert die Stärke zweier klassischer Analysemethoden - gleitende Durchschnitte für die Trendrichtung und den Laguerre RSI für die Erkennung von Umkehrpunkten - die alle durch die solide EMA 200 Trendlinie gefiltert werden.
FREE
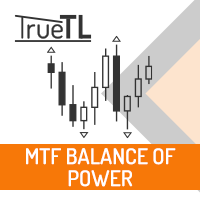
Hochgradig konfigurierbarer Balance of Power (BOP)-Indikator.
Merkmale: Hochgradig anpassbare Alarmfunktionen (bei Levels, Kreuzen, Richtungsänderungen per E-Mail, Push, Sound, Popup) Multi-Timeframe-Fähigkeit Farbanpassung (bei Levels, Kreuzen, Richtungswechseln) Optionen für lineare Interpolation und Histogramm-Modus Funktioniert im Strategie-Tester im Multi-Timeframe-Modus (auch am Wochenende ohne Ticks) Einstellbare Levels Parameter:
BOP Timeframe : Sie können die unteren/höheren Timeframes
FREE

SPREADEX ist ein Indikator für MT4 und MT5, der den Abstand des ASSET vom GP anzeigt. Der GP ist der Preis des wahren Wertes des zugrunde liegenden ASSET, der durch Schätzung ermittelt wird. Der GP ist wie ein Magnet, er zieht den Preis des ASSET mit hoher Wahrscheinlichkeit und innerhalb desselben Handelstages an. So zeigt SPREADEX in Echtzeit an, welche Vermögenswerte im Moment am weitesten vom GP entfernt sind. Dies gibt dem Trader einen Anhaltspunkt, auf welche Vermögenswerte er sich konzent
FREE

Der Indikator zeichnet Preiskanäle. Er kann so angepasst werden, dass nur Kauf- oder Verkaufskanäle angezeigt werden. Außerdem können anstelle von Kanälen auch Trendlinien angezeigt werden. Dieser Indikator ist einfach zu verwenden, aber dennoch gibt es viele Handelsstrategien, die auf dem Kanalhandel basieren. Auf diesem Indikator basierender Advisor: https: //www.mql5.com/en/market/product/37952 Parameter Historie - maximale Anzahl von Balken zur Bildung von Kanälen; Abstand - Mindestabstand v
FREE
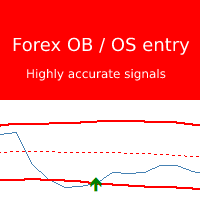
Der Forex Überkauft / Überverkauft Indikator basiert auf einer sehr leistungsfähigen Strategie, die sehr genaue Einstiegspfeile liefert. Der Indikator platziert Pfeile auf "neue Kerze" und malt NICHT neu! Dieser Indikator ist ein MUST HAVE , wenn Sie mit einer Umkehrstrategie handeln. Dieser Indikator kann leicht mit Ihren anderen Handelsindikatoren kombiniert werden, um Umkehrungen oder Tiefs zu bestätigen. Wenn Sie jemals Probleme hatten, korrekte Einstiege zu finden, ist dieser Indikator das
FREE

Wie Sie wissen, bewegt sich der Preis immer in einem bestimmten Kanal, und wenn der Preis den Kanal verlässt, tendiert er immer dazu, wieder in den Handelskanal zurückzukehren. Der Ind Channel Exit Indikator hilft Ihnen dabei, das Verlassen des Kanals nicht zu verpassen. Er kann eine Warnung anzeigen oder eine Nachricht an das Terminal auf Ihrem Smartphone senden, dass der nächste Balken über oder unter dem Kanalniveau geschlossen hat. Er verfügt über eine minimale Anzahl von Einstellungen, wob
FREE

CDS SR Fractal Level: Verbessern Sie Ihre Handelsgenauigkeit mit automatischen fraktalbasierten Unterstützungs- und Widerstandsniveaus Der CDS SR Fractal Level Indikator ist ein fortschrittliches Handelsinstrument, das von CDS entwickelt wurde, um automatisch wichtige Unterstützungs- und Widerstandsniveaus (SR) zu identifizieren und zu visualisieren. Dieser Indikator nutzt das Konzept der Fraktale, um relevante SR-Levels für Ihre Handelsentscheidungen darzustellen. Hauptmerkmale: Automatische Id
FREE
Hochgradig konfigurierbarer Macd-Indikator.
Merkmale: Hochgradig anpassbare Alarmfunktionen (bei Levels, Kreuzen, Richtungsänderungen per E-Mail, Push, Sound, Popup) Multi-Timeframe-Fähigkeit Farbanpassung (bei Pegeln, Kreuzen, Richtungsänderungen) Optionen für lineare Interpolation und Histogramm-Modus Funktioniert im Strategie-Tester im Multi-Timeframe-Modus (auch am Wochenende ohne Ticks) Einstellbare Levels Parameter:
Macd Timeframe: Sie können die unteren/höheren Zeitrahmen für Macd einst
FREE

Empfohlener Broker für die Verwendung des Indikators: https://tinyurl.com/5ftaha7c Indikator, der von Diogo Sawitzki Cansi entwickelt wurde, um mögliche Handelspunkte anzuzeigen. Nicht neu malen. Die in der Vergangenheit angezeigten Ergebnisse sind genau das, was passiert ist. Wir verwenden den Indikator auch, um Trades länger zu halten und nicht bei falschen Umkehrsignalen auszusteigen, die eigentlich nur Gewinnmitnahmen sind und niemand versucht, die Richtung des Trends umzukehren. Parameter d
FREE

Forex Target Zones Indicator - Master Key Support & Resistance Levels
Erschließen Sie sich die Macht des präzisen Handels mit dem Forex Target Zones Indicator, dem ultimativen Werkzeug zur Identifizierung von Kauf- und Verkaufszonen mit hoher Wahrscheinlichkeit auf der Grundlage früherer wöchentlicher und täglicher Höchst- und Tiefststände. Dieser Indikator wurde sowohl für Scalper als auch für Swing Trader entwickelt und hebt kritische Niveaus hervor, auf denen der Preis wahrscheinlich reagie
FREE

CCI Trend Finder Indikator mit verschiedenen Farben auf den Ebenen 0, 100 und -100. Das Kreuz ist ein Signal für "123 Exit", wie es von MPlay vorgestellt und in Woodies CCI-System verwendet wird. Dieses Ausstiegssignal ist vor allem bei kurzfristigen Ausbruchsgeschäften effektiv, da es einen vorzeitigen Ausstieg bei kleinen Korrekturen verhindert. Dieser Indikator eignet sich hervorragend, um ihn als zusätzliches Werkzeug für Ihre Analyse zu nutzen.
FREE
Parabolic Sar Easy Mode, Remake der ursprünglichen p.sar Indikator macht es einfacher zu lesen für Anfänger Händler und experimentiert Händler suchen, um die Zeit zu analysieren die Charts, können Sie Ihre eigene Strategie modificating die Perioden und fusioning es mit anderen Indikatoren wie RSI, Stochastik oder was Sie wollen, seine ein Indikator läuft besser auf hohe Zeit-Charts wie H4 oder D1.
FREE

Bitte Good Review auf diesen Indikator, und ich werde vielleicht produzieren mehr Indikatoren, Coming soon, EA Basis auf diese Indikatoren
Linear Weighted Moving Average mit HLCC angewendet Preis, und Bollinger Bands mit LWMA als angewandte Preis. Interessante Kauf- und Verkaufspfeil basierend auf diesem Indikator, nicht Lag-Indikator als Pfeil wird 1 Kerze nach gekreuzt erscheinen...............
FREE

QuantumAlert CCI Navigator ist ein kostenloser Indikator, der für MT4/MT5-Plattformen verfügbar ist. Seine Aufgabe ist es, "Alarme" zu liefern, wenn sich der Markt in "überkauften und überverkauften" Regionen in Form von "Kauf- oder Verkaufssignalen" befindet. Dieser Indikator verfügt über viele Anpassungsoptionen, die im Abschnitt "Parameter" unten aufgeführt sind. Der Benutzer kann diese Parameter nach Bedarf anpassen. Treten Sie unserer MQL5-Gruppe bei, in der wir wichtige Neuigkeiten und Upd
FREE

Dieser Indikator zeichnet regelmäßig bullische und bärische Divergenzen in Echtzeit in die Charts ein. Der Algorithmus zur Erkennung dieser Divergenzen basiert auf meiner über 10-jährigen Erfahrung mit der visuellen Erkennung von Divergenzen. Die Divergenzen werden als grüne und rote Rechtecke auf den Charts dargestellt. Sie können im visuellen Modus des Strategietesters sogar Vorwärtstests durchführen. Diese KOSTENLOSE Version ist auf EURUSD und GBPUSD beschränkt. Die Vollversion ohne Einschrän
FREE

Der R Silver Trend Indikator ist ein trendfolgender Handelsindikator, der den aktuellen Trend direkt auf dem Aktivitätsdiagramm von Metatrader 4 anzeigt.
Es zeichnet zwei Arten von Kerzen: Blau steht für bullische Kursbewegungen. Rot für rückläufige Preisbewegung.
Der Handel mit dem R Silver Trend Indikator ist selbst für absolute Anfänger recht einfach und kann für Scalping (M1, M5), Daytrading (M5, M15, M30) und Swingtrading (H1, H4, D1) Währungen verwendet werden.
Grundlegende Handelssign
FREE

Beschreibung:
Dieser Indikator (mit seinem Algorithmus) markiert relative Hochs und Tiefs, die eine Reihe von nützlichen Anwendungen haben.
Dieser Indikator wird nie neu gezeichnet.
Eigenschaften:
Markiert relative Hochs und Tiefs Verwenden Sie diesen Indikator, um Punkte der Trendfortsetzung zu bestimmen, d. h., wo der Trend einen Rückzieher machen könnte, bevor er über diesen Punkt hinaus weiter steigt oder fällt. Oder verwenden Sie diese Funktion, um potenzielle Umkehrpunkte zu bestimmen
FREE

FusionAlert StochRSI Master ist ein Indikator, der für MT4/MT5-Plattformen verfügbar ist. Er ist eine Kombination aus RSI- und Stochastik-Indikator, die "Alarme" liefern, wenn sich der Markt in "überkauften und überverkauften" Regionen befindet, was in Kombination beider Indikatoren zu präziseren und genaueren Signalen führt, die als wunderbares Werkzeug in Form von "Kauf- oder Verkaufssignalen" verwendet werden können. Dieser Indikator verfügt über viele Anpassungsoptionen, die im Abschnitt "Pa
FREE

Pfeilindikator (Kauf-/Verkaufswarnungen) - ein einfaches, aber leistungsstarkes Tool! Product Version: 1.01 Indicator Type: Trend Reversal Signals Timeframes Supported: All (Recommended: H1, H4, D1) Hauptmerkmale: Buy Signal: Green upward arrow () appears below the candle Verkaufssignal : Roter Abwärtspfeil () erscheint über der Kerze Präzise Erkennung von Trendumkehrsignalen - Basierend auf der bewährten SMA-Strategie. ️ Saubere Chartan
FREE

IceFX VelocityMeter ist ein einzigartiger Indikator auf der MetaTrader 4 Plattform, der die Geschwindigkeit des Devisenmarktes misst. Es ist kein normaler Volumen- oder sonstiger Messindikator, denn IceFX VelocityMeter ist in der Lage, Marktgeschwindigkeitsbewegungen zu verstehen, die in Ticks versteckt sind und diese wertvollen Informationen können nicht auf gewöhnliche Weise aus den Kerzen gelesen werden. Die Software überwacht die empfangenen Ticks (Frequenz, Größe der Veränderung) innerhalb
FREE

Der Zweck dieser neuen Version des MT4-Standardindikators, der in Ihrer Plattform enthalten ist, besteht darin, in einem Unterfenster mehrere Zeitrahmen desselben Indikators anzuzeigen. Siehe das Beispiel im Bild unten. Aber die Anzeige ist nicht wie bei einem einfachen MTF-Indikator. Dies ist die tatsächliche Anzeige des Indikators in seinem Zeitrahmen. Hier sehen Sie die verfügbaren Optionen des FFx-Indikators: Wählen Sie die anzuzeigenden Zeitrahmen (M1 bis Monthly) Definieren Sie die Breite
FREE

SmartChanelFree ist ein universeller Indikator für alle Arten von Märkten. Diesen Indikator sollte jeder Trader in seinem Arsenal haben, da er einen klassischen Ansatz zur Analyse des Preises eines Handelsinstruments darstellt und eine fertige Handelsstrategie ist. Der Indikator bildet die obere, durchschnittliche Preisbewegungsgrenze. Achtung !!! Diese Version des Indikators ist eine Testversion und funktioniert nur auf dem Chart mit der Periode M1. Die Vollversion des Indikators finden Sie un
FREE
Hochgradig konfigurierbarer Bollinger Bands Indikator. Merkmale: Hochgradig anpassbare Alarmfunktionen (bei Levels, Kreuzen, Richtungsänderungen per E-Mail, Push, Sound, Popup) Multi-Timeframe-Fähigkeit Farbanpassung (bei Niveaus, Kreuzen, Richtungswechseln) Option für lineare Interpolation Funktioniert im Strategie-Tester im Multi-Timeframe-Modus (auch am Wochenende ohne Ticks) Parameter:
Bollinger Bands Timeframe: Sie können den unteren/höheren Zeitrahmen für Bollinger Bands festlegen. Bollin
FREE

Der Magic LWMA-Indikator ist eine große Hilfe bei der Bestimmung der Trendrichtung. Es kann eine hervorragende Ergänzung zu Ihrer bestehenden Strategie oder die Grundlage für eine neue sein. Wir Menschen können bessere Entscheidungen treffen, wenn wir visuell besser sehen. Also haben wir es so gestaltet, dass es für steigende und fallende Trends eine andere Farbe anzeigt. Jeder kann dies so anpassen, wie es ihm am besten passt. Indem wir den Trendzeitraum festlegen, können wir ihn für längere o
FREE

Der Indikator wurde speziell für das Handelsdienstprogramm Trade Shell (einschließlich Trade Shell SMC ) entwickelt, damit er im visuellen Strategietester funktioniert.
Testen Sie Ihre Handelsideen und Indikatoren im Backtest. Starten Sie Trade Shell auf dem visuellen Tester und setzen Sie den Indikator dann auf den Chart. Danach können Sie alle Funktionen der Trade Shell so gut steuern wie im Live-Betrieb! Es funktioniert nicht live! Verwenden Sie ihn nur mit dem visuellen Tester. Es ist nicht
FREE

Trend is Friends ist ein Linienindikator, der als Hilfsinstrument für Ihre Handelsstrategie verwendet wird. Der Indikator analysiert die Standardabweichung der Bar schließen für einen bestimmten Zeitraum und erzeugt einen Kauf oder Verkauf Trend, wenn die Abweichung erhöht. Er lässt sich gut mit Martingale EA kombinieren, um dem Trend zu folgen, und mit Sellect Buy Only/Sell Only für EA, die halbautomatisch arbeiten. Sie können diesen Indikator mit allen EAs in meinen Produkten verwenden .
FREE
Das Erkennen von Trends ist eine der wichtigsten analytischen Fähigkeiten im Handel. Nicht nur technische Händler, sondern auch diejenigen, die sich fundamental orientieren, sollten den Forex-Trend als Grundlage der Analyse nutzen, um den Einstieg in den Handel zu bestimmen. Allerdings ist das Erlernen der Beobachtung von Devisentrends nicht so einfach, wie es scheint. Wenn Sie Signalgenauigkeit wünschen, um die Richtung des nächsten Preises zu schätzen, dann gibt es fortgeschrittene Methoden zu
FREE
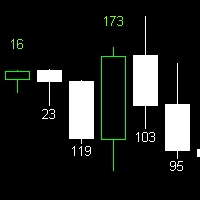
Indikator für Kerzengröße Erforschen Sie die Kerzengröße mit diesem praktischen Indikator. Er funktioniert in verschiedenen Zeitrahmen und liefert wertvolle Erkenntnisse für die technische Analyse. Hauptmerkmale: Zeigt die Größe der Kerze nach der Konfiguration des Indikators an. Kompatibel mit allen Timeframes. Die Kerzengröße ist eine wichtige Kennzahl in der technischen Analyse, die Aufschluss über die Marktstärke und die Volatilität gibt. Dieser Indikator ermöglicht eine klare und genaue Vis
FREE

Die kostenlose Version des Hi Low Last Day MT4 Indikators . Der Hi Low Levels Last Day MT4 Indikator zeigt das Hoch und das Tief des letzten Handelstages . Sie haben die Möglichkeit , die Farbe der Linien zu ändern . Testen Sie die volle Version des Hi Low Last Day MT4 Indikators , in welche zusätzliche Indikator Funktionen verfügbar sind : Anzeige des Minimums und des Maximums des vorletzten letzten Tages Anzeige des Minimums und des Maximums der vorangegangenen Woche Ton Alarm beim Überschreit
FREE

Der Vortex-Indikator wurde von Etienne Botes und Douglas Siepman entwickelt und besteht aus zwei Oszillatoren, die positive und negative Trendbewegungen erfassen. Bei der Entwicklung dieses Indikators stützten sich Botes und Siepman auf die Arbeiten von Welles Wilder und Viktor Schauberger, der als Vater der Implosionstechnologie gilt. Trotz einer recht komplizierten Formel ist der Indikator recht einfach zu verstehen und leicht zu interpretieren. Ein Aufwärtssignal wird ausgelöst , wenn der pos
FREE

Vorteile: Basiert auf klassischen Indikatoren - ATR, Gleitender Durchschnitt Bestimmt den Trend / Flat im Markt durch Einfärben des Histogramms mit der entsprechenden Farbe Pfeile zeigen bestätigte Signale an Es ist ein hervorragender Filter für Kanalstrategien (bei Extremen)
Einstellungen :
Наименование Описание настройки Periode des Flachdetektors Anzahl der Balken/Kerzen für die Analyse Zeitraum des EMA Zeitraum des EMA (Gleitender Durchschnitt) Zeitraum der ATR Zeitraum von ATR (aktueller
FREE
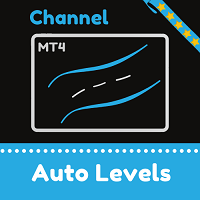
Dynamischer Kanal. Die Kanalbreite ändert sich automatisch in Abhängigkeit von der Preisbewegung. Je stärker die Abweichung von der Mitte des Kanals ist, desto breiter werden die Grenzen. Der Indikator passt sich an die Bewegungen an dem von ihnen festgelegten Teil des Diagramms an (Parameter "Bars for calculations"). Dementsprechend, wenn der Preis in einem bestimmten Intervall einen starken Schwung gemacht hat, wird sich der Kanal erweitern und auf weitere starke Schwankungen warten. Das heißt
FREE
Hören Sie auf zu raten, fangen Sie an zu bestätigen: Die Einführung von Signal Sentinel Haben Sie genug von Signalen, die Sie im Regen stehen lassen? Der Signal Sentinel-Indikator ist Ihre ultimative Waffe gegen die Ungewissheit am Markt. Er wurde entwickelt, um Ihnen hochwahrscheinliche Handels-Setups direkt auf Ihr Chart zu liefern. Wir haben die Kraft von zwei MACDs mit einem langfristigen EMA-Filter kombiniert, um sicherzustellen, dass Sie nur in den stärksten, am besten bestätigten Trends
FREE

T-Explorer ist ein Echtzeit-optimiertes MetaTrader 4-Tool, das handelbare Informationen auf Basis der 10 beliebtesten und zuverlässigsten technischen Indikatoren in vielen Zeitrahmen liefert. Unsere maschinellen Lernmodelle berechnen die optimalen Regeln und Konfigurationen für jeden Indikator, um Signale mit hoher Erfolgswahrscheinlichkeit zu liefern. Der Benutzer kann den T-Explorer individuell anpassen, indem er die geeigneten Zeitrahmen und Modi (FAST, MEDIUM, SLOW ) für die zu verwendenden
FREE
Der MetaTrader Market ist eine einzigartige Plattform für den Verkauf von Robotern und technischen Indikatoren.
Das Merkblatt für Nutzer der MQL5.community informiert Sie über weitere Möglichkeiten: nur bei uns können Trader Handelssignale kopieren, Programme bei Freiberuflern bestellen, Zahlungen über das Handelssystem automatisch tätigen sowie das MQL5 Cloud Network nutzen.
Sie verpassen Handelsmöglichkeiten:
- Freie Handelsapplikationen
- Über 8.000 Signale zum Kopieren
- Wirtschaftsnachrichten für die Lage an den Finanzmärkte
Registrierung
Einloggen
Wenn Sie kein Benutzerkonto haben, registrieren Sie sich
Erlauben Sie die Verwendung von Cookies, um sich auf der Website MQL5.com anzumelden.
Bitte aktivieren Sie die notwendige Einstellung in Ihrem Browser, da Sie sich sonst nicht einloggen können.