Technische Indikatoren für den MetaTrader 4 - 92

Der Hintergrundtrend ist ein Indikator, der uns hilft, den Trend zu erkennen, der den Markt zieht. Der Indikator hat 2 Möglichkeiten: 1) Wenn der Indikator über Null liegt, ist der Trend kaufend und der Indikator wird grün sein.
2) Liegt der Indikator unter Null, ist der Trend verkaufend und der Indikator ist rot.
Sie können die Demo herunterladen und sie selbst testen.
Der Indikator verfügt über eine Texthilfe in der oberen rechten Ecke, die anzeigt, ob der Indikator einen bullischen oder b

Dokumentation zum Verbinden von Metatrader 4 mit Python mit einem einfachen Drag & Drop-EA. Eine vollständige End-to-End-Lösung, vollständig getestet, schnell und effizient!
Das Pytrader-Ökosystem besteht aus einem Python-Skript und einem MT4- oder MT4-EA. Weiterhin wird für die Lizenzierung ein Indikator verwendet. Die Kommunikation zwischen dem Python-Skript und dem EA basiert auf Sockets. EA ist der Server und das Python-Skript der Client. Es ist immer Abfrage (Funktion / Python-Skript) und
Trendumkehr-Indikator, keine Neuzeichnung. Sauberes und leichtes Rendering Es gibt kein alternatives Kauf-Verkaufssignal ohne Berücksichtigung des Trends. Fähigkeit zur Rauschfilterung. Funktioniert mit allen Paaren.
Ideal für Anfänger und erfahrene Trader Es ist am besten auf Zeitrahmen über dem M30, vom Beginn der Londoner Sitzung nach Amerika verwendet.
Es sollte daran erinnert werden, dass es keine Indikatoren gibt, die nicht falsch sind. Jede Strategie erfordert eine Bestätigung ihrer Si
wenn Sie mehr Informationen wünschen, bitte pm mich
HI Jungs dies meine Entwicklung Indikator 1. Version alert Logik gut funktionieren.. dieser Indikator mit können Sie stärkere Währung und Top schwächere Währung gut finden, dies; s Indikator multy MTF Zeitrahmen Stärke work.very gut für SL Trend Screener Intraday-Händler und lange Zeit Trader, sehr leicht können Sie beobachten, stärkere und schwächere index.I hoffen, dass mehr zu verbessern diese Zukunft weiter, danke

Binäre Optionen Unterstützung-Widerstand-Indikator Dieser Indikator wurde für den Handel mit binären Optionen entwickelt und zeigt effektiv Rückschritte von Unterstützungs- und Widerstandsniveaus an. Die Signale erscheinen auf der aktuellen Kerze. Ein roter Pfeil, der nach unten zeigt, weist auf eine potenzielle Verkaufsmöglichkeit hin, während ein blauer Pfeil, der nach oben zeigt, auf Kaufgelegenheiten hindeutet. Lediglich die Farbe der Signalpfeile muss angepasst werden. Es wird empfohlen, i
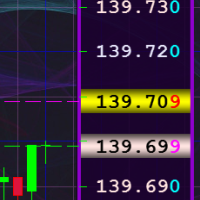
Der Indikator wurde entwickelt, um die standardmäßige vertikale Preisskala, die sich auf der rechten Seite des Chart-Fensters des Client-Terminals befindet, durch eine bequemere Preisskala mit der Möglichkeit der detaillierten Einstellung der Anzeigeparameter dieser Skala zu ersetzen. Darüber hinaus ermöglicht der Indikator, den Hintergrund des Chart-Fensters mit einem beliebigen Bild zu füllen und ein zweifarbiges Raster mit Elementen seiner Feineinstellung zu erstellen. Der Indikator ist vor a
Original Trrend Arrow Trendindikator, der Kauf- und Verkaufsbereiche anzeigt. Mit diesem Indikator müssen Sie nicht Tag und Nacht am Computer sitzen und darauf warten, dass der Wendepunkt erscheint.
Der Indikator ist sehr einfach zu bedienen. Wenn ein Aufwärtspfeil erscheint, eröffnen Sie ein Kaufgeschäft. Wenn ein Abwärtspfeil erscheint, eröffnen Sie ein Verkaufsgeschäft.
Der Indikator funktioniert für alle Zeitrahmen und Währungspaare. Es ist ratsam, den Indikator in Kombination mit anderen

Der LSM TrendReversal Pro Indikator ist ein ideales Werkzeug zur Identifizierung von Trend- und Angebots-/Nachfragezonen (Reversal) im Detail und insgesamt für Scalping/Day Trading oder Swing Trading. Der Indikator verfügt über ein MTF (Multi Time Frame) -Trendfiltersystem . 1. Einfaches Verfolgen des Trends 2. Fangen Sie den Trendumkehrbereich (Kombiniert mit dem " SupplyDemand Zones Indikator " ) 3. Unterstützende Einstiegs-/Ausstiegspunkte (Handelsrichtung)
Basket Currency Strength Indikato
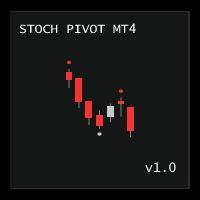
Stochastic Pivot zeichnet einen Punkt auf dem Chart, wenn die Stochastic überkauft oder überverkauft ist. In überkauften Perioden zeichnet dieser Indikator den Pivot-Punkt am Hochpunkt der höchsten Kerze und am Tiefpunkt der niedrigsten Kerze in überverkauften Perioden. NB: Alle Pivot-Punkte werden "bei Tick" und "bei jedem Chart-Ereignis" sofort aktualisiert. Einstellungen Name Beschreibung Obere Grenze Stochastic Overbought Level einstellen
Untere Grenze
Stochastic Oversold Level festlegen %

Eine der größten Herausforderungen für Händler ist es, das richtige Handelssystem für sich zu finden. Der Trend-Op-Indikator prognostiziert die wahrscheinlichste kurzfristige Kursbewegung auf der Grundlage komplexer mathematischer Berechnungen. Dieser Indikator wurde entwickelt, um Trends in der Preisbewegung zu erkennen, und ermöglicht es Ihnen, nicht nur die Richtung des Trends schnell zu bestimmen, sondern auch die Ebenen der Interaktion zwischen Käufern und Verkäufern zu verstehen. Er hat k

Der San Andres Fault ist ein Indikator, der entwickelt wurde, um die Bewegungen zu erkennen, die den Markt zum Beben bringen. Dieses System erkennt ein Beben und kennzeichnet seine Intensität in Echtzeit, um in Ihrem Betrieb zu entscheiden. Darüber hinaus ermöglicht die Aufzeichnung des sismischen Signals die Interpretation von Bewegungsmustern, die uns bei der Entscheidungsfindung helfen. Sie können die Demo herunterladen und sie selbst testen.
Der Indikator verfügt über eine Texthilfe in der

GS trendS ist ein Trendindikator, der für jedes Forex-Finanzinstrument verwendet werden kann.
Der Indikator wird nicht neu gezeichnet und verzögert nicht. Empfohlener Zeitrahmen H1.
Es ist möglich, die Einstellungen des Trendalgorithmus zu wählen {Nur Öffnen, Durchschnittliches Öffnen/Schließen, Durchschnittliches Hoch/Tief}
Die Farbe zeigt die Richtung des Trends an: gelb - Richtung kann VERKAUFEN oder KAUFEN (S_B) sein
blau - Aufwärtstrend (KAUFEN)
rot - Abwärtstrend (VERKAUFEN) Das Indi
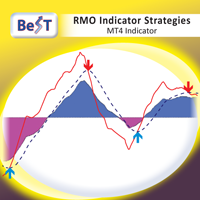
BeST_RMO Indicator Strategies ist ein MT4-Indikator, der auf dem entsprechenden berühmten Oszillator von Rahul Mohindar basiert, der Trends in allen Märkten erkennt und Kauf- und Verkaufssignale mit hoher Gewinnwahrscheinlichkeit erzeugen kann, die ein vollständiges und eigenständiges Handelssystem mit beeindruckenden Ergebnissen bilden.
Der Indikator verwendet 2 Strategien zur Auswahl: i) Classic : erzeugt umgekehrte Einstiegssignale durch die Kreuzungen der Null-Linie (0) und ii) MAsSignals :

Der Trend Hist-Indikator wurde entwickelt, um den Trailing-Algorithmus auf einem Diagramm anzuzeigen und visuell zu bewerten, und zwar innerhalb von Balken.
Dieser Indikator findet starke Trendbewegungen eines Währungspaares in einer bestimmten Anzahl von Balken und findet auch eine Korrektur dieses Trends. Wenn der Trend stark genug ist und die Korrektur gleich der in den Parametern angegebenen ist, dann signalisiert der Indikator dies.
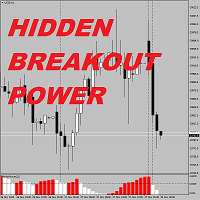
Versteckte Ausbruchskraft Der Markt hat einen Zyklus, bewegt sich immer wieder von: BEREICH -> AUSBRUCH -> TREND -> KONSOLIDIERUNG -> BEREICH RANGE und TREND Die beiden wichtigsten Staaten, während die BREAKOUT beziehen sich auf den kurzen Zeitraum des Marktes brechen den Bereich, CONSOLIDATION beziehen sich auf die lange Konsolidierung des Marktes und schrumpfen auf Bereich. In der Regel oszillierende Indikator führt gut in RANGE-Zustände und schlecht in Trend-Zustand, während TREND-Indikator i
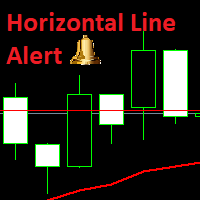
Das Hauptziel dieses Indikators ist es, Warnungen zu erhalten, wenn Ihr Unterstützungs- und Widerstandsniveau berührt wurde und die Kerze über dem Unterstützungs-/Widerstandsniveau geschlossen hat. Es handelt sich um einen recht einfachen Indikator. Sie müssen lediglich eine horizontale Linie an der Stelle platzieren, an der sich Ihr Unterstützungs-/Widerstandsniveau befindet, und jedes Mal, wenn eine Kerze dieses Niveau berührt und darüber schließt, erhalten Sie eine Warnung. Jede Linie generie

Der Trend-Slow-Indikator verwendet den Algorithmus des Autors zur Analyse des Kursverhaltens und zeigt das Ergebnis der komplexen Arbeit in Form von Linien an. Der Einfachheit halber ändert der Algorithmus automatisch die Farbe der Linie je nach ihrer Richtung.
Der Indikator verfügt über einen Parameter zur Aktivierung von Warnungen, wenn sich die Farbe ändert, und hilft so dem Händler, neue Markttrends zu erkennen.
Dieses System wird Ihnen helfen, mit hoher Wahrscheinlichkeit Trades in Richt

LordAutoTrendLine ist ein Indikator für MetaTrader, der mit der Absicht entwickelt wurde, Auf- und Abwärtstrendlinien auf dem Finanzmarkt zu analysieren.
Trendlinien werden verwendet, um zusammen mit einem Fibonnaci beispielsweise das Hoch und Tief eines Währungspaares zu berechnen.
Im Beispiel der H4-Bilder sehen wir eine Linie, die das Hoch von 1790 und das Tief von 1784 kreuzt. Ein Beispiel: Wenn ein Unterschreiten von 1784 einen Verkauf bedeutet, kann es der Linie zufolge mit großer Siche

THE SOUND OF MARKET ist ein Indikator, der entwickelt wurde, um die Geräusche zu erkennen, die bei Marktbewegungen entstehen. Dieses System erkennt die Hintergrundgeräusche, die durch Marktbewegungen in Echtzeit erzeugt werden, um in Ihrem Betrieb zu entscheiden. Außerdem können wir durch die Analyse des im Indikator aufgezeichneten Klangs operative Muster erkennen. Sie können die Demo herunterladen und sie selbst testen.
Der Indikator verfügt über eine Texthilfe in der oberen rechten Ecke, in

Kurzbeschreibung
Der TrendWatch Indikator analysiert die Trendstärke und -beschleunigung im Chart. Die Analyse basiert auf dem Schlusskurs-SMA mit konfigurierbarem Zeitraum. Das Ergebnis wird als eine Reihe von zwei Kurven im Indikatorfenster angezeigt. Die blaue Kurve (Standardfarbe) zeigt die Trendrichtung und -stärke an. Die gelbe Kurve (Standardfarbe) zeigt die Tendenz des Trends zur Beschleunigung/Verlangsamung an. Die Skalierung der Kurven ist auf den Maximalwert im gegebenen Zeitraum nor

The indicator shows the trend change and how the market is changing. When calculating, many parameters are weighed. Therefore, divergence between the chart and the indicator is possible.
Input parameters:
IndicatorPeriod: several calculation periods (small - small period, medium - medium period, long - long period).
You can trade by divergence, analyzed on the resistance and support lines (and other types of graphical analysis), as part of other indicators. Tags: Stochastic, Trend.

Indicator formula: High-Low + Volume; Open-Close + Volume That is, an attempt to bring price and volume to a common denominator.
Input parameters:
IndicatorPeriod: several periods of calculation (small-short-term; medium-medium; long-long-term).
MnojitelLine, MnpjitelLine2 - multiplication of lines for comparison.
AverageVolume - averaging volumes for calculation (needed to remove the dependence on volumes).
If both the indicator and the chart make a fast jump, then we are waiting for a ro

The indicator is a tough Moving Average, weighted by many parameters. Accordingly, you need to trade according to the volatility of the chart. For convenience, moving averages of High, Low, Median ((High-Low) / 2) periods have been added to the indicator.
Input parameters:
IndicatorPeriod (green line): several periods (general-general, calculation for all periods; small- small period; medium- medium period; long- long period)
MaLine- indicator smoothing (Moving Average) (blue line).
PeriodH

LordTrendSignal ist ein Finanzmarktindikator für Meta Trader, der Signale durch Trends und Kerzen prüft und auf allen TimeFrames (M1, M5, M15, M30, H1, H4, D1) funktioniert.
LordTrendSignal prüft die Signale anhand von Trends und Kerzen und informiert Sie per Benachrichtigung, Alerts per E-Mail und Push auf dem automatischen Bildschirm.
Die Trendflexibilität von LordTrendSignal ist hoch, aber zusammen mit anderen unserer Indikatoren LordAutoFibonacci und LordAutoTrendLine können Sie sehr gut

Folgender Trendindikator von Alina gecoacht. Dieses Produkt basiert auf RSI und Oszillator. Ein weiterer Indikator, um diese Strategie zu unterstützen, wird Ihnen kostenlos per Whatsapp gesendet. Getestet wurde dies für über 3 Jahre, über 60% Gewinnrate. Unterstützung Eur Usd, Eur JPY , Nzd Usd, Xau Usd. Aud Jpy , Aud Usd , Eur Cad , Usd Cad , Usd Chf , Gbp Usd, Aud Cad , Aud Nzd. Qualität Signale und kann für den Alltag verwendet werden.
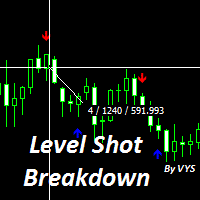
100% kein Redrawing
Sie können auf jeden Basiswert handeln.
Die günstigste Zeit für die Arbeit ist die europäische, amerikanische Session.
Wenn ein blauer Pfeil unter der Kerze erscheint, wird eine UP-Option erworben.
Wenn der rote Pfeil erscheint, wird eine DOWN-Option erworben.
Eine Besonderheit des Indikators ist zu beachten: ein Signal wird erzeugt, wenn eine Kerze geöffnet wird; es lohnt sich, ein Geschäft auf diesem Balken zu eröffnen
Auf diese Weise können Sie effektiv mit binären

MOUNTAINS: Es handelt sich um einen Indikator, der Marktkonsolidierungen vor einer Bewegung erkennt.
Das Ziel dieses Indikators ist es, die Bereiche anzuzeigen, bevor der Markt eine Bewegung macht.
Die Bereiche, die wir in der Erkennung interessiert sind, sind die PLATEAU, die zwischen den Pisten sind.
Wenn das System einen PLATEAU erkennt, muss der Händler seine Operation in diesem Bereich platzieren und darauf warten, dass der Anstieg der Volatilität sein Ziel erreicht.
Die beste Möglichke

Dieser Indikator erweitert die Möglichkeiten des üblichen ZigZag-Indikators durch die Hinzufügung von parabolischen Kanälen im frühesten Stadium ihrer Entstehung erheblich. Laden Sie die Demoversion herunter und testen Sie sie im Testprogramm. Alle Grafiken im Tester sind funktionsfähig. Aber der ZigZag-Algorithmus ist hier etwas Besonderes, weil er auf einem einzigartigen, ultraschnellen, schleifenlosen Algorithmus des Autors zur Berechnung der parabolischen Regression und zur Berechnung ihrer
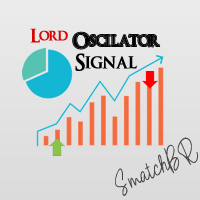
LordOscilatorSignal ist ein Finanzmarktindikator für Meta Trader, der die Standardmarktindikatoren Stochastik, Gleitender Durchschnitt, MACD, MA Xover, P.SAR verwendet.
Genau! Dieser einzige Indikator hat die Hilfe und Assistenten von (5) Indikatoren.
LordOscilatorSignal verfügt über ein grafisches Panel, das die Werte der einzelnen Indikatoren und Zeitrahmen anschaulich darstellt.
LordOscilatorSignal identifiziert durch die Trends der Kauf- und Verkaufsindikatoren, wenn alle Indikatoren kor
Pullback-Wahrscheinlichkeit Es handelt sich um einen Indikator, der uns die Wahrscheinlichkeit anzeigt, dass sich der Preis umdreht und wir diese Marktwende steuern können.
Der Indikator markiert eine Linie, die zwischen einem Prozentsatz von 0% bis 100% oszilliert.
Die in der oberen linken Ecke angezeigte Linie zeigt uns eine Hilfe an, die uns über den Bereich informiert, in dem sich der Preis in Echtzeit befindet, sowie über den Prozentsatz, zu dem die Kerze geöffnet ist. Sie können die Dem

Gleitender Durchschnitt mit Niveaus, die auf dem ATR-Indikator basieren. Im Gegensatz zu den üblichen Niveaus mit konstanter Abweichung, die dem gleitenden Durchschnitt hinzugefügt werden können, berücksichtigen die Niveaus des gleitenden Durchschnitts mit ATR-Bändern die Marktvolatilität. Die wichtigste Option bei der Verwendung des Indikators: kaufen, wenn das obere Niveau durchbrochen wird, und verkaufen, wenn das untere Niveau durchbrochen wird.
PARAMETER MA_Period : Mittelungszeitraum des
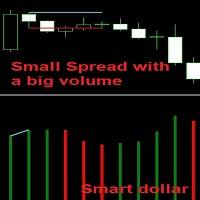
Wenn die aktuelle Kerze kleiner als die vorherige Kerze ist, aber ihr Volumen größer als das der vorherigen Kerze ist, bedeutet dies, dass der Market Maker den Trend blockiert, d.h. er ist dabei, zu kaufen oder zu verkaufen. Wenn der Kurs also über dieser Kerze schließt, kaufen wir, und wenn er unter dieser Kerze schließt, verkaufen wir ebenfalls. Beachten Sie, dass diese Kerze eine starke Zone als Widerstand oder Unterstützung wird. Der Indikator zeichnet zwei Linien auf die Divergenz-Spread-V
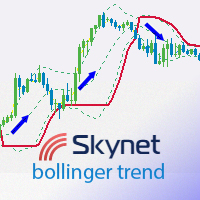
Dieser Indikator zeigt Einstiegspunkte in den Markt mithilfe von Bollinger-Bändern und Ausstiegspunkte an, die durch den angegebenen Abstand in Punkten vom Einstiegspunkt bestimmt werden. Wenn die Linie des Indikators über dem Preis liegt, handelt es sich um eine Verkaufszone für Trader, und wenn die Linie des Indikators unter dem Preis liegt, handelt es sich um einen Aufwärtstrend. Das Informationspanel zeigt die Ergebnisse des Indikators an, so dass Sie ihn genauer konfigurieren und sehen könn

ACHTUNG - LESEN SIE DIE BESCHREIBUNG! Anwendung nur auf das Währungspaar GBPUSD - H1. Dieser Indikator bestimmt täglich nach Abschluss des 13. Balkens, ob es heute einen Punkt der Stärke gibt oder nicht. Wenn er nicht da ist, wird der Indikator nichts zeichnen, dann lassen wir diesen Tag aus. Wenn das Niveau angezeigt wird, müssen Sie nur die weitere Kursbewegung beobachten. Für die Vorbestätigung des Signals ist es wichtig, dass einige Grundbedingungen an diesem Tag und maximal am nächsten Tag
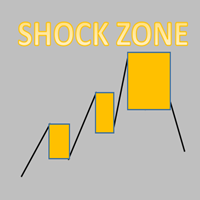
Jeder Handelsschockbereich ist ein Punkt, an dem man an Dynamik gewinnt!
Der Stop-Loss liegt in der Regel auf der Höhe der Schockzone.
Der Take Profit hängt von der persönlichen Präferenz und der Marktlage ab. In der Regel mindestens das Doppelte der Höhe der Schockzone. Bei einer guten Marktposition kann das Gewinn-Verlust-Verhältnis bei 5-10 liegen.
Notwendig für Trader: Tools und Indikatoren Wellen automatisch berechnen Indikatoren, Kanal Trend Handel Perfekte Trend-Welle automatische Be

Liefern Sie Ideen für den Trendhandel.
Automatische Berechnung und Generierung von Trendkanälen.
Die Kanallinie, auch bekannt als Pipeline-Linie, besteht darin, eine gerade Linie parallel zur Trendlinie in die entgegengesetzte Richtung der Trendlinie zu zeichnen, und die gerade Linie kreuzt den höchsten oder niedrigsten Preis der jüngsten Periode. Diese beiden Linien lassen den Kurs in der Mitte verlaufen und haben eine offensichtliche Rohr- oder Kanalform. Unverzichtbar für Trader: Tools und
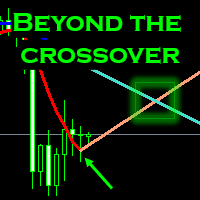
Wollen Sie den Crossover-Bewegungen zuvorkommen? Ihre Erfolgschancen erhöhen? Mit diesem Programm können die Crossovers vor ihrem Erscheinen antizipiert werden und somit einen besseren Preis erzielen. Es wurde eine MA-Linie entwickelt, die die Crossovers vorwegnimmt und auch als Unterstützungs- und Widerstandsniveau verwendet werden kann. Prüfen Sie im Backtesting und erhalten Sie die Umkehrung am Anfang. Beschreibung MA beyond the crossover ist eine Durchschnittspreisberechnung über
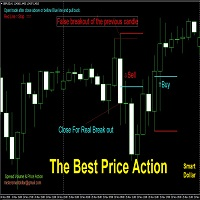
Diese Preisaktion ist eine sehr starke Strategie, sie basiert auf der Tatsache, dass der Preis einen falschen Ausbruch der vorherigen Kerze macht und auf der anderen Seite schließt. Das bedeutet, dass der Bereich des falschen Ausbruchs sehr starke Aufträge enthält, die den Preis in die andere Richtung drängen. Der Indikator hilft Ihnen bei der Auswahl des Zeitrahmens für die Preisaktion und der Mindestanzahl von Punkten für den Bereich zwischen der blauen und roten Linie. Wenn der Indikator ein
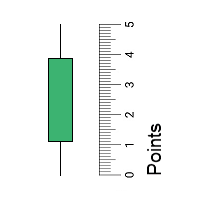
Der Indikator zeigt die High-Low- und Open-Close-Größen von Candlesticks an. Sie können auch einfache gleitende Durchschnitte mit diesen Größen darstellen. Die Linie des gleitenden Durchschnitts wird durch die folgende Formel gebildet: MA-Linie = MA(Periode) * Delta. Um den gleitenden Durchschnitt auszublenden, genügt es, seine Periode auf 0 zu setzen.
Um Statistiken über Kerzengrößen zu sammeln, verwenden Sie das Skript Kerzengrößenstatistiken .
PARAMETER Period_MA_HL: Mittelungszeitraum des

Genetic Code, ist ein Indikator, der zwei Arten von Märkten unterscheidet: den Markt in der Bandbreite und den Markt mit Volatilität.
Mit diesem Indikator kann der Händler wählen, ob er eine Handelsspanne oder einen Volatilitätshandel verwenden möchte. Sie können die Demoversion herunterladen und sie selbst testen.
Die Kursspur des Indikators zeigt uns schmale Bereiche an, die den Marktspannen entsprechen.
Diese Bereiche enden immer mit einem Volatilitätsprozess, so dass Sie mit zwei bedingt

HAWA GOLD Fortgeschrittener Handelsindikator mit realistischen, vordefinierten Ein- und Ausstiegslevels mit einer Gewinnrate von fast 80%. Das System konzentriert sich nur auf kleine und stetige Gewinne . Es verwendet einen festen Stop-Loss für jedes Signal, um das Money-Management zu gewährleisten. Im Vergleich zu anderen verfügbaren Indikatoren auf dem Markt hat HAWA Gold die einzigartige Eigenschaft, den Gesamtgewinn und -verlust in Punkten anzuzeigen, wobei 1PIP=10Punkte und der Mindestgewi

MA bounce LITE arrows ist eine vereinfachte Version des Hauptindikators MA bounce . Sie ist für Personen gedacht, die nicht alle Funktionen des Hauptindikators nutzen müssen. Die Lite-Version zeigt nur Pfeile auf dem Chart an, wenn eine hohe Wahrscheinlichkeit besteht, dass der Preis vom ausgewählten MA abprallt.
MA bounce LITE Pfeile Eingabeeinstellungen: Aktuelle MA-Periode - Periode des gleitenden Durchschnitts im aktuellen TF Aktueller MA-Typ - Berechnungsmethode des gleitenden Durchschnitt
MA bounce LITE arrows ist eine vereinfachte Version des Hauptindikators MA bounce . Sie ist für Personen gedacht, die nicht alle Funktionen des Hauptindikators nutzen müssen. Die Lite-Version zeigt nur die HTF-Linie in der kurz-/langfristigen Betriebsmethode.
MA bounce LITE htf line Eingabeeinstellungen: TD-Linienquelle für die Berechnung - wählen Sie, ob Oszillatoren oder Preisniveaus als Quelle für die Berechnung verwendet werden sollen TD line method (for oscillators source) - wählen Sie zwi

Der RealCryptoLevels-Indikator zeigt durch das Herunterladen des Orderbuchs von Kryptobörsen mit maximaler Tiefe horizontale Volumina beliebter Kryptowährungen auf dem Chart an, so dass Sie nicht nur die Volumina, sondern auch die Niveaus und ihre Stärke sehen können (siehe Screenshots), was für den erfolgreichen Handel in allen Strategien vom Scalping bis zum mittelfristigen Handel sehr wichtig ist, da Sie die Präferenzen von Käufern und Verkäufern im Moment und ihre Stimmung für die Zukunft s

DNA ist ein Indikator, der es uns erlaubt, sowohl für einen Trend als auch für einen Pullback zu arbeiten. Sie können die Demo herunterladen und sie selbst testen.
Der Trendhandel ist über Null und der Pullbackhandel ist unter Null.
Die Richtung der Operation wird durch die Farbe der Linie gekennzeichnet.
Wenn die Linie grün ist, entspricht dies Käufen.
Ist die Linie rot, handelt es sich um Verkäufe.
Liegt die grüne Linie beispielsweise über Null und wächst, handelt es sich um einen Aufwä

Dieser Indikator erstellt Balken in 4 verschiedenen Farben. Der grüne Balken bedeutet Aufwärtstrend. Der rote Balken steht für einen Abwärtstrend. Der hellgrüne Balken ist kein Trend (Korrektur oder Seitwärtsbewegung), aber immer noch im Aufwärtstrend. Der rosafarbene Balken ist kein Trend (korrigierend oder seitwärts) , befindet sich aber noch im Abwärtstrend. Sie können einfach auf die Farbe des Balkens schauen und mit einem grünen Balken für eine Long-Position und einem roten Balken für eine
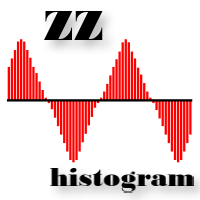
Das ZZ-Histogramm zeigt die Länge und Richtung der Welle auf dem Preisdiagramm an. Die Mindestwellengröße wird in den Einstellungen festgelegt. Im Wesentlichen handelt es sich bei diesem Indikator um denselben Zickzack-Indikator (Sie können ihn hier herunterladen), der Preiswellen von mindestens einer bestimmten Länge definiert, allerdings nur in Form eines Histogramms. Dies ist auf den Screenshots zu sehen.
Um Statistiken über die Größe der Preiswellen zu sammeln, verwenden Sie den Indikator W
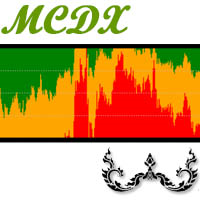
MCDX ist ein Indikator, der auf einer speziellen Formel zur Erkennung von Kauf- und Verkaufsimpulsen basiert Ein roter Balken bedeutet einen Preisanstieg und ein Kaufmomentum. Ein grüner Balken bedeutet, dass der Preis fällt und ein Verkaufsmomentum vorliegt. Die Höhe des ROTEN Balkens > 50% bedeutet, dass der Bulle die Kontrolle hat, d.h. dass der ROTE Balken mehr als der GRÜNE Balken zum Kauf anregt. Ein niedrigerer grüner Balken < 50% bedeutet, dass der Bär die Kontrolle hat, d.h. GRÜN mehr

Multicurrency und Multitimeframe Indikator des Standard Deviation Channel. Zeigt die aktuelle Richtung des Marktes an. Auf dem Panel können Sie Ausbrüche und Berührungen (durch den Preis) der Ebenen des linearen Regressionskanals sehen. In den Parametern können Sie alle gewünschten Währungen und Zeitrahmen angeben. Außerdem kann der Indikator Benachrichtigungen senden, wenn die Niveaus berührt werden. Wenn Sie auf eine Zelle klicken, werden das Symbol und der Zeitraum geöffnet. Dies ist der MTF

DNA ist ein Indikator, der es uns ermöglicht, sowohl für einen Trend als auch für einen Pullback zu arbeiten. Sie können die Demo herunterladen und sie selbst testen.
Der Trendhandel ist über Null und der Pullbackhandel ist unter Null.
Die Richtung der Operation wird durch die Farbe der Linie gekennzeichnet.
Wenn die Linie grün ist, entspricht dies Käufen.
Ist die Linie rot, handelt es sich um Verkäufe.
Liegt die grüne Linie beispielsweise über Null und wächst, handelt es sich um einen Au

Dieser Indikator findet Marktsituationen des Typs "false breakout", "complex false breakout" und "level breakout".
Einstellungen
SettingListMarket - In diesem Bereich kann die Liste der Handelsinstrumente und Filter flexibel angepasst werden.
. ListOrMarketOverview - Wenn false, wird die Liste der Instrumente aus List_1...List_5 verwendet, wenn true, Instrumente aus der Marktübersicht. Forex - nimmt Forex-Instrumente in die Liste auf. CFD - schließt CFD-Instrumente in die Liste ein. Futures - s

TD Combo ist besser geeignet, wenn Sie starke Richtungsbewegungen haben, da es nur dreizehn Kursbalken von Anfang bis Ende benötigt, verglichen mit TD Sequential, das mindestens 22 Balken benötigt. Die Kriterien für ein Setup innerhalb von TD Combo sind die gleichen wie die für ein Setup innerhalb von TD Sequential. Der Unterschied besteht darin, dass die Zählung bei Takt 1 des Setups und nicht bei Takt 9 beginnt und dass bei TD Combo vier Bedingungen gleichzeitig erfüllt sein müssen.
Vorausse

Der Indikator sucht nach TD Combo Signalen in mehreren Zeitrahmen für alle gefilterten Märkte und zeigt die Ergebnisse auf dem Dashboard an. Hauptmerkmale Das Dashboard kann für alle Märkte verwendet werden Es kann nach Signalen in den Zeitrahmen MN1, W1, D1, H4, H1, M30, M15, M5, M1 suchen Parameter Marktbeobachtung verwenden: Setzen Sie true, um alle im MarketWatch verfügbaren Symbole zu kopieren MarketWatchCount : Legen Sie die Anzahl der Symbole fest, die Sie aus der Marktbeobachtungsliste

Der TD Sequential Indikator besteht aus zwei Komponenten. TD Setup ist die erste und ist eine Voraussetzung für den TD Countdown - die zweite Komponente.
TD Setup TD Setup vergleicht den aktuellen Schlusskurs mit dem entsprechenden Schlusskurs vier Takte zuvor. Es muss neun aufeinanderfolgende Schlusskurse geben, die höher/niedriger sind als der Schlusskurs vier Balken zuvor.
1- TD Buy Setup - Voraussetzung ist eine bärische Preisumkehr, die einen Wechsel von einem positiven zu einem negativen

Der Indikator sucht nach TD Sequential Signalen in mehreren Zeitrahmen für alle gefilterten Märkte und zeigt die Ergebnisse auf dem Dashboard an. Hauptmerkmale Das Dashboard kann für alle Märkte verwendet werden Es kann nach Signalen in den Zeitrahmen MN1, W1, D1, H4, H1, M30, M15, M5 und M1 suchen. Parameter Marktbeobachtung verwenden: Setzen Sie true, um alle im MarketWatch verfügbaren Symbole zu kopieren MarketWatchCount : Legen Sie die Anzahl der Symbole fest, die Sie aus der Marktbeobachtu

Der PinTouch-Indikator berechnet und zeichnet mit hoher Wahrscheinlichkeit Einstiegspunkte mit Pfeilen ein. Gleitende Durchschnitte werden als Richtungsfilter verwendet und im Chart visualisiert.
Zur Identifizierung von Ausstiegspunkten wird empfohlen, eine der folgenden Optionen zu verwenden:
1. Die nächstgelegenen Levels, die vom PivoZone Indikator unter dem Link https://www.mql5.com/en/market/product/57066 berechnet werden
2. Umkehrsignal
3. Berechnet durch RR-Ratio 4. Natürlich, Ihre Optione

Der multifunktionale Level-Indikator IRES ist ein leistungsstarkes professionelles Werkzeug zur Bestimmung von Unterstützungs- und Widerstandsniveaus eines Finanzinstruments. Die Effizienz des Indikators ist durch Tausende von Tests auf realen und Demo-Konten bewiesen. Indikator, der auf realen Daten mit realen Live-Statistiken arbeitet.
Indikator wird helfen, Netzwerke oder einzelne Aufträge zu handeln, gibt es eine Warnung, können Sie die Einstellungen des Indikators unter sich selbst wählen,

Indikator der durch push mobile Benachrichtigung oder durch Chartwarnung vor der Berührung einer Kerze mit der ausgewählten Moving Average warnt. Die Alarm kann so eingestellt werden, dass sie "x" Sekunden vor dem Schließen der Kerze aktiviert wird. Besonders geeignet für diejenigen, die nicht viel Zeit vor den Bildschirmen verbringen können oder wollen, um zu sehen, wie eine Bewegung von eine Moving Average ausgeht und daher den Trend verpasst. Sie können jede Moving Average typ benuten und die
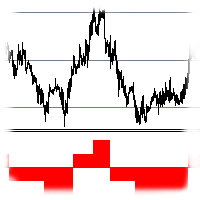
Der Indikator zeigt die Anzahl und Richtung der Preisübergänge zwischen den Rasterstufen an. Der Rasterschritt wird in den Einstellungen festgelegt. Der Indikator ist besonders für Martingale-Händler nützlich, um den optimalen Einstiegspunkt zu bestimmen.
PARAMETER Step: Rasterschrittweite (zum Beispiel: Step = 50, Shift = 0, dann haben die Levels die Werte ...1.1050, 1.1100, 1.1150...). Verschiebung: Gitterverschiebung (zum Beispiel: Schritt = 50, Verschiebung = 25, dann haben die Ebenen die
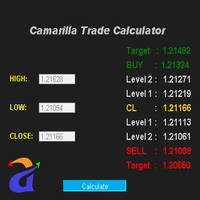
Der erweiterte Camarilla-Rechner ist einer der am häufigsten verwendeten Handelsrechner. Dieser Rechner kann zur Erstellung von Levels verwendet werden. Szenario 1 Der Eröffnungskurs liegt zwischen H3 und L3 Für Long - Warten Sie, bis der Kurs unter L3 fällt, und kaufen Sie dann, wenn er wieder über L3 steigt. Der Stop-Loss wird gesetzt, wenn der Kurs unter L4 fällt. Ziel1 - H1, Ziel2 - H2, Ziel3 - H3 Für Short - Warten Sie, bis der Kurs über H3 steigt, und verkaufen Sie, wenn der Kurs wieder un
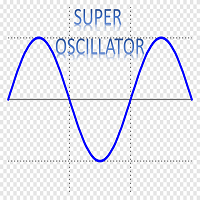
Super Oscillator ist ein leistungsfähiger Indikator, der mit dem Markt mitschwingt und somit ein sehr nützliches Instrument zur Verbesserung und Entscheidung Ihres Handels darstellt.
Sie können die Demo herunterladen und testen Sie es selbst.
In einem vielseitigen Indikator, der in einem einzigen Diagramm zeigt uns Informationen über vier verschiedene Aspekte des Marktes
1) 4 operative Zonen. Der Indikator unterteilt den Bildschirm in 4 Zonen, die uns erlauben, den Moment des Marktes richtig
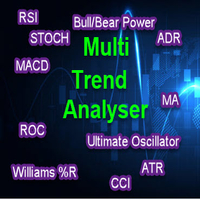
Der Multi Trend Analyzer MT4-Indikator liefert Signale von folgenden technischen Handelsindikatoren: RSI, STOCH, STOCHRSI, MACD, ADX, Williams % R, ATR, Oszillator, ROC und Bull/Bear Power. Es unterstützt alle Zeitrahmen, von der 1-Minuten- bis zur Monatsübersicht. Sie können alle Indikatoreingaben ändern. Der Indikator bietet eine vollständige Trendzusammenfassung. Wir können leicht analysieren und studieren Marktbewegung.
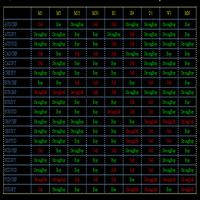
MACD MULTI TIME FRAME WITH MULTI SYMBOLS INDICATOR Der MACD MTF Indikator visualisiert alle MT4 Zeitrahmen und Trends basierend auf der Moving Average Convergence Divergence (MACD) Strategie. Der Indikator hat Einstellungen für die MACD-Anpassung und die Variable "Symbole "EURUSD,USDCHG,...", die verwendet wird, um Symbole zu definieren. Signale werden angezeigt Buy , Strong buy , Sell, Strong Sell, ### - No Trend Strong Beschreibung Der Moving Average Convergence/Divergence-Indikator ist ein Mo
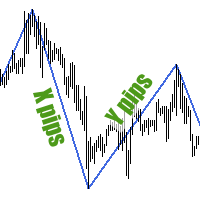
Zigzag wird durch Preiswellen gebildet, deren Größe nicht geringer ist als die in den Einstellungen festgelegte Größe. Der Indikator ist nicht in der Lage, zwei Tops (Maximum und Minimum) auf einer Kerze zu zeichnen, daher sollten Sie kleinere Zeitrahmen des Charts verwenden, um die Wellen kleinerer Größe zu bestimmen. Sie können das Zickzack als Histogramm hier herunterladen.
Um Statistiken über die Größe der Preiswellen zu sammeln, verwenden Sie den Indikator Wave Size Stats .
PARAMETER Min

Super Trend Filter Indikator Supertrendpfeil als Masterkerze betrachten, wenn Supertrend im Kaufsignal, dann Signalkerze als Masterkerze berechnen und Master-Kerze schließen oberhalb der offenen Kerze dann Filter Buy Arrow berechnen. Wenn Super-Trend in Sell Signal , dann Signal Kerze berechnen Master Kerze und Master-Kerze schließen unterhalb der offenen Kerze berechnen Filter Sell Arrow. 3 Ziel mit Trailing Stop Loss
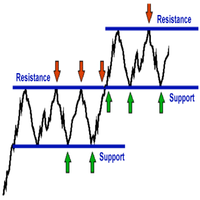
Sind Sie es leid, bei der Multi-Timeframe-Analyse Unterstützungs- und Widerstandsniveaus für alle Charts desselben Symbols zu zeichnen? Nun, wenn Sie ein Price Action Trader sind, dann wird dieser Indikator Ihr Problem lösen. Zeichnen Sie auf einem Zeitrahmen und es wird automatisch mit anderen Charts desselben Symbols synchronisiert. Sie können Rechtecke, Linien und Eklipse zeichnen. Er gibt eine Warnung aus, wenn er eine Linie berührt oder durchbricht. Er funktioniert auf allen Timeframes .
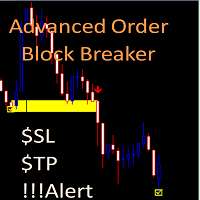
Advanced Order Block Breaker Der Preis wurde von 65$ Rabatt auf 35$ reduziert!!!
Dashboard: Kostenloser Scanner zur Überwachung aller Paare und Zeitrahmen hier: https: //www.mql5.com/en/market/product/59151 MT5 Version Indikator: https: //www.mql5.com/en/market/product/62769 Marktstruktur ändert sich bei Preisumkehr Und Filter mit allen Import-Funktionen in einem Tool integriert. Der intelligente Algorithmus von Breaker erkennt die Umkehrungen, filtert Marktgeräusche heraus und gibt Einstiegss
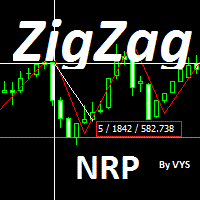
Zickzack-Indikator mit entferntem Redrawing eröffnet ein Geschäft Steht, wenn der Kurs die Zickzacklinie kreuzt Wenn der Kurs die Linie von unten nach oben kreuzt die Linie von unten nach oben, dann ist dies ein Kaufsignal Wenn der Preis die Linie von oben nach unten kreuzt, dann ist dies ein von oben nach unten, dann ist dies ein Verkaufssignal Stoploss wird an der Biegung der Linie gesetzt Ausstieg aus dem Geschäft durch das entgegengesetzte Signal oder Gewinnmitnahme
Der Indikator Zigzag nrp

Cloud Stair ist ein Indikator mit 2 Wolken (Aufwärtstrend und Abwärtstrend). Die Wolke wird rot, wenn der Trend nach unten geht. Die Wolke wird blau, wenn der Trend nach oben geht. Sie können diesen Indikator als Unterstützungs- und Widerstandsniveau verwenden. Der Trend ist sehr stark, wenn es keine Gegenseite gibt. Eröffnen Sie eine Kaufposition, wenn der Indikator eine blaue Wolke und keine rote Wolke anzeigt. Eröffnen Sie eine Verkaufsposition, wenn der Indikator eine rote Wolke und keine b
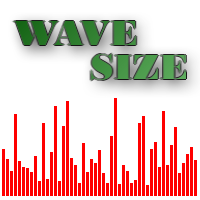
Das Histogramm zeigt die Länge der Preiswellen an, die nicht kleiner als die angegebene Größe sind. Der Indikator zeigt deutlich die Richtung der kurzen/langen Kursbewegungen und die Volatilitätsdynamik. Das Wellengrößen-Histogramm eignet sich auch für die Suche nach Mustern in den Kursbewegungen. Beispielsweise folgt auf eine große Welle (großer Histogrammwert) oft eine schwache Kursbewegung in die Gegenrichtung (kleiner Histogrammwert), was sich ideal für den Martingale-Handel eignet.
Verwend
Der MetaTrader Market ist die beste Plattform für den Verkauf von Handelsroboter und technischen Indikatoren.
Sie brauchen nur ein gefragtes Programm für die MetaTrader Plattform schreiben und schön gestalten sowie eine Beschreibung hinzufügen. Wir helfen Ihnen, das Produkt im Market Service zu veröffentlichen, wo Millionen von MetaTrader Benutzern es kaufen können. Konzentrieren Sie sich auf dem Wesentlichen - schreiben Sie Programme für Autotrading.
Sie verpassen Handelsmöglichkeiten:
- Freie Handelsapplikationen
- Über 8.000 Signale zum Kopieren
- Wirtschaftsnachrichten für die Lage an den Finanzmärkte
Registrierung
Einloggen
Wenn Sie kein Benutzerkonto haben, registrieren Sie sich
Erlauben Sie die Verwendung von Cookies, um sich auf der Website MQL5.com anzumelden.
Bitte aktivieren Sie die notwendige Einstellung in Ihrem Browser, da Sie sich sonst nicht einloggen können.