Technische Indikatoren für den MetaTrader 4 - 98

Reversal Prices ist ein Indikator, der über einen ziemlich leistungsfähigen und effektiven Mechanismus zur Anpassung an veränderte Marktbedingungen verfügt. Reversal Prices - das neue Wort in der Trenderkennung! Mit der Entwicklung der Informationstechnologie und einer großen Zahl von Marktteilnehmern lassen sich die Finanzmärkte immer weniger mit veralteten Indikatoren analysieren. Konventionelle technische Analyseinstrumente wie der gleitende Durchschnitt oder die Stochastik sind in ihrer rein

Der neue führende Trendindikator Analytical Concentration verwendet adaptives Anti-Aliasing. Er ermöglicht es Ihnen, frühzeitig in den Markt einzusteigen. Indikator für eine scharfe Wende zu einem dynamischen Richtungswechsel. Der Indikator Analytical Concentration gibt dem Händler die Möglichkeit, visuell zu bestimmen, welcher Trend in einem bestimmten Zeitintervall vorhanden sein wird. Ein Indikator, der über einen ausreichend leistungsfähigen und effektiven Mechanismus zur Anpassung an sich

Die Nine Turns Sequence, abgeleitet von der TD Sequence, ist benannt nach den 9-Tage-Schlusskurs-Forschungskriterien der TD Sequence. Tom DeMark (Tom DeMark) technische Analyse der weltberühmten Meisterklasse Figur, erstellt, um seine Initialen namens TD-Serie von vielen Indikatoren, Preisumkehr dieses Indikators ist einer der wichtigsten, das heißt, die TD-Sequenz. Die ursprüngliche TD-Reihe ist etwas komplizierter, wenn Sie sie also studieren wollen, können Sie die Informationen über die TD-Re

Der Marktpreis fällt normalerweise zwischen die Grenzen des Kanals.
Liegt der Kurs außerhalb der Spanne, ist dies ein Handelssignal oder eine Handelsmöglichkeit.
Grundsätzlich kann der Fit-Kanal dazu verwendet werden, überkaufte und überverkaufte Bedingungen auf dem Markt zu bestimmen. Wenn der Marktpreis nahe an der oberen Grenze liegt, gilt der Markt als überkauft (Verkaufszone). Umgekehrt gilt der Markt als überverkauft (Kaufzone), wenn sich der Marktpreis in der Nähe des unteren Bereichs

Eine persönliche Implementierung von Order Blocks, einer einfachen, aber effektiven Positionshandelsstrategie. Der Trader sollte in den Markt einsteigen oder nach Trades in Richtung des letzten Orderblocks suchen, wenn die Preisspanne nicht in die entgegengesetzte Richtung des Ausbruchs durchbrochen wurde. Offene Blöcke sind aus Gründen der Übersichtlichkeit nicht gezeichnet.
[ Installationsanleitung | Update-Anleitung | Fehlerbehebung | FAQ | Alle Produkte ] Ein zinsbullischer offener Block is
Beschreibung des Produkts 4xZeovo ist ein leistungsfähiges Handelsindikator-System, das 24/7 die Finanzmärkte überwacht. Metatrader4 Tool entwickelt, um die besten Kauf / Verkauf Chancen zu finden und benachrichtigt den Benutzer . Es macht den Händlern das Leben leicht, indem es ihnen bei den zwei schwierigsten Entscheidungen hilft, indem es fortschrittliche, innovative Handelsindikatoren verwendet, die den Benutzer dazu ermutigen, die Gewinnpositionen zu halten und den Gewinn zu den besten Zei

Das Swing-Fortsetzungsmuster tritt in einer Trendrichtung nach einem kurzen Umschwung / Pullback auf. Wie der Name schon sagt, treten diese Muster entlang der Swing-Hochs und Swing-Tiefs eines Trends auf, was die Muster zu sehr risikoarmen Mustern mit potenziell hohen Gewinnen macht. Der Swing-Fortsetzungsindikator kombiniert auch den Currency Meter als Filter für seine Ausführung. Die Idee ist, sowohl mit dem Preis Trend Flow und Währung Trend Flow zu gehen. Das bedeutet, dass die Preisbewegung
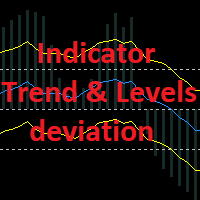
Wachstums- und Trendumkehrindikator. Er wird im Balkenberechnungsmodus nicht neu gezeichnet und kann im Tickberechnungsmodus am 0. Balken neu gezeichnet werden. Die Trendlinie und die Niveaulinien mit ihren eigenen Einstellungen werden separat berechnet. Es gibt 2 Arten von Pfeilen - für den Schnittpunkt von Trendlinien und den umgekehrten Schnittpunkt von Trendlinien (Reversal). Die Pfeile sind gepuffert und Sie können Signale an den Expert Advisor ausgeben. Die Pfeile können mit einem Tonsigna
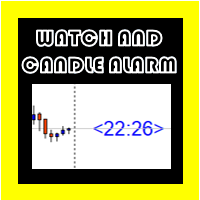
Osw Uhr für METATRADER 4
Dies ist ein Indikator, der die verbleibende Zeit bis zum Ablauf der aktuellen Kerze auf einer Uhr anzeigt. Diese befindet sich immer neben der letzten Kerze nach dem Preis. Die Zahlen werden wie auf den Bildern angezeigt und können in beiden Größen geändert werden und Farbe.
Zwischen Ihren Einstellungen können Sie Folgendes einstellen:
die Größe der Zahlen, die die Zeit anzeigen.
die Farbe der Zahlen, die die Zeit anzeigen.
Innerhalb der Konfiguration können Sie a
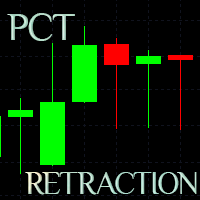
Dieser Indikator wurde zur Unterstützung von Retracement-Operationen bei binären Optionen entwickelt und zeigt die Vermögenswerte mit den besten Retracement-Prozentsätzen an!
Wie er funktioniert: Der Indikator berechnet die Gesamtlänge jeder Kerze vom Tiefststand bis zum Höchststand, die Summe des Körpers und die Summe der Schatten (nach oben und unten) und berechnet einen Gesamtschattenprozentsatz verschiedener konfigurierbarer Vermögenswerte. Der Zähler wird mit jeder neuen Kerze aktualisiert

Dies ist ein professioneller Trend Sim Indikator. Der intelligente Algorithmus des Trend-Sim-Indikators erkennt den Trend genau, filtert Marktgeräusche heraus und generiert Eingangssignale und Ausstiegsniveaus. Funktionen mit fortschrittlichen statistischen Berechnungsregeln verbessern die Gesamtleistung des Indikators.
Der Indikator zeigt Signale in einer einfachen und zugänglichen Form in Form von Pfeilen an (wann zu kaufen und wann zu verkaufen). Für jeden Devisenhändler ist es sehr wichtig

Smart Channel ist ein nicht-rotierender Kanalindikator, der auf gleitenden Durchschnitten basiert. Der Indikator wird verwendet, um Trends auf den Finanzmärkten zu erkennen und zeigt die Richtung der Preisbewegung an.
Smart Channel ist in der Tat eine Miniatur-Handelsstrategie, da er unabhängig von den Konstruktionsmethoden die Taktik des Abprallens von den Grenzen des gebildeten Kanals anwendet und die Grenzen selbst als Leitlinien für die korrekte Platzierung von Stop-Loss- und Take-Profit-O

Der Trendlinien-Indikator zeigt die potenzielle Trendrichtung auf der Grundlage der Zyklus-Wellen-Abhängigkeit an. Die Trendlinie kann als Richtung der potenziellen Marktbewegung verwendet werden.
So werden alle Strahlen des Schnittpunkts optimale Strahlen in der Richtung sein, in die sich der Preis voraussichtlich bewegen wird, unter Berücksichtigung der Indikatorperiode. Aber vergessen Sie nicht, dass der Ansatz muss komplex sein, die Indikatorsignale erfordern zusätzliche Informationen, um

Der Supernatural-Kanal wird mit einem speziellen Algorithmus bestimmt, wobei Markierungspunkte verwendet werden, um die Bewegung des Kanals zu bestimmen. Der Supernatural-Kanal besteht aus zwei Linien, rot und blau, die den Kanal bilden. Einfacher, visueller und effizienter Einsatz. Kann für den Intra-Channel-Handel verwendet werden. Der Indikator wird nicht neu gezeichnet und hinkt nicht hinterher. Funktioniert bei allen Währungspaaren und in allen Zeitrahmen.

Der Generic Trend Indikator ist ein Trendindikator. Er glättet Kursschwankungen bei der Erzeugung eines Signals, indem er die Daten und das Signal nur zu bestimmten Zeitpunkten mittelt! In jenen Momenten, in denen Sie eine Entscheidung treffen müssen, um eine Position einzugehen und dem Händler eine Richtung zu geben. Der Indikator gibt dem Händler die Möglichkeit, visuell zu bestimmen, welcher Trend in einem bestimmten Zeitintervall vorhanden sein wird.
Dieser Indikator wurde entwickelt, um d

Die Oszillator-Trend-Indikatoren sind sehr nützlich, um einen Trendabfall zu erkennen. Niemand hat die Divergenz ausgehebelt. Die richtige Nutzung dieses Signals verschafft Ihnen einen gewissen Vorsprung auf dem Markt. Bei der Arbeit im Flat. Das Funktionsprinzip des Oszillators beruht auf der Messung von Schwankungen. Der Indikator versucht, das Maximum oder Minimum des nächsten Schwungs zu bestimmen - einen Ausstieg aus den überkauften und überverkauften Zonen. Vergessen Sie nicht, dass diese

MT4 Multi-Timeframe-Divergenz- und Overbougt / Oversold-Erkennungsanzeige.
Eigenschaften
- Vollständig anpassbar auf dem Diagrammbedienfeld, bietet vollständige Interaktion.
- Verstecken und zeigen Sie das Bedienfeld, wo immer Sie möchten.
- Echtzeitinformationen zu nicht kapitalisierten Abweichungen.
- Echtzeitinformationen über überkaufte / überverkaufte Situationen.
- Echtzeitinformationen über regelmäßige Abweichungen.
- Echtzeitinformationen zu versteckten Abweichungen.
- Für die
THEQ HAG Indicator. - Der THEQ HAG-Indikator verfügt über einen mathematischen Algorithmus zur Gewinnmaximierung und Verlustminimierung, der Signale anzeigt. - Mit dem Trend mit Signalen handeln und Gewinnwarnsignale mitnehmen. - Dieser Indikator berechnet niemals neu, malt neu, malt neu oder verzögert sich, nachdem der Balken geschlossen wurde. - Alle Zeitrahmen und Währungspaare.

Dieser Indikator verwendet Unterstützung und Widerstand, Volumen und einige spezielle Formel, um das Volumen zu berechnen, um die Kerzen zu filtern. Wenn das Volumen einen bestimmten Wert erreicht, Und zur gleichen Zeit, Kerze bricht die Unterstützung/Widerstand-Linie, Es wäre ein Signal und wir können den Markt betreten. Die Signale erscheinen, wenn die aktuelle Kerze geschlossen wird. Sie können dann in den Handel einsteigen, wenn eine neue Kerze erscheint. Bitte vergessen Sie nicht, Ihren Gel
Der Signalindikator OHNE REDRAWING gibt Empfehlungen für die Richtung des Handels.
Wenn sich der Kurs durch den internen Kanal bewegt, gibt er Signale (rote und blaue Pfeile), die eine mögliche Änderung der Richtung der Kursbewegung nach oben oder unten empfehlen.
Wenn der Kurs den externen Kanal durchquert, gibt er Signale (gelbe Pfeile), die darauf hinweisen, dass eine starke Kursbewegung möglich ist, die die Handelsrichtung nicht sofort ändern wird. Wenn der Kurs den Durchschnitt überschre

Der Stufen-Kraftindex ist eine modifizierte Version des bekannten Kraftindex-Indikators. Wie der Name schon sagt, enthält er eine Stufenfunktion, um die Kraftindexwerte zu filtern und so kleine Schwankungen im Indikator zu eliminieren. Er nutzt auch die Bibliothek des Smooth-Algorithmus und bietet dadurch mehrere Glättungsoptionen für die Indexwerte. Diese persönliche Implementierung macht ihn zu einem einfach zu bedienenden und zuverlässigen Werkzeug. Wichtigste Merkmale Eine breite Palette von
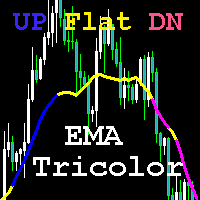
Der Indikator vergleicht mit der Difer-Konstante die ClosePrice-Differenz zwischen dem Offset-Punkt Point1 und Bar1 (dem letzten geschlossenen Balken). Wenn der Wert positiv ist und Difer überschreitet, wird die blaue Linie gezeichnet, die dem Aufwärtstrend entspricht. Wenn der Wert negativ ist und Difer überschreitet, wird die magentafarbene Linie gezeichnet, die dem DN-Trend entspricht. Das Fehlen eines Trends (flach) wird durch die Farbe Gelb angezeigt. Sie können auch handeln, indem Sie
Eine der erfolgreichsten Strategien auf dem Forex-, Stock- und Metallmarkt ist das Rechteckmuster. Ein schwer zu findendes Muster in mehreren Zeitrahmen, aber, Wir haben es so sehr einfach für Sie. Sie können diesen Indikator in verschiedenen Währungspaaren mit verschiedenen Zeitrahmen einschalten und den Alarm auf Ihrem Computer oder Mobiltelefon einstellen. Die Arbeit mit dieser Strategie ist einfach und macht Spaß. Telegramm: https: //t.me/triangleexpert Instagram: https://www.instagram.com/

Indikator für Fraktale mit einstellbaren Einrückungen. Entworfen nach einem ursprünglichen vereinfachten Algorithmus für den Einsatz in EA.
Die wichtigsten in den Indikator sind Linien, die die Ebenen der aktuellen Fraktale, die Sie die Werte des letzten Fraktal in einer Operation zu lesen erlaubt.
Er arbeitet auf einem geschlossenen Balken, so dass er nicht neu gezeichnet wird und das Terminal nicht mit Berechnungen belastet.
Es sollte klar sein, dass der Indikator mit der Erkennung des Fra

Dieser Indikator zeichnet die vorherigen Höchst- und Tiefstwerte für mehrere Zeitrahmen auf und kann potenzielle Take-Profit- und Stop-Loss-Niveaus anzeigen. Im Sinne von Rob Smiths #The Strat sind dies potenzielle Einstiegspunkte oder alternativ potenzielle Ziele für offene Positionen. Ich verwende sie gerne auf beide Arten. Auf einem niedrigeren Zeitrahmen, z. B. 5 Minuten, um einen guten Einstieg auf Tages- oder Wochenebene zu erhalten, und dann als potenzielles Ziel. Es sind sehr kleine Stop
Der Fúria-Indikator wurde entwickelt, um zu funktionieren, wenn sich der Markt im Trend befindet, d.h. Sie werden nur selten Anzeichen von Konsolidierungszonen sehen. Er kann sowohl für Forex als auch für Binäre Optionen verwendet werden.
Die Zeichen auf dem Diagramm werden nicht neu gezeichnet oder neu berechnet, auch wenn Sie Ihren MT4 / MT5 schließen und wieder öffnen, bleiben sie erhalten.
Warten Sie, bis sich das Signal auf der Kerze gesetzt hat, bevor Sie die nächste Kerze eingeben könn

Prosecution ist ein Forex-Pfeilindikator, der den Markttrend verfolgt und dabei starke Marktschwankungen und Rauschen um den Durchschnittspreis herum ignoriert. Der Indikator wird auf der Grundlage eines speziellen Algorithmus erstellt, und basierend auf dem entwickelten Algorithmus werden Signale erstellt, die es Ihnen ermöglichen, den Trend zu verfolgen und seinen Anfang und sein Ende zu sehen, insbesondere wenn mehrere Zeitrahmen kombiniert werden, um das Signal zu verfeinern. Die Pfeile zeig

Free scanner available here: https://abiroid.com/product/abiroid-ema-scalper
Grundlegende Strategie: 1: MA Crossover Pfeil nach oben/unten (obligatorische Prüfung) Optionale Überprüfungen: 2: Wenn NRTR Check On (Optional): Für BUY: Prüfen, ob NRTR blau und für SELL: NRTR rot Wenn NRTR Shadow Distance On (Optional): Prüfen Sie den Preis für 'x' Bars zurück: im Schattenabstand (ATR-Multiplikatorabstand) von der NRTR-Linie. 3: Falls hohes Volumen: Ein: Prüfen Sie, ob High Volume oder Medium (fall
Neue Serie von Veles Dynamic-Indikatoren. Die Indikatoren zeichnen ihre Werte nicht neu auf.
Diese Indikatoren arbeiten schneller und genauer als ähnliche Indikatoren.
Der Indikator Veles_dMA_Plus ist ein dynamischer MA, der anhand der aktuellen Preise des Instruments berechnet wird.
Es besteht die Möglichkeit der dynamischen Linienglättung. Es besteht die Möglichkeit, den aktuellen Trendkanal mit der Änderung seiner Volatilität anzuzeigen.
Parameter : Periode - Periode des dynamischen MA Pre
Neue Serie von Indikatoren Veles Dynamic. Die Indikatoren zeichnen ihre Werte nicht neu.
Diese Indikatoren sind schneller und genauer als ähnliche Indikatoren mit Namen.
Der Indikator Veles_dMACD ist die Differenz zwischen den Messwerten von zwei dynamischen MA, die zu den aktuellen Preisen des Instruments berechnet werden.
Er zeigt die Umkehrmomente gut an und erlaubt Ihnen, Divergenzen genau zu bestimmen. Er hat eine farbliche Begleitung der wechselnden Messwerte.
Parameter : period_Fast -
Neue Serie von Indikatoren Veles Dynamic. Die Indikatoren zeichnen ihre Werte nicht neu.
Diese Indikatoren arbeiten schneller und genauer als ähnliche Indikatoren dem Namen nach.
Der Indikator Veles_dChannel ist ein dynamischer MA mit einem berechneten Kanal zu aktuellen Instrumentenpreisen.
Der Indikator zeigt eine vollständig abgeschlossene Bewegung im Zyklus.
Dieser Indikator kann als Einstellung und Trailing Stops beim Scalping verwendet werden.
Parameter : Periode - Periode des dynamis
Neue Reihe von Indikatoren Veles Dynamic. Indikatoren nicht neu zeichnen ihre Werte.
Diese Indikatoren sind schneller und genauer als ähnliche Indikatoren mit dem Namen.
Veles_dTrend Indikator ist ein Histogramm auf der Grundlage von mehreren dynamischen Algorithmen berechnet,
mit den aktuellen Preisen des Instruments.
Solange der Indikator keine Trendänderung anzeigt, können Sie sicher sein, dass der Trend seine Richtung beibehält.
Darüber hinaus gibt es Entscheidungszonen, die durch Niveau

Dieser einzigartige Indikator für das automatische Zeichnen von Trendlinien funktioniert in allen Zeitrahmen und kann Ihnen dabei helfen, kurzfristige Trendumkehrungen sowie kurzfristige Trendausbrüche, die auf das stärkere Kapital auf dem Markt hinweisen, problemlos zu handeln. Es ermöglicht Ihnen auf einzigartige Weise, für schwere Schaukeln FRÜH einzusteigen. Eingaben umfassen:
- Max Candles blicken zurück auf Trendlinien
- Linientyp und Farbe
- Maximaler Abstand zum Außenband und Bandperiod

Trendindikator, der auf einer Kombination von gleitenden Durchschnitten basiert.
Symbole : BTCUSD, GBJPJPY, GOLD, GBPUSD Zeitrahmen M5-H4
Der Hauptvorteil: ein zusätzlicher Algorithmus zur Auto-Optimierung. Der Indikator kann seine Parameter für jedes Finanzinstrument und jeden Zeitrahmen anpassen.
Während der Auto-Optimierung berechnet der Indikator zehntausende von Kombinationen und findet diejenige, die die beste Serie von profitablen Trades ergibt. Die besten Parameter sind standardmäß

Ein Indikator für BUYs nur, es ist gut für den Handel in den Krypto-Markt und Indizes oder Aktien, für spot-Händler (non-leverage / 1-1) es ist gut zu kaufen und halten für langfristige und Sie können auch verwenden, um scalp auf kleineren Zeitrahmen, wenn Sie ein Kaufsignal auf höheren Zeitrahmen erhalten, Im Grunde suchen Sie nach Käufen auf kleineren Zeitrahmen dann, es hängt rein davon ab, wie Sie Ihren Handel, einige Leute würden ein Top-Down-Ansatz, bevor sie einen Handel, und für gehebelt

VR Cub ist ein Indikator für den Erhalt hochwertiger Einstiegspunkte. Der Indikator wurde entwickelt, um mathematische Berechnungen zu erleichtern und die Suche nach Einstiegspunkten in eine Position zu vereinfachen. Die Handelsstrategie, für die der Indikator geschrieben wurde, hat sich seit vielen Jahren bewährt. Ihr großer Vorteil liegt in der Einfachheit der Handelsstrategie, die es auch unerfahrenen Händlern ermöglicht, erfolgreich damit zu handeln. VR Cub berechnet Positionseröffnungspunkt
Das ultimative Armaturenbrett Neujahrsangebot - sparen Sie $20 (Normalpreis $79)
Indikatoren sind nützlich für Trader, aber wenn man sie in ein Dashboard einbindet, das 28 Symbole auf einmal scannen kann, werden sie noch besser, und wenn Sie auch noch verschiedene Indikatoren und Zeitrahmen kombinieren können, um Ihnen synchronisierte Alarme zu geben, dann werden sie fantastisch. Dieses einfach zu bedienende Dashboard bietet Ihnen 23 führende Indikatoren, die Sie einzeln oder zusammen verwende
Dies sind ideale Einstiegspunkte für Qualität Das Tool ist recht einfach einzurichten und zu verwenden. Die besten Optionen sind standardmäßig eingestellt Das Tool wurde für den Forex-Markt entwickelt (es wurde auch beschlossen, es mit binären Optionen zu testen, und es gibt auch ein gutes Ergebnis) Das Tool ist sowohl für Anfänger als auch für erfahrene Trader geeignet und wird eine großartige Ergänzung zu Ihrem Handelssystem sein oder die Grundlage dafür bilden Die Einstellungen sind nur ein P
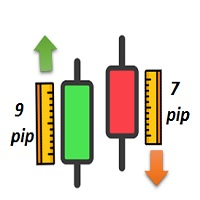
- Indikator für Kerzenlänge/-richtung - Zeigt die Länge/Richtung der Kerzen an: Sie können eine der beiden Formeln wählen, um die Länge/Richtung der Kerzen in allen Zeitrahmen zu ermitteln : 1- Öffnen - Schließen 2- Hoch - Tief -Zeigt die Länge der Kerzen an: Sie erhalten eine Tabelle, die die Länge der Kerze Ihrer Wahl in allen Zeitrahmen (in Punkten) anzeigt. -Zeigt die Richtung der Kerzen an: Die Farbe zeigt an, ob eine Kerze bullish (mit positiven Punkten) oder bearish (mit negativen Punkten
Dies ist ein Tool für den Handel mit binären Optionen und Forex. Vorteile Kein erneutes Zeichnen Genaue gute Signale Kann mit Unterstützungs- und Begleitungsniveaus verwendet werden, das Ergebnis ist eine gute Strategie Es kann jede Strategie ergänzen, da es die Marktumkehr perfekt bestimmt Mit Nachteilen Es gibt unrentable Trades Parameter Die besten Einstellungen sind standardmäßig eingestellt Es gibt alle Warnungen, die Sie brauchen, um bequem mit dem Instrument zu arbeiten ...

Das perfekte Werkzeug für Scalng in den Forex-Märkten Sie können sowohl von Signal zu Signal als auch mit Take Profit handeln Der Algorithmus verwendet kein Zickzack ! Kein Redrawing ! Dies ist ein Kanalinstrument, das einen gleitenden Durchschnitt als Filter verwendet. Gleitender Durchschnitt Es gibt 2 Parameter für die Einstellungen Ma Periode = 5 Perioden gleitender Durchschnitt Channel 1.0 Abstand der Kanallinien vom Chart Price Signal Filter - Berechnung der Signalöffnung und des Filters Es

Eine noch nie dagewesene Großzügigkeit - ein Drittel des Preises!
Der Indikator zeigt auf dem Chart einen anderen beliebten Indikator XO an, der auf dem Bild im Keller zu sehen ist. Wichtig! Der 0-Balken ist der Signalbalken - er wird nicht umgefärbt! Parameter des Indikators: Zone Range (Pips) - die Größe der Zone in Pips ohne Berücksichtigung der Anzahl der Zeichen; Linien- oder Histogrammbreite - Breite der Linien oder Histogramme; Zone Draw Type - die Art, wie die Zonen gezeichnet werden: a
Signalkomplex Atlon ist ein vorgefertigtes Handelssystem, das Signale in Form von Pfeilen per E-Mail sendet und Benachrichtigungen an Ihr Telefon sendet. Atlon zeigt auch vorgefertigte TP-Werte in Form von roten Quadraten an.
Das System arbeitet mit jedem Diagramm (Währungspaare, Aktien, Kryptowährungen, Metalle, Öl).
Zeitrahmen H1. Das System zeichnet nicht neu und die Pfeile verschwinden nirgendwo.
Das Set enthält vorgefertigte Einstellungen, die vor der Installation in der Tabelle geladen

Der Glaze of God ist ein erstklassiger Marktwahrnehmungsindikator, der für Händler entwickelt wurde, die fundierte Entscheidungen treffen und nicht blindlings Signalen folgen.
Der Indikator sagt Ihnen nicht, wann Sie kaufen oder verkaufen sollen. Er zeigt, was der Markt im Moment tut.
WAS DER INDIKATOR ANZEIGT
️ Aktueller Marktmodus (Trend / Range / Übergang) ️ Marktgleichgewichtszone (Fair-Value-Bereich) ️ Vorhandensein oder Fehlen von Momentum ️ Momente, in denen der Handel sinnvoll
Toller Indikator für binäre Optionen!
Versuchen Sie, was er tun kann!
Alert ist in ihm angeordnet, so dass Sie nicht zu spät mit dem Signal sind!
Sie können auch die Perioden anpassen, die Ihnen passen! (es ist für Währungspaare konfiguriert)
Wenn Sie mehr wollen, können Sie immer neu konfigurieren und mehr verwenden!
Pfeil-Indikator, der auf mehrere Indikatoren arbeitet, in den Einstellungen können Sie die Farbe der Pfeile und den Zeitraum ändern! (Wiederholung)
Testen Sie es und sehen S
Hot Option Premium - Ein zuverlässiger Indikator, der nicht zeichnen und zeigt Genauigkeit.
Das Signal erscheint auf der vorherigen Kerze.
Sehr einfach einzurichten, wählen Sie ein Währungspaar und passen Sie die Häufigkeit der Signale in der "Periode" Einstellungen.
Sie können auch die Farbe der Kerze selbst anpassen; die Standardeinstellung ist:
-blauer Pfeil nach oben Signal
-Roter Pfeil nach unten Signal
Hot Option Premium ist mehrwährungsfähig und funktioniert auf allen Charts.
Ein
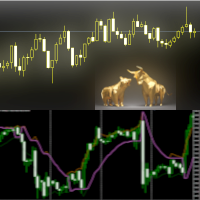
Der Trends Change Indikator kann als Antizipator für den nächsten Trend verwendet werden, vorzugsweise bestätigt durch Price Action oder einen anderen Oszillator (RSi, Stochastic ..).
Großartiges Werkzeug für Indizes, Währungen und Rohstoffe.
Funktioniert auf jedem Zeitrahmen.
Parameter
Range : Einstellung, um die Geschwindigkeit des Indikators zu bestimmen
Line_Up : höherer RSI-Wert
Line_Down : niedrigerer RSI-Wert
Show_Bands : wenn TRUE, werden RSI-Linien angezeigt
MaxBars : analysierte
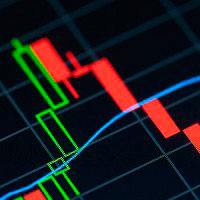
Ich präsentiere einen Indikator, der als eine Strategie von selbst funktioniert, es funktioniert sehr gut in Zeiträumen von 4 Stunden, aber Sie können es auf jeden Zeitrahmen anwenden, die Signale sind sehr einfach zu interpretieren, wenn die orangefarbene Linie kreuzt die blaue und rote Mittelwert, geben Sie lange, die Operation offen gehalten wird, bis die orangefarbene Linie kreuzt die nächste Mittelwert entweder blau oder rot, wenn die Operation war lang und die blaue Linie kreuzt die rote L

Dieser Indikator ist sehr praktisch, weil er uns die Signale direkt auf dem Diagramm in Form einer Linie anzeigt, aber nicht nur das, dieselbe Linie zeigt auch den Stop-Loss an, gleichzeitig sagt uns der Indikator, wann wir den Markt mit der Änderung des Signals verlassen müssen, aber dafür müssten wir das Signal überwachen, also können Sie einen minimalen Take-Profit von 1:1 wählen. Die Signale sind eindeutig: Sobald der Indikator eine blaue Linie unter dem Preis zeichnet, wird ein Kaufgeschäft

Dies ist ein Trendindikator mit Signalen, die sehr einfach zu interpretieren sind. Wir müssen Trends in höheren Zeitlichkeiten bestätigen, um beispielsweise in 1H und 4H zu arbeiten. Wir müssen in 1D-Diagrammen bestätigen. Um in 1D-Diagrammen zu arbeiten, müssen wir in 1W-Diagrammen bestätigen Die Signale sind wie folgt: Als nächstes werden wir lang eingeben, wenn der Indikator uns ein grünes Signal bietet, im Gegenteil, wir werden kurz eingeben, wenn der Indikator uns ein rotes Signal bietet. D

Dieser Indikator arbeitet in einem multitimeframe Weg in 1D und 4H Perioden, die Signale sind wie folgt:
Markteintritte sind gegeben, wenn der Indikator zeigt hellblau oder blau für bullish Trades, für bearish Trades, orange oder rote Farben erscheinen sollte.
Wenn der Indikator hat gelbe oder weiße Farben, sollten Sie vermeiden, den Markt zu betreten, da es keine klare Markttrend, der Stop-Loss ist in der letzten Swing-Bereich unter dem Take-Profit sollte mindestens 1:1, ich hoffe, dies ist hil
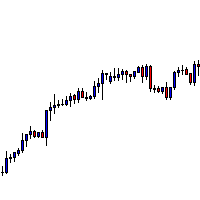
Trendtunnel-Indikator, dieser Indikator wird wie folgt verwendet:
Für bullische Einstiege muss der Preis zuerst über dem Tunnel schließen, wenn nach dem Schließen des Preises über dem Tunnel die nächste Kerze ihren Preis über dem Tunnel öffnet und schließt, eröffnen wir einen bullischen Handel, für bärische Trades sind die Bedingungen die gleichen, nur im Gegenteil, der Preis muss unter dem Tunnel schließen und die nächste Kerze muss unter dem Tunnel öffnen und schließen, der Stop-Loss wird beim
Dies ist ein technischer Indikator, der uns Signale gibt, um den Markt zu betreten, der Indikator nicht neu malen, kann in jedem Zeitrahmen verwendet werden, empfehle ich es in langen Perioden, wie es ist mein Stil des Handels, sondern für diejenigen, die scalping tun kann auch funktionieren, in dem Video zeige ich es mit einem gleitenden Durchschnitt von 150 Perioden als Beispiel. Die Signale sind wie folgt, wir werden Long einsteigen, wenn der Chart einen blauen Pfeil zeigt, im Gegenteil, wenn

Forex-Trend-Indikator, kann es in jedem Zeitrahmen verwendet werden, obwohl ich es in Perioden von 4 Stunden empfehlen, kann es zu Ihrer Strategie hinzugefügt werden oder erstellen Sie eine Strategie mit ihm. Die Signale sind wie folgt, Sie gehen long, wenn der Indikator auf blau wechselt, im Gegenteil, Sie gehen short, wenn der Indikator seine Farbe auf rot wechselt, der Stop-Loss wird auf dem letzten hohen Schwung des Preises und der minimale Take-Profit bei 1:1 platziert, obwohl ich 2:1 empfe

Dies ist ein leistungsfähiger Indikator, der sehr einfach zu handhaben ist. Seine Standardeinstellung ist für das Euro-Dollar-Paar, aber mit den richtigen Einstellungen kann er für alle Märkte und alle Zeitrahmen, die nicht täglich sind, verwendet werden. Die Grundlage der Arbeit des Ranging-Indikators ist es, Bereiche der Preisspanne zu finden und daraus Signale zu erhalten. Sie können die Dauer der gültigen Spanne sowie den Mindest- und Höchstpreis in dieser Spanne festlegen. Es ist auch mögl

Dieser Indikator zeichnet eine Beschriftung über oder unter jeder Kerze, basierend auf Rob Smiths Die Strat wie sie sich im Laufe der Zeit auf Ihrem Diagramm entwickeln.
Wenn sich der Preis entwickelt, kann eine Kerze zwischen drei Zuständen wechseln. Wenn sich die Kerze zum ersten Mal öffnet und vollständig innerhalb der vorherigen Kerzen hoch und niedrig sitzt, beginnt sie als Typ 1. Wenn sie im Laufe der Zeit entweder das Hoch oder das Tief der vorherigen Kerze durchbricht

FTFC bezieht sich auf Full Timeframe Continuity, wie in Rob Smiths The Strat definiert. Dieser Indikator zeichnet zwei Linien auf dem Chart, eine der höchsten der vierteljährlichen, monatlichen, wöchentlichen, täglichen oder stündlichen Eröffnungsniveaus und die zweite der niedrigsten dieser Werte. Dadurch erhalten Sie einen Kanal, über oder unter dem der Handel eher sehr stark in eine Richtung verläuft. Zwischen den Linien wird die Preisbewegung abgehackter und Sie können breitere Stopps ve
Große Kursschwankungen (Dips) können eine Gelegenheit für den Einstieg in Trendumkehrgeschäfte sein. Das Dip-Histogramm zeigt diese großen Kursbewegungen an. Der Benutzer kann die minimale Bewegung in % sowie den Zeitrahmen festlegen, der für die Berechnung der Preisbewegung verwendet wird. Eingabeeinstellungen für das Dip-Histogramm: Dip-Periode - Zeitrahmen, der für die Berechnung der Preisänderung verwendet wird Zu vergleichender Preis - zu vergleichender Preistyp Anzeigemethode - Prozent (Al

Wir stellen das Trend Detection System vor: Ihr Schlüssel zur präzisen Entdeckung von Markttrends.
Das Trend Detection System ist ein hochentwickelter MetaTrader 4-Indikator, der sorgfältig entwickelt wurde, um Händlern die Werkzeuge an die Hand zu geben, die sie benötigen, um Markttrends effektiv zu erkennen und zu verfolgen. Dieser innovative Indikator basiert auf den Prinzipien des gleitenden Durchschnitts und bietet eine unvergleichliche Flexibilität und Genauigkeit bei der Trendanalyse.
H

Fortgeschrittener Trend Breaker Kostenloses Dashboard!!! Advanced Trend Breaker DashBoard: https://www.mql5.com/en/market/product/66336 Breaker's intelligenter Algorithmus erkennt den Trend, Unterstützung und Widerstand, filtert Marktgeräusche heraus und findet Einstiegssignale!!! Testen Sie die Demoversion und erkunden Sie die Funktionen, es wird ein nützliches Werkzeug für Ihr Handelsarsenal sein. Vergessen Sie nicht, das kostenlose DashBoard herunterzuladen!!! Advanced Trend Breaker DashBoard

Dieser Indikator hat zwei Objekte, einen Limetten- und einen roten Punkt. Dieser Indikator nimmt und kombiniert mehrere eingebaute Indikator-Funktionen / Anforderungen und schafft mehr Bedingungen Lime zeigt einen Aufwärtstrend und eine rote Abwärtstrend. Dieser Indikator liest die Gesamtkurse in allen Zeitrahmen und zeigt den Betrag im Kommentar an. Die Wahrscheinlichkeit einer korrekten Vorhersage steigt, wenn zwei Punkte der gleichen Farbe nahe beieinander liegen. Vielen Dank für Ihren Besuch

Der Black-Leopard-Indikator ist ein Trendindikator, der jede Strategie ergänzen kann.
Merkmale Die Bewegungsrichtung des gleitenden Durchschnitts wird durch die Farben angezeigt (blau für Aufwärtsbewegung, rot für Abwärtsbewegung) Die Farbe ändert sich nicht nach dem Schließen der Kerze. Funktioniert bei vielen Instrumenten wie Forex, Metallen, Aktien, Indizes... und auf allen Zeitrahmen Alarmfunktion: E-Mail-Alarm, akustischer Alarm und Push-Benachrichtigung.
Parameter des Indikators Periode
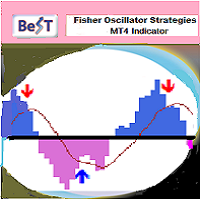
BeST_Fisher Oscillator Strategies ist ein MT4-Indikator, der auf dem beliebten Fisher-Indikator basiert und hauptsächlich dazu verwendet wird, Trendumkehrungen mit hoher Genauigkeit zu erkennen . Es ist ein großartiger Forex-Indikator für Scalping , Daytrading und Swing-Trading Zwecke. Der Indikator wird mit 2 entsprechenden Strategien von Reversed Entries geliefert, von denen jede entweder als eigenständiges Handelssystem oder als Zusatz zu einem beliebigen Handelssystem verwendet werden kann,

Die Märkte lieben runde Zahlen wirklich und sie wirken oft als Unterstützung in einem fallenden Markt oder als Widerstand, wenn der Preis steigt. Dieser Indikator wurde entwickelt, um Preisniveaus bei runden Werten zu zeichnen. Dies geschieht automatisch, aber Sie haben auch die Möglichkeit, dies zu überschreiben und die Ebenen zu bestimmen, die Sie sehen möchten. Ein rundes Niveau kann so einfach sein wie 10er-Schritte, also 10, 20, 30 usw., oder wenn Sie mit Forex arbeiten, möchten Sie viellei
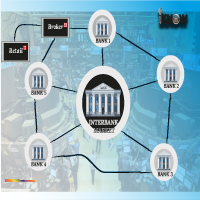
IPDA UND PD RANGES. Interbank Price Delivery Algorithm (IPDA) Bereich Liquidität und Handel auf dem Devisenmarkt finden dezentral statt, da Banken, Broker und elektronische Kommunikationsnetze (ECNs) miteinander interagieren, um die Preise festzulegen. Im Devisenhandel ist ein ECN eine Handelsplattform oder ein elektronischer Makler, der Gebote und Angebote bereitstellt und sie an Nutzer in aller Welt weiterleitet. Das ECN sendet einen Preis in die ganze Welt, wenn verschiedene Teilnehmer Kauf-
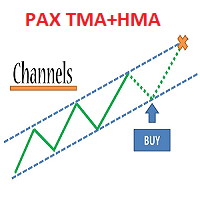
Handelssystem "PAX Multi TMA/HMA 8"
ist ein fertiges Handelssystem für den Handel mit jedem Instrument und jedem Zeitrahmen.
Vollständig fertig für den manuellen Handel und die Verwendung in Robotern.
Nicht neu gezeichnet.
Es ist bequem auf den Zeitrahmen M30, H1, H4 zu arbeiten.
Getestet auf Metallen, Währungspaaren, Öl, internationalen Aktien, russischen Aktien, Kryptowährungen, Währungs- und Kryptowährungsindizes.
Woraus das Handelssystem besteht :
1. Der Hauptkanal der Preisbewegung

Kanalindikator, der auf den Prinzipien der mathematischen Statistik basiert. Er verwendet neuronale Netze, um viele komplexe Berechnungen zu vereinfachen, wodurch der Indikator auch für schwache Computer schnell ist.
Wie er funktioniert Der Indikator basiert auf dem gleitenden Durchschnitt, dessen Periode Sie einstellen können. Der Indikator analysiert die Kursabweichungen von der Linie des gleitenden Durchschnitts für die letzten 1440 oder 2880 Balken, und jede Linie zeigt eine bestimmte Wahr
Der RSI zeigt Ihnen überverkaufte und überkaufte Niveaus an, aber wie können Sie mit dem RSI mit trending Märkten umgehen? Die Lösung ist der CFX Adaptive RSI, der die überverkauften und überkauften Niveaus anhand eines gleitenden Durchschnitts neu berechnet.
Parameter des Indikators: - RSIPeriode: Periode des RSI. - Sensibilität: Ein hoher Wert bedeutet, dass der Indikator sensibler auf Markttrends reagieren wird. Ein niedriger Wert bedeutet, dass der Indikator weniger sensibel auf Markttrends

Price Action Trading ist ein Indikator, der für die Handelsstrategie "Price Action" entwickelt wurde. Der Indikator zeigt die Punkte der Änderung in der Richtung der Preisbewegung, die Richtung des Trends, die Dynamik des Trends, die Entfernung in Punkten vom Beginn der Änderung des Trends gereist. Diese Informationen reichen aus, um am Forex zu handeln und gute Ergebnisse zu erzielen. Der Price Action Trading Indikator hat sich bei GBPUSD, XAUUSD, EURUSD und anderen wichtigen Währungspaaren se

Das CMA-Dashboard wurde entwickelt, um Händlern bei der Erkennung von Trends in verschiedenen Zeitrahmen und Symbolen zu helfen. Es zeigt einen klaren Stand des Gesamttrends an einem Ort an, ohne dass zwischen verschiedenen Charts und Zeitrahmen navigiert werden muss. Dies spart Zeit und beschleunigt die Entscheidungsfindung, so dass potenzielle Chancen nicht verpasst werden. Es basiert auf den hier verfügbaren korrigierten gleitenden Durchschnitten Merkmale
Parameter für die Signaloptimierung
Der MetaTrader Market ist die beste Plattform für den Verkauf von Handelsroboter und technischen Indikatoren.
Sie brauchen nur ein gefragtes Programm für die MetaTrader Plattform schreiben und schön gestalten sowie eine Beschreibung hinzufügen. Wir helfen Ihnen, das Produkt im Market Service zu veröffentlichen, wo Millionen von MetaTrader Benutzern es kaufen können. Konzentrieren Sie sich auf dem Wesentlichen - schreiben Sie Programme für Autotrading.
Sie verpassen Handelsmöglichkeiten:
- Freie Handelsapplikationen
- Über 8.000 Signale zum Kopieren
- Wirtschaftsnachrichten für die Lage an den Finanzmärkte
Registrierung
Einloggen
Wenn Sie kein Benutzerkonto haben, registrieren Sie sich
Erlauben Sie die Verwendung von Cookies, um sich auf der Website MQL5.com anzumelden.
Bitte aktivieren Sie die notwendige Einstellung in Ihrem Browser, da Sie sich sonst nicht einloggen können.