Technische Indikatoren für den MetaTrader 4 - 10

Unverzichtbar für Trader: Tools und Indikatoren Waves automatisch berechnen Indikatoren, Kanal Trend Handel Perfekte Trend-Welle automatische Berechnung Kanal Berechnung , MT4 Perfekte Trend-Welle automatische Berechnung Kanalberechnung , MT5 Lokales Trading Kopieren Einfaches und schnelles Kopieren, MT4 Einfaches und schnelles Kopieren, MT5 Lokales Trading-Kopieren für DEMO Einfaches und schnelles Kopieren , MT4 DEMO Einfaches und schnelles Kopieren, MT5 DEMO 砖图Renko PRO->>>
Die Anzeige der B
FREE
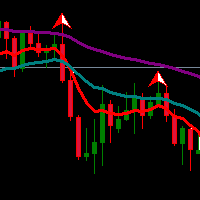
Der Exponentielle Gleitende Durchschnitt (EMA) ist ein Indikator, der häufig von Händlern verwendet wird. Die Kombination von zwei oder drei EMA-Indikatoren wird oft verwendet, um die Trendrichtung zu bestimmen. Mehrere EMA kombiniert mit Fraktalen oder Oszillator-Indikatoren, um überkaufte/überverkaufte und Divergenz-Punkte zu erkennen, sind ebenfalls sehr gut für ein Handelssystem geeignet.
Wenn Sie den EMA-Indikator mögen und einen besseren Indikator wünschen, empfehlen wir Ihnen den EMA Sup
FREE
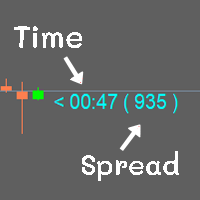
Zeigen Sie die Zeit der Candlesticks und den Spread an. Alle Daten werden in einem Stab angezeigt. Kann die Farbe ändern Kann die Größe nach Bedarf festlegen
MT4 : Link https://www.mql5.com/en/market/product/102742 MT5 : Link https://www.mql5.com/en/market/product/102834
Die meisten freien Code auf verschiedenen Websites Ich habe es nicht selbst geschrieben. Ich habe nur ein kleines bisschen gemacht.
Wenn Sie es mögen, geben Sie bitte 5 Sterne mit. Ich danke Ihnen.
FREE
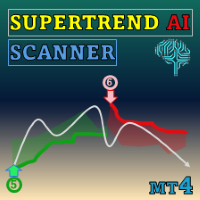
Special offer : ALL TOOLS , just $35 each! New tools will be $30 for the first week or the first 3 purchases ! Trading Tools Channel on MQL5 : Join my MQL5 channel to update the latest news from me Entdecken Sie die Kraft der KI mit dem SuperTrend AI Clustering mit Scanner , einem revolutionären Handelstool für MetaTrader4 (MT4). Dieser Indikator definiert die Marktanalyse neu, indem er K-Means-Clusterbildung mit dem weit verbreiteten SuperTrend-Indikator kombiniert und Händlern ei

MQLTA Support Resistance Lines ist ein Indikator, der die historischen Unterstützungs- und Widerstandsniveaus berechnet und sie als Linien im Chart anzeigt. Er warnt Sie auch, wenn sich der Preis in einer sicheren oder gefährlichen Handelszone befindet und zeigt Ihnen den Abstand zum nächsten Level an. Der Indikator ist ideal für die Verwendung in anderen Expert Advisors über die iCustom-Funktion. Dieser Indikator kann LIVE auf AUDNZD mit dem folgenden DEMO https://www.mql5.com/en/market/product
FREE

Der SMC Venom Model BPR Indikator ist ein professionelles Tool für Trader, die mit dem Smart Money (SMC)-Konzept arbeiten. Er identifiziert automatisch zwei wichtige Muster im Kurschart:
FVG (Fair Value Gap) ist eine Kombination aus drei Kerzen, wobei zwischen der ersten und dritten Kerze eine Lücke besteht. Diese bildet eine Zone zwischen den Niveaus, in der es keine Volumenunterstützung gibt, was häufig zu einer Kurskorrektur führt. BPR (Balanced Price Range) ist eine Kombination aus zwe
Optimieren Sie Ihre Handelsanalyse mit dem Day and Week Separator MT4, einem intuitiven Tool, das anpassbare Tages- und Wochentrennlinien zeichnet, ideal für Trader, die mit Zeitunterschieden zwischen Brokern zu kämpfen haben. In Handelsgemeinschaften wie Forex Factory und Reddit’s r/Forex wird dieses Tool für seine Einfachheit und Effektivität geschätzt, da es die häufige Herausforderung löst, Chart-Zeitrahmen mit lokalen oder marktspezifischen Zeiten abzustimmen, wie es in Diskussionen auf Pla
FREE

Marktstruktur-Indikator zur Visualisierung von Break of Structure (BOS) und Liquiditäts-Sweeps auf Basis von Price Action. Nur zu Analysezwecken. BOS Liquidity Sweep – Marktstruktur-Indikator (MT4) Dieser Indikator visualisiert Break of Structure (BOS) und Liquiditäts-Sweeps direkt im Chart anhand reiner Price Action und Marktstrukturanalyse. Er ist als visuelles Analysewerkzeug konzipiert und führt keine automatischen Trades aus. Konzept Finanzmärkte bewegen sich häufig zunächst in Bereiche
FREE
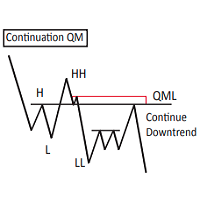
Dieses Custom Mapping Tool ist ein innovativer MT4-Indikator, der das Markieren und Kartieren von Charts vereinfacht. Mit diesem Tool müssen Sie keine Zeit mehr damit verschwenden, sich wiederholende Wörter, Rechtecke und Trendlinienfarben jedes Mal neu zu schreiben. Neue Funktion V5.60:
Pfad zeichnen - Wie der TV-Pfad-Zeichenmodus, der für den nackten Chart-Händler sehr nützlich ist. Sie können Zickzack zeichnen, zeichnen Sie Ihre Muster manuell. Ändern Sie den Stil in den Indikatoreinstellunge
FREE

Der ZUP basiert auf zwei Ideen. Idee 1 - eine Vielzahl von Methoden zur Identifizierung von Extremen (Minima und Maxima) auf den Marktpreis-Charts in einem einzigen Indikator zu kombinieren. Idee 2 - Ermöglichung einer einfachen Verknüpfung verschiedener grafischer Werkzeuge zur Analyse des Marktverhaltens mit den identifizierten Extremen. Um die erste Idee zu verwirklichen , wurde der Indikator wie folgt angepasst. Mehrere ZigZag-Algorithmen wurden integriert. Standard-ZIGZAG-Algorithmus. Diese
FREE
Volume Profile Order Blocks - Ein intelligenter Weg zur Visualisierung von Liquidität, Volumen und wichtigen Niveaus. Volume Profile Order Blocks ist ein hochmoderner Indikator, der die traditionellen Orderblock-Strategien durch die Einbettung eines detaillierten Volumenprofils direkt in jeder Zone erweitert. Dadurch erhalten Händler einen klaren, datengestützten Überblick darüber, wo das institutionelle Interesse liegen könnte - nicht nur im Preis, sondern auch in der Volumenverteilung. MT5-Ver
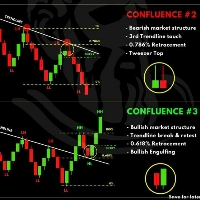
HANDELSFLUSS MIT AUTOMATISCHER TRENDLINIE KOSTENLOS 1. Automatisch die Marktstruktur erkennen Achten Sie auf wichtige Preisaktionsstrukturen: BOS (Bruch der Struktur) CHoCH (Veränderung des Charakters) EQH / EQL (Equal High / Low)
Diese helfen Ihnen, die aktuelle Marktphase (Umkehr oder Fortsetzung) basierend auf dem Smart Money Konzept zu verstehen. 2. Auto Trend Line verwenden Trendlinien werden automatisch auf Basis der gültigen Struktur gezeichnet. A usbruch aus einer Trend
FREE
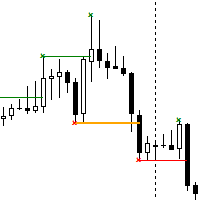
Der Indikator "Break of Structure" (BoS) und "Change of Character" (Charakterwechsel) ist ein leistungsstarkes Instrument zur Identifizierung signifikanter Wendepunkte in Kursbewegungen auf Finanzcharts innerhalb der MetaTrader 4-Plattform. Durch die Analyse der Kursbewegungen hebt dieser Indikator die Momente hervor, in denen der Markt von einem Trend zu einer potenziellen Umkehr- oder Konsolidierungsphase übergeht. Mithilfe hochentwickelter Algorithmen identifiziert der Indikator Ausbrüche, be
FREE

Einführung des Delta Volume Profile Indicator - Entfesseln Sie die Kraft der institutionellen Präzision! Technischer Indikator: Sind Sie bereit, wie die Profis zu handeln? Der Delta-Volumenprofil-Indikator ist kein gewöhnliches Werkzeug. Er ist ein hochpräziser, innovativer Indikator, der Ihnen die Macht des institutionellen Handels in die Hand gibt. Dieser einzigartige Indikator analysiert die Verteilung des Delta-Volumens in Echtzeit und deckt die verborgenen Ungleichgewichte zwischen Käufen u
Der TPX Supply Demand Indikator warnt Sie, wenn Sie Angebots- und Nachfragebereiche erkennen. Mit dem Risiko/Ertrags-Filter erhalten Sie nur dann Warnungen, wenn diese mit der von Ihnen gewählten Konfiguration übereinstimmen. Mit dem First-Touch-Filter werden nur Warnungen in farbigen Bereichen ausgegeben, die noch nicht berührt wurden, d.h. sie wurden noch nicht abgewickelt und haben das größte Potenzial für eine Reaktion. Sobald der Bereich berührt wird, bleibt nur noch die Grenze übrig. Einst
FREE
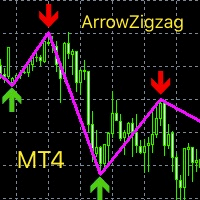
Dieser Index basiert auf der sekundären Entwicklung von Zickzack, indem hohe und niedrige Punkt Pfeil Anzeige, Verdickung der Linie und die Änderung der Farbe. Kann eine gute Anzeige der aktuellen Zulassung Handelssignale, aktuelle lang oder kurz sein. Es kann mit anderen Indikatoren kombiniert werden, um den Handelspunkt zu bestimmen, die großen Referenzwert hat. Im Vergleich zu den allgemeinen Trend-Index oder Oszillation Batch-Standard, ist die genaue Bestimmung höher aus der Perspektive der
FREE
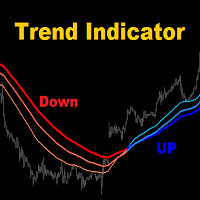
MA3 Trend - ist der gute Trendindikator auf drei MAs. Vorteile des Indikators: Der Indikator erzeugt Signale mit hoher Genauigkeit.
Das bestätigte Signal des Indikators verschwindet nicht und wird nicht neu gezeichnet.
Sie können auf der Handelsplattform MetaTrader 4 eines beliebigen Brokers handeln.
Sie können mit beliebigen Vermögenswerten handeln (Währungen, Metalle, Kryptowährungen, Aktien, Indizes usw.).
Sie können auf beliebigen Zeitrahmen handeln (M5-M15 Scalping und Daytrading / M30-
FREE

MASONS ist ein Werkzeug, das Sie zu einem professionellen Analytiker macht! Die Methode zur Bestimmung von Wellenbewegungen mit Hilfe von geneigten Kanälen vermittelt die Bewegungsmuster jedes Instruments qualitativ und zeigt nicht nur mögliche Umkehrungen auf dem Markt, sondern auch die Ziele weiterer Bewegungen!Zerstört den Mythos, dass der Markt am Leben ist, indem er die Schematik mit Bewegungen von einem Bereich zum anderen deutlich zeigt! Professionelles Werkzeug,geeignet für die mittelfr
FREE

Reversal Pattern AI ist ein bahnbrechender Fortschritt in der Indikatorenentwicklung, der Algorithmen der künstlichen Intelligenz, mehrstufige Marktanalysen und klassische technische Analysemethoden kombiniert. Dank seines hybriden Modells, das Preisaktionsanalyse, Volumen, Volatilität, VWAP und Volume AVG % nutzt, passt sich der Indikator problemlos an alle Marktbedingungen an. Reversal Pattern AI wurde über mehrere Jahre hinweg entwickelt und ausgiebig auf realen Konten getestet. Dies hat sein
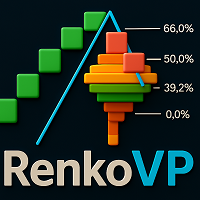
Übersicht
RenkoVP ist ein professionelles Tool zur Preisstrukturanalyse, das vollständig online auf dem Hauptchart läuft. Im Gegensatz zu vielen anderen Renko-Indikatoren benötigt er keine Offline-Charts. Der Indikator kombiniert Renko-Bausteine, Volumenprofil, dynamische Fibonacci-Levels und automatische Mustererkennung, um Händlern zu helfen, Trends, Schlüsselzonen und präzise Einstiegs- und Ausstiegspunkte zu identifizieren. Renko Bricks Konfiguration
Der Indikator bietet sowohl manuelle als

Market Profile 3 MetaTrader 4 Indikator - ist eine klassische Marktprofil-Implementierung, die die Preisdichte im Laufe der Zeit anzeigen kann, indem sie die wichtigsten Preisniveaus, den Wertbereich und den Kontrollwert einer bestimmten Handelssitzung umreißt. Dieser Indikator kann mit Zeitrahmen zwischen M1 und D1 verbunden werden und zeigt das Marktprofil für tägliche, wöchentliche, monatliche oder sogar Intraday-Sessions an. Niedrigere Zeitrahmen bieten eine höhere Präzision. Höhere Timefram
FREE

VWAP-Crossover-Signalindikator für MetaTrader 4
Entfesseln Sie präzises Trading mit dem VWAP-Crossover-Signalindikator!
Heben Sie Ihre Handelsstrategie mit dem VWAP-Crossover-Signalindikator auf ein neues Level – einem leistungsstarken und intuitiven Tool, das speziell für MetaTrader 4 entwickelt wurde. Entworfen für Trader, die Genauigkeit und Klarheit verlangen, nutzt dieser benutzerdefinierte Indikator den Volume Weighted Average Price (VWAP), um direkt auf Ihrem Chart aktionsfähige Kauf-
FREE
Wie man handelt
Führen Sie Ihre Trades in 3 einfachen Schritten aus!
Schritt 1: Handelsaufbau Einstieg Kaufen bei Signalpreis und TP1 im Preisindikator, Sie können den Trailing-Stop in TP1 verwenden. Einstieg Verkaufen im Signalpreis und TP1 im Preisindikator, Sie können den Trailing-Stop in TP1 verwenden. Erfolgsquote ≥ 75% 100:25 Schritt 2: Stop Loss setzen Stop Loss BUY ----> Sie können Stop Loss auf Line Order SELL setzen. Stop Loss SELL ----> Sie können den Stop Loss für die Line Order BUY
FREE

Der Indikator zeichnet die Zeitskala auf dem Chart. Sie können die Zeitverschiebung festlegen, die Größe und die Schriftart für die Anzeige im Diagramm einstellen (es wird Ihre lokale Zeit im Diagramm anstelle der MT-Zeit angezeigt). Sie können auch das gewünschte Format für die Anzeige von Datum und Uhrzeit auswählen. Während Sie die mittlere Maustaste gedrückt halten und den Cursor bewegen, erscheint ein Schieberegler auf der Skala. Vielleicht sind Sie an meinem anderen Produkt interessiert,
FREE

Der Supreme HmaSignal-Indikator ist ein Indikator für den Trendhandel, sein Hauptmerkmal ist der Rumpf gleitenden Durchschnitt farbige Linie, und sekundär ist kaufen und verkaufen Pfeile, Pfeile sind fair, aber der Schwerpunkt liegt auf der farbigen hma, dieser Indikator nicht neu malen oder zurück malen oder verzögern ihre Signale. Wenn Ihnen dieser Indikator gefällt, schauen Sie sich bitte meinen Supreme Trendhisto: hier , und meinen Supreme Diamond Indikator: hier an
Parameter: HMA-Periode H
FREE

Handelsverlauf für MT4 Dieser Indikator wurde speziell für Trader entwickelt, die ihre Trades auf den Charts anzeigen möchten. Zeigt die Historie und die aktuellen Geschäfte auf dem Chart an. Trades werden auf dem Chart mit einer gepunkteten Linie angezeigt, und der Gewinn wird in Echtzeit angezeigt. Gekaufte Trades werden in Bullenfarbe angezeigt, verkaufte Trades in Bärenfarbe.
Tipp: Die vom Indikator angezeigte historische Order ist mit der "Account History" verknüpft. Bitte stellen Sie die
FREE

Tipu Heikin-Ashi Panel ist die modifizierte Version des ursprünglichen Heiken-Ashi-Indikators, der von MetaQuotes hier veröffentlicht wurde. Eine professionelle Version dieses Indikators ist hier erhältlich.
Merkmale Ein einfach zu bedienendes Panel, das den Heiken Ashi-Trend des ausgewählten Zeitrahmens anzeigt. Anpassbare Kauf-/Verkaufswarnungen, Push-Warnungen, E-Mail-Warnungen oder visuelle Warnungen auf dem Bildschirm. Anpassbares Panel. Das Panel kann an eine beliebige Stelle im Chart ver
FREE

Dieser Indikator hilft, das Hoch und Tief der Sitzung Asian,London,Newyork zu markieren, mit benutzerdefinierten Stundeneinstellung
Dieser Indikator ist so eingestellt, dass er von der Minutenkerze zählt, so dass er sich mit dem aktuellen Markt bewegt und zur angegebenen Stunde stoppt und eine genaue Linie für den Tag erstellt.
unten ist die Anpassung, die Sie einstellen können:
Input Descriptions AktivierenAsiatisch Aktiviert oder deaktiviert die Anzeige der Höchst- und Tiefststände der
FREE

Der CyberZingFx Volume Indicator wurde entwickelt, um Händlern zu helfen, Marktumkehrungen mit Leichtigkeit zu erkennen. Dieses leistungsstarke Tool verwendet eine einzigartige Strategie, die sowohl Volumen als auch historische Preise kombiniert, um genaue Signale für potenzielle Marktumkehrungen zu liefern. Der Indikator zeigt Volumenwerte für KAUF und VERKAUF auf der rechten Seite des Charts an. Mit anpassbaren Einstellungen können Sie Alarme auf verschiedenen Niveaus einstellen, um Ihrem Hand
FREE

UR-Hochs und -Tiefs
UR Highs&Lows führt eine eingehende Analyse der Preisbewegung und ihrer Volatilität durch und erstellt einen Kanal, innerhalb dessen sich der Preis bewegt. Dieser Kanal bewegt sich jetzt als Oszillator und wird mit der Abweichung des Preises überlagert, um potenzielle Erschöpfungen und mögliche Umkehrungen anzuzeigen.
Vorteile der Verwendung von UR Highs&Lows:
Keine Parameter Sie haben 3 Linien, die die Preisbewegung beschreiben – die weiße Linie, die einen Durchschnitt
Dies ist ein leistungsstarker, sitzungsbezogener Ausbruchsindikator, der für ernsthafte Händler entwickelt wurde, die von Volatilität und Struktur profitieren. Der Indikator ist auf Präzision ausgelegt und identifiziert hochwahrscheinliche Ausbruchszonen während der Londoner und New Yorker Handelssitzungen - dort, wo sich der Markt mit Absicht bewegt. Hauptmerkmale: Session Range Detection
Erkennt und markiert automatisch die wichtigsten Kursbereiche der Londoner und New Yorker Sitzungen. Break
FREE

Der Indikator zeigt Volumenprofile an, die auf dem Schachtelprinzip basieren. Die Perioden der Profile sind so voreingestellt, dass jedes nachfolgende Profil doppelt so lang ist wie das vorhergehende Profil. Zusätzlich zu den Profilen zeigt der Indikator Volumencluster an, die je nach dem darin enthaltenen Volumen farblich sortiert sind.
Merkmale des Indikatorbetriebs Der Indikator arbeitet auf typischen Zeitrahmen von M5 bis MN, verwendet aber für Berechnungen historische Daten aus kleineren
FREE
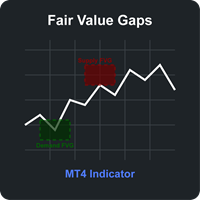
Fair Value Gaps (FVG) Indikator für MT4 Der Fair Value Gaps (FVG) Indikator ist ein leistungsstarkes Werkzeug der technischen Analyse zur Identifizierung und Visualisierung signifikanter Preisungleichgewichte im Markt. Diese Lücken entstehen, wenn der Preis eine starke Richtungsbewegung macht und stellen Bereiche dar, in denen der Preis so schnell gestiegen oder gefallen ist, dass keine Handelsaktivität stattfand – ein mögliches Zeichen für institutionelles Interesse und starken Marktimpuls. Hau
FREE
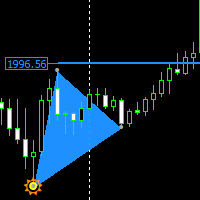
Auf Preisaktionsmustern basierender Indikator, der nicht nachgemalt wird funktioniert auf allen Zeitrahmen der Indikator basiert auf einem 123-Dreieck-Muster, das jeden Tag auf dem Markt vorkommt Der Indikator zeigt Ihnen das Muster an und Sie können das Fib-Level einschalten, um Ihren Take-Profit zu sehen. Blaues Dreieck ist ein Kaufsignal Rotes Dreieck ist ein Verkaufssignal Horizontale blaue und rote Linien sind ein Hinweis darauf, dass Sie Ihren Stop-Loss platzieren sollten, wenn der Preis d

Info Plus ist ein einfaches Tool, das den aktuellen Status einer Anlageklasse anzeigt. Zu den von Info Plus angezeigten Informationen gehören: Geldkurs Höchst- und Tiefstkurs des Tages. Verbleibende Zeit der Kerze. Aktueller Spread. Ausgewählter Zeitrahmen. Ausgewählte Anlageklasse (Symbol). Pip-Wert. Offene Positionen. Gebuchte Pips insgesamt. Pips pro Handel. Sitzungszeiten (sie sind möglicherweise nicht genau und können sich ändern). Datum und Uhrzeit.
Wie funktioniert es? Wenn Info Plus auf
FREE

Dark Inversion ist ein Indikator für den Intraday-Handel. Dieser Indikator basiert auf der Counter Trend Strategie, nutzt aber auch die Volatilität. Mit diesem Indikator kann man bei guten Kursen einsteigen, um die Inversionen auf dem aktuellen Instrument zu verfolgen. Hey, I made an Expert Advisor based on this indicator, if you are interested: Dark Titan
Wichtigste Vorteile
Leicht sichtbare Inversions-Linien Intuitive Richtungspfeile Automatisierte Anpassung für jeden Zeitrahmen und jedes In
FREE
GT Trend ist ein Trendindikator, der speziell für den Handel auf M1 und M5 Charts entwickelt wurde. Der Indikator ist ideal für Händler, die den Intraday-Handel bevorzugen. Sie können diesen Indikator als Grundlage für Ihr Handelssystem oder als eigenständige Handelslösung verwenden. Der Indikator ist einfach zu bedienen. Sie müssen nur den Signalen folgen. Ich werde allen Benutzern dieses Indikators auch zusätzliche Indikatoren kostenlos zur Verfügung stellen, die dazu beitragen, diese Methode

Das Matrix Arrow Indicator Multi Timeframe Panel MT4 ist ein kostenloses Add-On und eine großartige Bereicherung für Ihren Matrix Arrow Indicator MT4 . Es zeigt das aktuelle Matrix Arrow Indicator MT4 -Signal für 5 benutzerdefinierte Zeitrahmen und für insgesamt 16 veränderbare Symbole/Instrumente. Der Benutzer hat die Möglichkeit, jeden der 10 Standardindikatoren, aus denen der Matrix Arrow Indicator MT4 besteht, zu aktivieren/deaktivieren. Alle der 10 Standardindikatorattribute sind ebenfalls
FREE

Der RSI-Divergenzindikator ist ein Multi-Timeframe- und Multi-Symbol-Indikator, der uns hilft, Divergenzen zwischen dem Preisdiagramm und dem RSI-Indikator zu finden. Verwenden Sie die Divergenzindikatoren immer zusammen mit anderen technischen Werten wie Unterstützungs- und Widerstandszonen, Kerzenmustern und Preisaktionen, um eine höhere Wahrscheinlichkeit für Trendumkehrungen zu haben. Dieser Indikator identifiziert die Höchst- und Tiefststände sowohl des Preises als auch des RSI-Indikators.
FREE
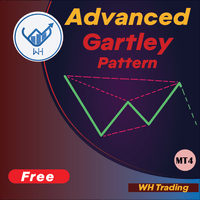
Willkommen beim Advanced Gartley Pattern Recognition Indicator Dieser Indikator erkennt Gartley-Muster basierend auf HH und LL der Preisstruktur und Fibonacci-Niveaus, und wenn bestimmte Fib-Niveaus erreicht werden, zeigt der Indikator das Muster auf dem Diagramm an. MT5-Version: WH Advanced Gartley Pattern MT5
**Dieser Indikator ist Teil von Combo WH Ultimate Harmonic Patterns MT4 , einschließlich der gesamten Mustererkennung.** Merkmale : Erweiterter Algorithmus zur Erkennung des Ga
FREE

Vorstellung von ProEngulfing - Ihr professioneller Engulf-Muster-Indikator für MT4 Entfesseln Sie die Kraft der Präzision mit ProEngulfing, einem innovativen Indikator, der entwickelt wurde, um qualifizierte Engulf-Muster auf dem Devisenmarkt zu identifizieren und hervorzuheben. Entwickelt für MetaTrader 4 bietet ProEngulfing einen akribischen Ansatz zur Erkennung von Engulf-Mustern und stellt sicher, dass Sie nur die zuverlässigsten Signale für Ihre Handelsentscheidungen erhalten. Wie ProEngul
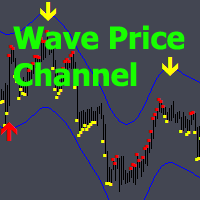
Wave Price Channel – Handelsanalytisches System zur Suche nach Impulsen und Korrekturen.
Mit dem Indikator können Sie in Richtung des Preiskanals arbeiten, der auf der Grundlage der Volatilität aufgebaut ist.
Wenn ein Aufwärts- oder Abwärtspfeil auf dem Kanal gezeichnet wird, wird es möglich, in diese Richtung zu gehen; das Signal in diese Richtung wird durch einen Punktindikator bestätigt, der empfindlich auf Preisänderungen reagiert.
Solange gleichfarbige Punkte vorhanden sind, bleibt das Sig

Candle Binary Scalper ist ein technisches Analyseprodukt für Devisen und binäre Optionen.
Enthält mehrere technische Indikatoren, die in einem Handelssystem zusammengefasst sind.
Geeignet für den manuellen Handel innerhalb eines Trends, für Scalping und binäre Optionen. Funktioniert für alle Zeitrahmen und Handelsinstrumente.
Empfohlene Zeitrahmen für den Handel M15, M30, H1 und H4, M5 und M1 sollten bei hoher Volatilität verwendet werden. Es gibt verschiedene Arten von Warnungen.
So verwenden
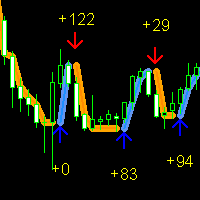
Forex Gump Signal ist ein neuer Indikator aus der ForexGump-Serie. Dieser Indikator bestimmt im Gegensatz zu anderen die Preisumkehrpunkte mithilfe einer mathematischen Berechnung der Geschwindigkeit eines standardmäßigen gleitenden Durchschnitts. Wenn sich die Bewegungsgeschwindigkeit verlangsamt, interpretiert der Indikator dies als Signal für eine Trendumkehr. Dadurch kann der Indikator selbst die kleinsten Preisumkehrpunkte erfassen. Damit der Indikator mit der Analyse größerer Umkehrpunkte
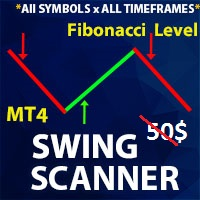
** Alle Symbole x Alle Zeitrahmen scannen nur durch Drücken der Scannertaste ** Rabatt: Der Preis ist $50$, aber jetzt ist es nur $35, begrenzte Zeit Angebot aktiv ist.
*** Kontaktieren Sie mich , um Ihnen Anweisungen zu senden und fügen Sie in "Swing-Scanner-Gruppe" für den Austausch oder sehen Erfahrungen mit anderen Benutzern. Schaukel EA: https: //www.mql5.com/en/market/product/124747 Einführung: Swing Scanner ist ein Indikator, der entwickelt wurde, um Schwankungen in der Trendrichtung un

Multicurrency und Multitimeframe Modifikation des ZigZag Indikators. Zeigt die aktuelle Richtung des Marktes, die Höhe der letzten Bewegung, die Anzahl der Balken in dieser Bewegung und den Bruch des vorherigen Punktes des ZigZag (horizontale Linie) an. Dies ist ein MTF-Scanner, Sie können tatsächlich die Angebots- und Nachfrageebenen sehen.
Sie können alle gewünschten Währungen und Zeitrahmen in den Parametern angeben. Außerdem kann das Panel Benachrichtigungen senden, wenn die ZigZag-Linie i

Dieser Indikator basiert auf der GMMA-Strategie von Guppy. Er zeigt Pfeile an, wenn sich GMMA-Linien nach oben oder unten kreuzen. Um diesen Indikator zu nutzen und Warnungen für mehrere Zeitrahmen und mehrere Paare zu erhalten, können Sie die Demo dieses GMMA Trend Scanner Indikators ausprobieren: https://www.mql5.com/en/market/product/38747
Über GMMA in Kürze:
GMMA versucht, Trends zu erkennen, indem er zwei Gruppen von gleitenden Durchschnitten mit unterschiedlichen Zeiträumen kombiniert: Di
FREE

Auf der Welle des Trends reiten – Klare Signale für den Einstieg An den Finanzmärkten entstehen die stabilsten Gewinnchancen oft in klaren Trendphasen. Doch selbst erfahrene Trader tun sich schwer, diese Bewegungen zuverlässig zu nutzen. Ride the Trend Signal ist ein Signalindikator, der speziell für Rücksetzer innerhalb eines bestätigten Trends konzipiert wurde. Anstatt den Einstieg am Anfang eines Trends zu suchen, konzentriert sich dieser Indikator auf die zweite oder dritte Welle – nach Best
FREE

US30 Revolt ist ein technischer Indikator, der zu 100% nicht nachgemalt wird und auf der aktuellen Kerze erscheint funktioniert auf allen Zeitrahmen (empfohlen M15,M30,H1) Der Indikator wurde für US30 entwickelt, kann aber auch für andere Paare verwendet werden. Wenn ein blauer Pfeil erscheint, suchen Sie nach Kaufgelegenheiten Wenn ein orangefarbener Pfeil erscheint, suchen Sie nach Verkaufsgelegenheiten Bitte sehen Sie sich das YouTube-Video an, in dem erklärt wird, wie man den Indikator richt
FREE
Keltner Signals Pro: Klüger handeln, mehr verdienen! Keltner Signals Pro jetzt auch im EA-Format. Jetzt herunterladen. Verbessern Sie Ihre Handelsgenauigkeit und eliminieren Sie falsche Signale mit Keltner Signals Pro - dem fortschrittlichen und dennoch intuitiven Indikator, der für ernsthafte Trader entwickelt wurde, die beständige Gewinne anstreben! Haben Sie genug von irreführenden Handelssignalen? Keltner Signals Pro kombiniert auf meisterhafte Weise die Stärke der Keltner-Kanäle zur Identif
FREE
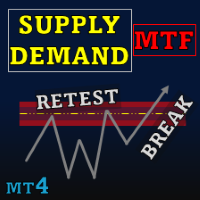
Special offer : ALL TOOLS , just $35 each! New tools will be $30 for the first week or the first 3 purchases ! Trading Tools Channel on MQL5 : Join my MQL5 channel to update the latest news from me Supply Demand Retest and Break Multi Timeframe , dieses Tool zeichnet Angebots- und Nachfragezonen basierend auf starken Momentum-Kerzen und ermöglicht es Ihnen, diese Zonen über mehrere Zeitrahmen hinweg mit der Funktion timeframe selector zu identifizieren. Mit Retest- und Break-La

Dashboard für Ma Speedometer: https: //www.mql5.com/en/market/product/116784
Nicht standardisierte Einstellung zum Standardindikator des gleitenden Durchschnitts. Das Wesen des Indikators besteht darin, die Stärke und Geschwindigkeit der Kursrichtung zu bestimmen, indem der Neigungswinkel des gleitenden Durchschnitts ermittelt wird. Ein Punkt wird auf der fünfzehnten MA-Kerze und ein Punkt auf der letzten geschlossenen MA-Kerze genommen, eine gerade Linie wird zwischen ihnen gezogen, sie ist be
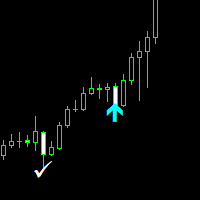
Nasdaq Savages Nicht-Wiederholungsindikator funktioniert auf allen Zeitrahmen 1 Minute bis 15 Minuten Zeitrahmen für Scalper. 30 Minuten bis monatlicher Zeitrahmen für Swing-Trader Der Nasdaq Savages-Indikator verfügt über einen Info-Reiter oben rechts, der Sie über das aktuelle Kauf- oder Verkaufssignal, den Gewinn in Pips, den Stop Loss und das Ziel informiert Der rote Pfeil ist Ihr Einstiegssignal für den Verkauf, der weiße rechte Haken ist Ihr Ausstiegssignal und das Signal für die Gewinnmit
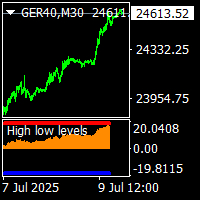
auf Demo-Modus, verwenden Datum für die Prüfung. für die Menschen kaufen diese Indikator, gibt es Bonus, Preis chanell und Timing-Indikator und tma Kontrolle periot und .complate Handelssystem hoch niedrig Ebenen Indikator ist nicht repaint Trendumkehr indicator.and arbeitet alle Paare und alle timeframes. Es gibt ein Histogramm Bewegung nach oben und unten. und es gibt ein Niveau rot und blau. Wenn Histogramm erreichen die bis rote Ebene, die top.and Umkehrung ist möglich. Wenn Histogramm nach

Unser RSI-Indikator verfügt über eine leistungsstarke Multi-Zeitrahmen-Funktion (MTF) , die es Ihnen ermöglicht, RSI-Werte aus anderen Zeitrahmen (z.B. H1, H4, D1) direkt in Ihrem aktuellen Arbeitschart (z.B. M15) anzuzeigen. Vorteile des MTF RSI : Senior Timeframe Context: Verstehen Sie den globalen Trend und die überkauften/überverkauften Niveaus von Senior Timeframes, ohne die Charts zu wechseln. Dies hilft dabei, Signale auf den niedrigeren TFs herauszufiltern und in Richtung der Hauptbewegu
FREE

Super Entry ist ein All-in-One-Indikator vom Typ Pfeil, der Long- und Short-Signale sowie TP- und SL-Levels liefert, die auf dem ATR-Wert basieren und geändert und optimiert werden können. Dieser Indikator bietet ein Backtesting-Panel, das die Gewinnrate und andere Statistiken anzeigt Geben Sie eine klare Vorstellung davon, wie viel Genauigkeit zu erwarten ist.
Dieser Indikator wird nicht neu oder rücklackiert und das Signal kommt ohne Verzögerung bei offenem Balken.
Parameter:
Einstellungen

Der Keltner-Kanal ist ein bekannter Indikator, der nicht in der Standard-Indikatorenliste von MT4 enthalten ist (Sie können ihn irgendwie von Ihrem Broker erhalten). Dieser Indikator hilft Ihnen, den Trend und manchmal überkaufte/überverkaufte Preise während eines flachen Trends zu definieren. Eingabe Beschreibung: EMA-Periode: Periode des gleitenden Durchschnitts, die für den Indikator verwendet wird. Muss größer als 1 sein. ATR-Zeitraum: Für den Indikator verwendete Average True Range-Periode.
FREE
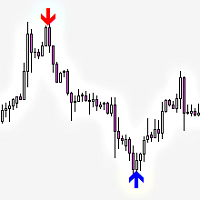
Railway Tracks Pattern - Umkehrmuster-Indikator Railway Tracks Pattern ist ein Indikator, der automatisch ein starkes Zwei-Kerzen-Umkehrmuster auf dem Chart erkennt. Er sucht nach zwei Kerzen mit entgegengesetzten Richtungen (bullish und bearish), die ähnlich groß sind und nur minimale Dochte aufweisen - ein klares Zeichen für einen Momentumwechsel. So funktioniert es: Die erste Kerze ist stark und richtungsweisend. Die zweite Kerze bewegt sich in die entgegengesetzte Richtung und ist von
FREE
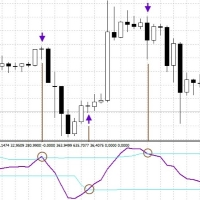
Cyclic Smoothed Relative Strength Indicator
Der zyklisch geglättete RSI-Indikator ist eine Weiterentwicklung des klassischen RSI. Er fügt
eine zusätzliche Glättung entsprechend der Marktschwingung,
adaptive obere und untere Bänder entsprechend dem zyklischen Speicher und
unter Verwendung der aktuellen dominanten Zykluslänge als Input für den Indikator hinzu . Der cRSI wird wie ein Standardindikator verwendet. Im Diagramm werden Handelssignale hervorgehoben, wenn die Signallinie über oder unt
FREE
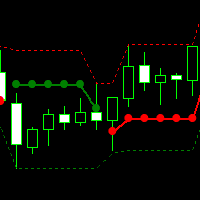
Dieser technische Indikator eignet sich besonders für kurzfristige Trader, da er schnell den Ausgangspunkt und die Umkehr des Trends widerspiegeln kann. Die roten Perlen stehen für den Anstieg und die grünen Perlen für den Rückgang, was die aktuelle Marktsituation deutlich und zeitnah widerspiegeln kann. Die roten Perlen stehen für den Anstieg und die grünen Perlen für den Rückgang, was die aktuelle Marktsituation deutlich und zeitnah widerspiegeln kann. Der Quellcodepreis kann separat berechnet

Der Indikator ist ein Handelssystem für den kurzfristigen Handel.
Scalper Assistant hilft, die Richtung der Transaktion zu bestimmen, und zeigt auch die Einstiegs- und Ausstiegspunkte an.
Der Indikator zeichnet zwei Linien (mögliche Punkte für die Eröffnung von Positionen).
Im Moment des Durchbruchs der oberen Linie nach oben (und wenn alle Handelsbedingungen erfüllt sind), erscheint ein Aufwärtspfeil (ein Kaufsignal), sowie 2 Ziele.
Im Moment des Durchbruchs der unteren Linie nach unten (und w
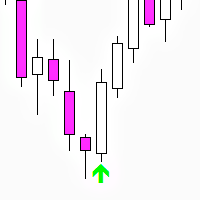
Three Bar Reversal (MT4) - kostenloser Indikator Three Bar Reversal ist ein einfacher und effektiver MetaTrader 4-Indikator, der das klassische Three-Bar-Reversal-Kerzenmuster mit zusätzlicher Filterung auf Basis von ATR und Kerzenkörpergrößen erkennt.
Die Pfeile werden auf der letzten geschlossenen Kerze des Musters angezeigt, und es werden auch Push-Benachrichtigungen gesendet. Ein automatisierter Handelsroboter Three Bar Reversal EA wurde auf der Grundlage dieses Indikators entwickelt. De
FREE

STAUAUSBRUCH PRO
Dieser Indikator scannt den Ausbruch von Stauzonen. Dieser Indikator unterscheidet sich von allen anderen Stau-Indikatoren, die Sie derzeit auf dem Markt finden. Er verwendet einen fortschrittlichen Algorithmus, der den meisten traditionellen Stau-Indikatoren, die heute verfügbar sind, nicht eigen ist. Der fortschrittliche Algorithmus, der zur Definition der Staus verwendet wird, ist in hohem Maße für die hohe Rate echter Stauzonen und die niedrige Rate falscher Stauzonen vera

This Indicator is a affordable trading tool because with the help of Popular Developers & Support of M Q L Platform I have programmed this strategy. I tried to combine logic of Moving Averages, Parabolic Stop And Reverse, Trend Strength, Oversold, Overbought . Furthermore, I have also care about Support Resistance that Trader can easily get in touch with market by selecting one indicator only. What is in for Trader?
Trading Modes: This selection is for activate whole strategy "Power A
FREE

Dies ist die kostenlose Version des Supply&Demand + Trendline + Trend Tools. Diese Version funktioniert nur mit EURCHF! Die Vollversion finden Sie hier: https: // www.mql5.com/en/market/product/67274
PAAIOS steht für Price Action All In One Solution . Und genau das ist der Zweck des Indikators. Er soll Ihnen ein Werkzeug an die Hand geben, mit dem Sie Ihr Trading entscheidend verbessern können, weil Sie die entscheidenden Informationen auf einen Blick erhalten. Der Indikator vereinfacht die Su
FREE
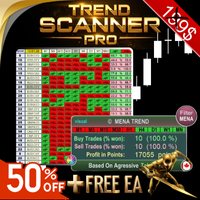
Trend-Scanner PRO Zunächst einmal ist es wichtig zu betonen, dass dieses Handelssystem zu 100 % nicht nachzeichnend, nicht nachziehend und nicht nachlaufend ist ,
was es ideal für manuelle und algorithmische Handelssysteme macht. Online-Kurs, Benutzerhandbuch und herunterladbare Voreinstellungen inbegriffen. Das Trend Scanner Dashboard ist ein professioneller Multi-Paar-Scanner , der mehrere Symbole und Zeitrahmen gleichzeitig analysiert und Ihnen einen sofortigen Überblick über die tatsächlich

VWAP für Scalper
Sitzungsbewusste VWAP-Linien für schnelle, präzise Scalps. ️ Eingaben (MT4/MT5) Enable_Hourly_VWAP: Stündliches VWAP aktivieren. Enable_Asia_VWAP: Asiatisches Sitzungs-VWAP aktivieren. Enable_Europe_VWAP: Europäisches Sitzungs-VWAP aktivieren. Enable_NA_VWAP: Nordamerikanisches Sitzungs-VWAP aktivieren. Enable_Extended_VWAP: Erweitertes Sitzungs-VWAP aktivieren. Enable_Daily_VWAP: Tägliches VWAP aktivieren. Asiatische Sitzung (GMT) Session_Asia_Start_Hour: Startzeit asiatische
FREE

Trading System Double Trend – ein unabhängiges Handelssystem bestehend aus mehreren Indikatoren. Bestimmt die Richtung des allgemeinen Trends und gibt Signale in Richtung der Preisbewegung.
Kann für Scalping, Intraday- oder Intraweek-Handel verwendet werden.
Möglichkeiten
Funktioniert mit allen Zeitrahmen und Handelsinstrumenten (Forex, Kryptowährungen, Metalle, Aktien, Indizes). Einfaches visuelles Lesen von Informationen, ohne ein Diagramm laden zu müssen Der Indikator zeichnet keine Signal
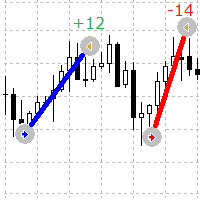
Ein einfacher, aber nützlicher Indikator, um die Ein- und Ausstiegspunkte von Aufträgen auf dem Chart visuell zu sehen
Dieser Indikator zeigt aktuelle offene Orders und abgeschlossene Orders auf dem Symbol
Indikatorparameter
Lines Buy color - gibt die Farbe der Linien für Kaufaufträge an Lines Sell color - legt die Farbe der Linien für Verkaufsaufträge fest Lines Width - legt die Linienbreite fest, funktioniert für Solid-Stiltypen Lines style - legt den Linienstil fest Lines positive profit
FREE
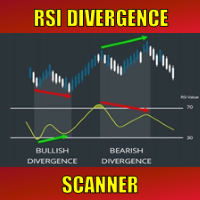
Special offer : ALL TOOLS , just $35 each! New tools will be $30 for the first week or the first 3 purchases ! Trading Tools Channel on MQL5 : Join my MQL5 channel to update the latest news from me In den dynamischen Finanzmärkten ist die Identifizierung von Trendwende-Signalen für effektives Trading unerlässlich. Der RSI Divergence Scanner ist darauf ausgelegt, Ihnen dabei zu helfen, RSI-Divergenzsignale über verschiedene Währungspaare und Zeitrahmen hinweg genau und effizient zu
FREE
Erfahren Sie, wie man einen Handelsroboter im MetaTrader AppStore, dem Shop für Applikationen für die MetaTrader Handelsplattform, kaufen kann.
Das Zahlungssystem der MQL5.community ermöglicht Zahlungen mit PayPal, Kreditkarten und den gängigen Zahlungssystemen. Wir empfehlen Ihnen eindringlich, Handelsroboter vor dem Kauf zu testen, um eine bessere Vorstellung von dem Produkt zu bekommen.
Sie verpassen Handelsmöglichkeiten:
- Freie Handelsapplikationen
- Über 8.000 Signale zum Kopieren
- Wirtschaftsnachrichten für die Lage an den Finanzmärkte
Registrierung
Einloggen
Wenn Sie kein Benutzerkonto haben, registrieren Sie sich
Erlauben Sie die Verwendung von Cookies, um sich auf der Website MQL5.com anzumelden.
Bitte aktivieren Sie die notwendige Einstellung in Ihrem Browser, da Sie sich sonst nicht einloggen können.