Technische Indikatoren für den MetaTrader 4 - 41

MaSonic MT4 Japanische Version
Mit diesem Indikator können Sie auf einen beliebigen Punkt im Chart klicken, um schnell einen gleitenden Durchschnitt (MA) durch diesen Punkt zu finden und anzuzeigen.
Merkmale: Einfache Bedienung: Klicken Sie auf einen beliebigen Punkt, an dem Sie einen MA finden möchten. Sofortige Ergebnisse: Zeigt alle gefundenen passenden MAs an. Ruhefunktion: Blendet die Tasten aus, wenn sie nicht verwendet werden , und hält die Benutzeroberfläche sauber. Manuelle Steuerung:
FREE

Pipsurfer Tide Meter ist ein Momentum-Indikator, der den Händlern helfen soll, zu erkennen, in welche Richtung sich die "Flut" dreht. Dieser Indikator ist ein großartiger unterstützender Indikator für den Pipsurfer Hauptindikator, der in MQL5 unter "Pipsurfer Indikator" aufgeführt ist.
Die Strategie hinter dem Tide Meter ist, dass Sie die blauen und roten Balken sehen. Blaue Balken stehen für bullisches Momentum Rote Balken stehen für ein bärisches Momentum Verwenden Sie die Preis-Aktion, um ei
FREE
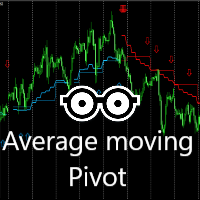
Dieser Indikator ist sehr effektiv für den täglichen Handel. Eine Kombination aus gleitenden Durchschnitten und 2X Pivots Berechnung, um ein sehr überzeugendes Signal jeden Tag zu produzieren. Die blaue Farbe signalisiert eine Kaufgelegenheit. Folgen Sie den Pfeilen für mögliche Kaufpunkte. Die blauen Pivots und die Durchschnittslinie dienen als mögliche Unterstützung. Die rote Farbe signalisiert eine Verkaufsgelegenheit. Folgen Sie den Pfeilen, um mögliche Verkaufspunkte zu finden. Die roten Pi
FREE
Dieser Multi-Timeframe-Indikator identifiziert die Tendenz des Marktes, innerhalb eines engen Preisbandes zu handeln. [ Installationsanleitung | Update-Anleitung | Fehlerbehebung | FAQ | Alle Produkte ]
Er ist leicht zu verstehen Findet überkaufte und überverkaufte Situationen Zeichnet bei Bar-Schluss und malt nicht zurück Der Berechnungszeitrahmen ist anpassbar Die rote Linie ist der überkaufte Kurs Die grüne Linie ist der überverkaufte Preis Die Auswirkungen auf den Handel sind ganz einfach.
FREE

Änderungsrate
Basierend auf der Formel, ROC = (Close[n] - Close[n-lookback]) / Close[n-lookback] * 100 um die Änderungsrate der Preisbewegung eines Währungspaars über einen Rückblickzeitraum darzustellen, und stellt zwei globale Variablen bereit, SYMBOL_ROC und SYMBOL_ROC_LOOKBACK, die den neuesten Wert der Änderungsrate und die Änderungsrate im vorherigen Rückblickzeitraum darstellen. Aufrufen des Indikators mit der iCustom-Funktion, iCustom ( "Market/RedeeCash_Rate_of_Change.ex4" , Symbol ()
FREE

Nach 7 Jahren habe ich beschlossen, einige meiner eigenen Indikatoren und EAs kostenlos zu veröffentlichen.
Wenn Sie sie nützlich finden, zeigen Sie bitte Ihre Unterstützung mit einer 5-Sterne-Bewertung! Euer Feedback sorgt dafür, dass die kostenlosen Tools weiterhin zur Verfügung stehen! Sehen Sie sich auch meine anderen kostenlosen Tools an:
_________________________________ Intraday Intensity Index (III) für präzisen Devisenhandel Der Intraday Intensity Index, der sorgfältig in M
FREE
Binary Options Assistant (BOA) CHILL Signals Indicator liefert Signale, die auf Katie Tutorials Binary Options Strategy basieren. Indikatoren: 3 gleitende Durchschnitte & RSI
Verwenden Sie jeden der BOA Signals Indikatoren mit dem Binary Options Assistant (BOA) Multi Currency Dashboard , so können Sie:
Verpassen Sie keine Handels-Setups mehr Hören Sie auf, von Chart zu Chart zu springen und nach Handels-Setups zu suchen Erhalten Sie alle Signale auf 1 Chart Alle BOA-Signalindikatoreinstellunge
FREE

Die Demoversion des Indikators Colored Candles - berechnet die Parameter jeder Kerze, sowie ihr Volumen. Danach färbt er die Kerzen je nach ihrer Stärke und Richtung. Bullen-Kerzen sind grün gefärbt und Bären-Kerzen - rot. Je größer die Stärke der Bullen oder Bären, desto heller die Farbe. Sie können die Farben ändern, wenn Sie möchten. Der Indikator hilft bei der Analyse der Preisbewegung und der Einstiegspunkte in den Markt. Die genaueren Signale werden auf den höheren Zeitrahmen gebildet. Es
FREE

Dieser Indikator wurde entwickelt, um die besten aller Candlestick-Umkehrmuster zu erkennen: Three Line Strike . Laut dem Bestseller-Autor und Candlestick-Guru Thomas Bullkowski hat dieses Muster eine Gewinnquote zwischen 65% und 84% . Diese KOSTENLOSE Version des Scanners scannt nur EURUSD und GBPUSD. Die Vollversion des Scanners finden Sie hier: Three Line Strike Scanner 30 Instrumente Dieser Indikator scannt für Sie bis zu 30 Instrumente (Forex, Indizes oder Rohstoffe) auf bis zu 8 Zeitrahmen
FREE

Universelle, sehr einfache, aber zuverlässige Handelsstrategie zum Abfangen von Pullbacks nach einem starken Impuls. Geeignet für Forex, Aktien und Binäre Optionen. Je höher der TF, desto genauer die Signale, aber weniger häufige Einstiege. Es kann als Einstieg verwendet werden, um auf einem (zwei) Balken zu arbeiten, sowie um ein kleines Raster von 3-5 Knien mit oder ohne Martingal aufzubauen. Für Binäre Optionen nur Verfallszeit. Der Indikator hat Alarme, Push-Benachrichtigungen, E-Mail-Benach
FREE

Dieser Indikator zeigt grafisch Gewinn ($), Risiko/Belohnung und % des Risikos nach SL&TP Offene Aufträge auf dem aktuellen Symbol. Wenn Sie Orders auf dem aktuellen Symbol öffnen und StopLoss und TakeProfit setzen, berechnet dieser Indikator automatisch Risiko/Belohnung und berechnet % Risiko des Aktienkontos, dass Ihre Order StopLoss bekommt. Wenn Sie mit mehreren Symbolen gleichzeitig handeln, können Sie den Indikator für jedes Symbol separat installieren und die entsprechenden Berechnungen f
FREE

Trendfinder SMA mit Zone und Warnung sind farbige Kerzen, die den Trend auf der Grundlage von zwei SMA als Signal und zwei SMA als Kauf- und Verkaufszone sowie der Neigung des langsamen gleitenden Durchschnitts anzeigen. Dieser Indikator zeigt Ihnen den Farbwechsel auf dem nächsten Balken auf der Bestätigungskerze an und gibt eine Warnung bei Kauf- und Verkaufssignalen, wenn er in die Kauf- und Verkaufszone eintritt und wenn der Markt die Kauf- oder Verkaufszonen als Unterstützung oder Widersta
FREE
Corretora recomendada para usar esse indicador: https://tinyurl.com/5ftaha7c Indikator, der die Kerze in Phasen großer Bewegung auf dem Markt anzeigt. Sobald sich der Markt bewegt, wird die Kerze in die Höhe schnellen. Gültig für alle Märkte und alle Zeitrahmen. S EHEN SIE SICH UNSERE ERGEBNISSE AUF INSTAGRAM AN: https://www.instagram.com/diogo.cansi/ TELEGRAM GROUP =. https://t.me/robosdsc Mehr Informationen per E-Mail dscinvestimentos@gmail.com oder per Whatsapp 55-991372299
FREE
Einfaches Dashboard zum Anzeigen des ATR-Werts über mehrere Zeiträume hinweg, kein Klicken auf einen Zeitrahmen erforderlich, wir können die Übersicht über ATR schneller sehen.
Unterstützen Sie die Änderung des Werts der ATR-Periode.
Gratis herunterladen!
Wir haben bereits über den Strategy Tester getestet, nichts auszusetzen.
Wenn Sie etwas falsch gefunden haben, schreiben Sie einfach den Kommentar unten oder kontaktieren Sie mich auf der Website: http://www.thanksmybot.com
E-Mail: gmail@
FREE

Einführung Dieser Indikator basiert auf durchschnittlichen Preis-/Maximalkursbewegungen und verwendet gleitende Bollinger Bänder und gleitende Durchschnitte.
Der Vorteil, ihn mit IHRER eigenen Analyse zu verwenden, wird potentielle Unterstützungen und Widerstände bestätigen, während er mit Ihrer Analyse harmoniert
Der Indikator ist nicht nachzeichnend
Und zusammen mit unserem speziellen Trend-METER, der sich mit den Bedingungen eines Bullen- oder Bären-Trends ändert....
Empfohlene Zeitra
FREE

Der Standard-RSI-Indikator ist sehr hilfreich, wenn es darum geht, überkaufte oder überverkaufte Bereiche während einer Flaute zu identifizieren, gibt aber viele falsche Signale, wenn sich der Markt in einem Trend befindet. Zum Beispiel: Während eines Aufwärtstrends geht der Standardindikator oft in den "überverkauften" Bereich und extrem selten (meistens, wenn der Trend bereits beendet ist) in den "überkauften" Bereich. Dieser Indikator berücksichtigt die Trendbewegung und kann mit den gewählte
FREE

Momentum Jurik ist ein innovativer Indikator, der Ihre Forex-Handelsstrategie optimiert, indem er benutzerdefinierte gleitende Durchschnitte auf Basis des Momentum-Indikators in den MetaTrader 4-Indikator Momentum integriert.
Die gleitenden Durchschnitte von Jurik sind bekannt für ihre Präzision und Zuverlässigkeit bei der Analyse von Kursbewegungen auf dem Devisenmarkt. Sie bieten Händlern eine glattere Darstellung des Kursgeschehens, reduzieren das Rauschen und bieten klarere Signale zur Erk
FREE

Der MP-Preisänderungsindikator ist ein Werkzeug zur Berechnung der prozentualen Preisbewegung. Der Wert dieses Indikators kann so eingestellt werden, dass er die prozentuale Preisänderung innerhalb bestimmter Zeitspannen anzeigt. Dieser Indikator ist ein leistungsfähiges Instrument, wenn er zusammen mit anderen Indikatoren wie ATR und ADR verwendet wird, um Preisschwankungen und Toleranz in verschiedenen Strategien zu verstehen. ___________________________________________________________________
FREE

Was ist ein Tool? Dieser Indikator dient zum Vergleich von 8 Hauptwährungen aus 28 Paaren und mehreren Zeitrahmen und berechnet eine Stärkebewertung von 0-100. Wie zu verwenden Setzen Sie den Indikator auf ein beliebiges Paar und einen beliebigen Zeitrahmen, und geben Sie nur den Wert der X-Y-Position ein, der im Diagramm angezeigt werden soll. Pair : Any Timeframe : Any Input Parameter Start X Position : Value of X on chart Start Y Position : Value of Y on chart Visit my products Target
FREE
Der RSI S-RoC-Indikator unterscheidet sich vom Standard-RSI dadurch, dass er bei der Berechnung der Werte die Veränderungsrate des Kurses berücksichtigt. Wenn sich der Kurs in einem Trend bewegt, erzeugt der Indikator gute Einstiegssignale, wenn der Kurs seine Niveaus berührt. Die Level-Werte können in den Einstellungen des Indikators konfiguriert werden. Sie können auch direkt im Indikatorfenster geändert und angepasst werden. Sie können auf einem Chart auch Signallinien festlegen. Sobald diese
FREE
Hochgradig konfigurierbarer Rate of Change (ROC)-Indikator. Merkmale: Hochgradig anpassbare Alarmfunktionen (bei Levels, Kreuzen, Richtungsänderungen per E-Mail, Push, Sound, Popup) Multi-Timeframe-Fähigkeit Farbanpassung (bei Levels, Kreuzen, Richtungsänderungen) Optionen für lineare Interpolation und Histogramm-Modus Funktioniert im Strategie-Tester im Multi-Timeframe-Modus (auch am Wochenende ohne Ticks) Einstellbare Levels Parameter:
ROC Timeframe: Sie können den aktuellen oder einen höhere
FREE

Dieser Indikator verwandelt die Farben Ihrer Kerzen in eine trendorientierte Farbe, die 4 verschiedene Farben auf der Grundlage von zwei gleitenden Durchschnitten und der Steigung des langsamen gleitenden Durchschnitts anzeigt. Ein sehr leistungsfähiger Indikator für alle Zeiträume, der Ihnen die Richtung des Trends anzeigt, um Ihre Trades zu bestätigen.
Grün: Bullisch
Dunkelgrün: Bullisch Schwach
Hellrot: Bärisch Schwach
Rot: Bärisch
Für weitere Informationen:
h ttps:// linktr.ee/trader_
FREE
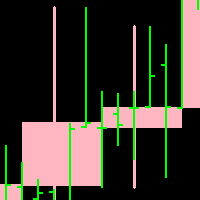
Candleline: Kerzenlinien-Indikator. Zeichnet die Kerzenlinie der angegebenen Periode auf dem aktuellen Chart. Darüber hinaus wird die neue Kerzenlinie mit der Kerzenlinie des aktuellen Charts überlagert.
Hinweis: Die Periode des aktuellen Charts muss kleiner sein als die Periode der zu zeichnenden Kerzenlinie.
Für den spezifischen Effekt der selbstzeichnenden Kerzenlinie sehen Sie bitte das beigefügte Bild unten. Parameter: 1.timeFrame; 2. NumberOfBar; 3.up candle line Farbe; 4.down candle li
FREE

Dies ist ein Nachfrage- und Angebotsindikator mit mehreren Zeitrahmen für die MT4-Plattform. Sie können mehrere Zeitrahmen Nachfrage und Angebot Ebenen auf kleinere Zeitrahmen verwenden. Zusätzlich können Sie wählen, ob Sie jedes getestete Level löschen möchten. Sie haben schmale Bänder, d.h. Sie können das gesamte Nachfrage- und Angebotsniveau oder nur einen schmalen Abschnitt auswählen. Schließlich erhalten Sie auch Preisbereich für die Zonen. Fantastisch
FREE

Relative Strength Index Cross [RSI Cross] Eine Kombination von 2 RSI, um ein Crossover-Handels-Setup zu erstellen Eingabeparameter: Signalmodus: Setzen Sie ihn auf true, wenn Sie ihn in STAT (Signal Tester und Trader) einbinden wollen Pfeilverschiebung: Abstand zwischen der schnellen EMA-Linie und dem Pfeil im Chart Preislinienfilter schnelle RSI-Periode langsame RSI-Periode RSI-Preis-Methode oberes Preisniveau Preis unteres Niveau Die beste Einstellung für 4 Stunden EURUSD finden Sie in diesem
FREE

Der Indikator zeigt gleitende Durchschnitte auf einer bestimmten Anzahl von Balken an (Zählbalken für die Anzeige von MA ). Diese Art der Darstellung vereinfacht die Analyse, da das Diagramm nicht mit unnötigen Linien überfrachtet wird. Es gibt auch eine Textbeschriftung, die den aktuellen Preis des gleitenden Durchschnitts und den Zeitraum des Charts anzeigt. Hotkeys werden verwendet, um die Verwendung des Indikators zu vereinfachen.
Einstellungen des Indikators: Gleitender Durchschnitt #1 -
FREE
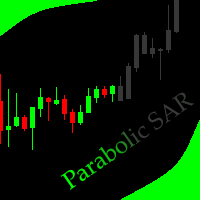
Dieser Indikator ermöglicht das Ausblenden des Parabolic SAR (auf allen MT4-Zeitfenstern) ab einem vom Benutzer definierten Datum, mit einer vertikalen Linie (Alone) oder einem Panel (mit "Hidden Candles"). Indikator Eingaben: Schritt Höchstwert Farbe Breite Informationen zum "Parabolic SAR" Indikator finden Sie hier: https: //www.metatrader4.com/en/trading-platform/help/analytics/tech_indicators/parabolic ************************************************************* Hey Trader!!! Gebt mir eure
FREE

Der R Var Moving Average Indicator ist ein Trendfolgeindikator, der für eingefleischte Trendfolger entwickelt wurde.
Es ist ein sehr beliebter Devisenhandelsindikator unter Aktienhändlern sowie Rohstoffhändlern, und seine Popularität ergibt sich aus seiner Fähigkeit, seinen Benutzern echte Signale zum Geldverdienen zu liefern.
Der Indikator besteht aus grünen und roten Punkten, die auf einer Sienna-Linie platziert sind. Der grüne Punkt zeigt auf ein bullisches Signal, während der rote Punkt e
FREE

Symbol Cycler ist ein leichtgewichtiges Dienstprogramm für den Chart, mit dem Sie mit zwei einfachen Pfeiltasten () schnell zwischen den Symbolen in Ihrer Market Watch Liste wechseln können. Mit einem einzigen Klick können Sie vorwärts oder rückwärts durch Ihre vordefinierten Symbole blättern, ohne den Chart zu verlassen. Hauptmerkmale: Symbolwechsel mit einem Klick aus dem Chart heraus Funktioniert mit Ihrer Market Watch Liste Die Schaltflächen können in jeder Chartecke oder sogar in der Mi
FREE
Hochgradig konfigurierbarer Average True Range (ATR) Indikator.
Merkmale: Hochgradig anpassbare Alarmfunktionen (bei Levels, Kreuzen, Richtungsänderungen per E-Mail, Push, Sound, Popup) Multi-Timeframe-Fähigkeit Farbanpassung (bei Pegeln, Kreuzen, Richtungsänderungen) Optionen für lineare Interpolation und Histogramm-Modus Funktioniert im Strategie-Tester im Multi-Timeframe-Modus (auch am Wochenende ohne Ticks) Einstellbare Levels Parameter:
ATR-Zeitrahmen: Sie können den unteren/höheren Zeitr
FREE

SpreadChartOscillator ist ein Indikator, der die Spread-Linie des Symbols im Unterfenster des Oszillators anzeigt. In den Parametern kann ein anderes Symbol angegeben werden, von dem aus die Spread-Linie ausgestrahlt werden soll. Wenn der Parameter "Symbol" leer gelassen wird, wird die Spread-Linie von dem aktuellen Symbol, auf das der Indikator eingestellt ist, angezeigt. Dieses Tool ist ideal für Händler, die die Spread-Dynamik im Oszillatorformat sehen und sich vor einem Einstieg in den Mark
FREE
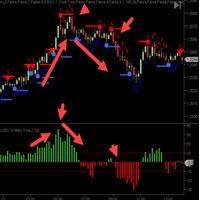
Der CycleTraderPro Close Strength Value Indicator misst die Entfernung vom ÖFFNEN eines neuen Balkens bis zum CLOSE des Balkens.
Eingabe -
Länge = 10 Standard
Wir addieren diese Werte zusammen und setzen die Längeneinstellung zurück.
Wenn der 1. Takt plus 10 Ticks und der nächste Takt minus 7 Ticks wäre, würde dies +3 sein
Es gibt zwei Möglichkeiten, den Close-Strength-Wert zu handeln:
1. Handel in Richtung niedrigerer Hochs und niedrigerer Tiefs und umgekehrt für Käufe, höhere Hochs und h
FREE

Panda Oscillator ist ein neuer Indikator für das Scalping des Autors.
Ein Indikator, der Signale basierend auf den Messwerten eines ganzen Komplexes von Standard- und urheberrechtlich geschützten Werkzeugen gibt.
Hauptmerkmale von Panda Oscillator: analytische Funktion
Kann für alle Währungspaare und Zeitrahmen verwendet werden; Der Indikator wird nicht neu gezeichnet; Ideal als Ergänzung zu anderen Indikatoren; Grafische Funktionen
Nimmt den minimalen Platz in der Grafik ein; Flexible Ti
FREE

Dieses Tool hilft Ihnen, die Situation zu anderen Zeiten zu kontrollieren und sie bei der Analyse des Marktes in Ihre Trades einzubeziehen Dieses Tool scannt den Markt und meldet die Bewegung des Marktes zu verschiedenen Zeiten Mit Hilfe dieses Tools können Sie viele falsche Analysen verhindern Mit Hilfe dieses Tools können Sie sich in kürzester Zeit einen Überblick über den Markt verschaffen und Ihre Zeit sparen
FREE
Der JagzFX Gap-Indikator ist Ihr aufmerksamer Begleiter, der den Markt mit Präzision scannt und Sie auf Gaps aufmerksam macht, sobald sich eine neue Kerze bildet. Legen Sie die gewünschte Gap-Größe fest, und der Indikator wird sowohl gefüllte als auch nicht gefüllte Gaps für jedes Symbol und jeden Zeitrahmen anzeigen. Durch die Analyse des Vorhandenseins von nicht gefüllten Gaps erhalten Sie wertvolle Einblicke in das Marktverhalten und können so fundiertere Handelsentscheidungen treffen. Kombin
FREE
Rectangle Control ist ein einfacher Indikator, der ein Panel zum Zeichnen von Rechtecken auf dem Chart mit verschiedenen Einstellungen anzeigt. Er ist praktisch für diejenigen, die Unterstützungs- und Widerstandszonen auf dem Chart zeichnen. Das Rechteck kann mit oder ohne Füllung, in unterschiedlicher Dicke und Farbe gezeichnet werden. Sie können auch den Zeitrahmen wählen, in dem das gezeichnete Rechteck angezeigt werden soll. Wenn die Schaltfläche "Alarm" gedrückt wird, wird ein Alarm ausgelö
FREE
Bitte teilen Sie einen Kommentar oder eine Bewertung zur Verbesserung Hauptfunktion : Die Startfunktion wird bei jedem neuen Tick aufgerufen. Sie führt die Hauptlogik des Indikators aus: Sie initialisiert Arrays zum Speichern der täglichen Höchst- und Tiefstkurse. Sie ändert die Größe und initialisiert diese Arrays auf der Grundlage der durch den Eingabeparameter DAYS festgelegten Anzahl von Tagen. Er kopiert die täglichen Höchst- und Tiefstkurse in diese Arrays. Es findet den höchsten Höchst-
FREE

Currency Explorer ist das absolute Werkzeug für Händler, die mit quantifizierter Sicherheit die Stärke und Schwäche jeder Währung kennen und diese mit Hilfe geeigneter Strategien handeln möchten. Unsere maschinellen Lernmodelle laufen und liefern die Stärke/Schwäche jeder Währung auf der Grundlage mehrerer Faktoren neben der Kursentwicklung. Es liefert dem Händler ein QUANTIFIED Ergebnis für die Stärke der 8 beliebtesten und wichtigsten Währungen (EUR, USD, JPY, GBP, AUD, NZD, CAD und CHF) mit e
FREE
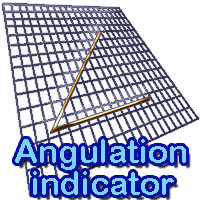
Der Indikator zeichnet Angulationslinien auf einem Diagramm. Diese Linien können bei der Entscheidung helfen, ob man in den Markt einsteigen oder ihm fernbleiben soll. Er wird verwendet, um das in der Strategie von Bill Williams beschriebene Signal "The First Wise Man" zu filtern. Die Winkelung in diesem Indikator wird für jeden Balken angezeigt, der nach dem Überschreiten des Alligatormundes gebildet wird (nicht nur für Umkehrungen). Einstellungen: Angulationslinien anzeigen . Info anzeigen - z
FREE

Der Indikator ist ein 15-Minuten-Signalindikator für alle Arten von Händlern. Das bedeutet, dass Sie mit zwei verschiedenen Signalen in einem Indikator viele Gewinne erzielen können.
HINWEIS: Beide Indikatoren sind Kanäle, die das gleiche Ergebnis erzielen. ROTER PFEIL - Verkaufssignal BLAUER PFEIL -- Kaufsignal
Kaufen Sie jetzt und werden Sie Teil unserer Community. Wir bieten Standard-Chart-Setups sowohl für Anfänger als auch für fortgeschrittene Trader. Handeln Sie mit Leichtigkeit!
FREE

Dieser Indikator ermöglicht es, Ichimoku Kinko Hyo (auf allen MT4-Zeitrahmen) ab einem vom Benutzer definierten Datum mit einer vertikalen Linie (Alone) oder einem Panel (mit "Hidden Candles") auszublenden. Indikator Eingaben: Tenkan-sen Kijun-sen Senkou-Spanne B Informationen zum Indikator "Ichimoku Kinko Hyo" finden Sie hier: https: //www.metatrader4.com/en/trading-platform/help/analytics/tech_indicators/ichimoku ************************************************************* Hey Trader!!! Gebt
FREE

Es ist ein weiterer einfacher Informationsindikator. Dieser Indikator zeigt den aktuellen Spread eines Finanzinstruments und den Wert eines Punktes bei einem Volumen von 0,10 Lot.
Über den Spread Der Spread ist die Differenz zwischen dem Brief- und dem Geldkurs eines Vermögenswerts an der Börse oder an der Währung. Beziehen wir uns auf die Zentralbanken und den Währungsumtausch in diesen Banken, um zu verstehen, warum der Spread beim Währungshandel so wichtig ist. In Zentralbanken sehen wir imm
FREE

Fibonacci Bands Indicator für Metatrader 4. Dieser Indikator funktioniert ähnlich wie die bekannten klassischen Bollinger Bänder, verwendet aber anstelle der Standardabweichung die Fibonacci-Zahlen und die ATR (Average True Range) zur Darstellung der Bänder. Er kann verwendet werden, um Unterstützungs- und Widerstandsniveaus darzustellen, die in kurzfristigen Scalping- und Swing-Trading-Systemen verwendet werden können. Die Bänder des Indikators werden wie folgt berechnet: Mittellinie : n-period
FREE
Hochgradig konfigurierbare Demarker-Anzeige.
Merkmale: Hochgradig anpassbare Alarmfunktionen (bei Levels, Kreuzen, Richtungsänderungen per E-Mail, Push, Sound, Popup) Multi-Timeframe-Fähigkeit Farbanpassung (bei Pegeln, Kreuzen, Richtungsänderungen) Optionen für lineare Interpolation und Histogramm-Modus Funktioniert im Strategie-Tester im Multi-Timeframe-Modus (auch am Wochenende ohne Ticks) Einstellbare Levels Parameter:
Demarker Timeframe: Sie können den unteren/höheren Zeitrahmen für Demar
FREE
Parabolic Sar Easy Mode, Remake der ursprünglichen p.sar Indikator macht es einfacher zu lesen für Anfänger Händler und experimentiert Händler suchen, um die Zeit zu analysieren die Charts, können Sie Ihre eigene Strategie modificating die Perioden und fusioning es mit anderen Indikatoren wie RSI, Stochastik oder was Sie wollen, seine ein Indikator läuft besser auf hohe Zeit-Charts wie H4 oder D1.
FREE
Dieser Indikator ermöglicht es, den MACD-Oszillator (auf allen MT4-Zeitrahmen) ab einem vom Benutzer definierten Datum mit einer vertikalen Linie (Alone) oder einem Panel (mit "Hidden Candles") auszublenden. Indikator Eingaben: Schnelle EMA-Periode Langsame EMA-Periode Signal SMA Zeitraum Anwenden auf Informationen zum Indikator "MACD" finden Sie hier: https: //www.metatrader4.com/en/trading-platform/help/analytics/tech_indicators/macd ************************************************************
FREE

please leave 5 stars to me Ein Unterstützungsniveau ist ein Niveau, auf dem der Kurs beim Fallen tendenziell Unterstützung findet. Das bedeutet, dass der Kurs eher an diesem Niveau "abprallt", als dass er es durchbricht. Sobald der Kurs dieses Niveau jedoch um einen Betrag durchbrochen hat, der über ein gewisses Maß hinausgeht, wird er wahrscheinlich weiter fallen, bis er auf ein anderes Unterstützungsniveau trifft. Ein Widerstandsniveau ist das Gegenteil eines Unterstützungsniveaus. Es ist der
FREE

Der Indikator zeigt die Handelsstatistiken des analysierten Marktsignals im Chart an. Die Signaltransaktionsdaten werden in einer Excel-Datei (csv) dargestellt und können aus dem Signal>Handelsverlauf ( Export to CSV: History ) entnommen werden . Die kopierte Datei muss im Verzeichnis MT4>Datei>Datenordner öffnen>MQL4>Dateien gespeichert werden. Verfügbares Farbmanagement und Schriftausgabe. Wenn die Währungsnamen auf dem Signal- und dem Benutzerkonto unterschiedlich sind, verwenden Sie die Para
FREE

Was ist Squeeze? Eine Kontraktion der Bollinger-Bänder innerhalb des Keltner-Kanals spiegelt einen Markt wider, der eine Pause einlegt und sich konsolidiert, und wird in der Regel als potenzieller Frühindikator für eine nachfolgende Richtungsbewegung oder eine große Schwingungsbewegung angesehen. Wenn die Bollinger-Bänder den Keltner-Kanal verlassen, bedeutet dies, dass die Märkte von einer niedrigen Volatilität zu einer hohen Volatilität übergehen - etwas, wonach alle Händler suchen. Unterschie
FREE

Es handelt sich um einen Trendfolgeindikator, der optimale Einstiegspunkte in Richtung eines Trends mit einem objektiven Stop-Loss zur Steuerung des Handels identifiziert. Der Indikator ermöglicht es Ihnen, einen Trend frühzeitig zu erkennen und zu verfolgen. Der Indikator zeichnet Widerstandslinien, wenn er einen Aufwärtstrend erkennt, und Unterstützungslinien, wenn er einen Abwärtstrend auf dem Chart erkennt. Wenn diese Niveaus durchbrochen werden, können Sie die Trendrichtung und das Momentum
FREE

Beschreibung Dies ist ein Indikator, der Marktstimmungen auf einem linearen Diagramm im Fenster des Hauptfinanzinstruments einfärbt. Er ist nützlich, um Unterstützungs- und Widerstandsniveaus zu bestimmen. Zweck Der Indikator kann für den manuellen oder automatisierten Handel als Teil eines Expert Advisors verwendet werden. Für den automatisierten Handel können Sie Werte von Indikatorpuffern des Typs Double verwenden: Steigende Linie - Puffer 0, darf nicht gleich EMPTY_VALUE sein. fallende Linie
FREE

Dark & Light Themes für MT4.
Der Indikator Dark & Light Themes hilft Ihnen, die MT4-Chartanzeige zwischen dunklen und hellen Farbschemata zu wechseln. Er enthält auch ein Wasserzeichen, das das aktuelle Währungspaar (Symbol) und den aktiven Zeitrahmen anzeigt.
Diese einfache und saubere Schnittstelle macht es für Händler bequemer, Charts mit jedem Indikator zu analysieren.
FXDragunov Indonesia.
FREE
Squeeze- und Momentum-Indikator Indikator - Version 1.0
Der Squeeze- und Momentum-Indikator wurde entwickelt, um Perioden niedriger Volatilität, gefolgt von potenziellen Ausdehnungen der Marktaktivität, hervorzuheben. Er kombiniert Bollinger Bänder und Keltner-Kanäle, um "Squeeze"-Bedingungen zu identifizieren, und verwendet ein Momentum-Histogramm, um die wahrscheinliche Richtung der Bewegung abzuschätzen, sobald die Volatilität zunimmt.
Wie es funktioniert: Ein Squeeze tritt auf, wenn sich d
FREE

Ein scrollender Marktticker, der Preisänderungen aller Symbole in der Market Watch-Liste anzeigt. Bietet eine einfache Momentaufnahme der Symbolpreise und scrollt automatisch weiter, während Sie handeln und den Chart analysieren.
Die Optionen umfassen: - MTF, d.h. Sie können wählen, ob Sie die Preisänderungen des Tages- oder des Stundencharts anzeigen möchten. - Verwendung der Live-Kerze oder der kürzlich abgeschlossenen Kerze - Schriftart und Hintergrundfärbung
FREE

Der MP Gradient Adaptive RSI Oszillator verwendet AMA zusammen mit dem Basis-RSI, um die Retracements mit minimaler Verzögerung abzudecken. Eine Triggerlinie, die den Oszillator kreuzt, bietet dem Händler einen Einstiegspunkt.
Einstellungen : RSI-Periode: Periode des Oszillators Empfindlichkeit des Oszillators: steuert die Empfindlichkeit des Oszillators gegenüber Rücksetzern, wobei höhere Werte die Empfindlichkeit gegenüber Rücksetzern minimieren. Angewandter RSI-Kurs: Quelleingang des Indika
FREE
Spread Sekanas: Die wahren Kosten für Ihren Handel Hören Sie auf, mit Pips und Punkten zu spekulieren. Mit dem Spread Sekanas-Indikator sehen Sie die tatsächlichen , proportionalen Kosten des Spreads. Der traditionelle Spread, der in Pips gemessen wird, ist irreführend. Ein Spread von 2 Pips auf EUR/USD ist etwas völlig anderes als ein Spread von 2 Pips auf GBP/JPY oder ein Spread von 2 $ auf Gold. Dies macht es unmöglich, Ihre tatsächlichen Handelskosten für verschiedene Instrumente konsistent
FREE

Market Dashboard FREE Indicator gibt Ihnen erweiterte Informationen über Ihre ausgewählten Symbole in MarketWatch
Merkmale
Tägliche Preisbewegungen (M1 - D1) RSI-Werte mit Hervorhebungsfunktion für Ihren aktuellen Zeitrahmen & H1 & H4 Gewinn pro Symbol und gehandelte Lots (Kauf & Verkauf) EMA 5 - 100 basierend auf dem gewählten Zeitraum Swap Information (welche Richtung ist positiv) FIBO Info & Tracking (hervorgehobene FIBO Levels in der Nähe des aktuellen Preises - basierend auf der gewählten
FREE

Meistern Sie den Devisenmarkt mit einer leistungsstarken Währungsanalyse! LIVE-ÜBERWACHUNG VON SIGNALEN MIT CCY POWER
Bringen Sie Ihren Devisenhandel auf die nächste Stufe mit einem umfassenden und vollständig anpassbaren Tool, das entwickelt wurde, um Währungstrends zu analysieren, starke und schwache Währungen zu identifizieren und Ihren Entscheidungsprozess zu verbessern. Hauptmerkmale: Multi-Timeframe-Analyse
Analysieren Sie die Währungsstärke vom kurzfristigen (1-Minuten-) Scal
FREE
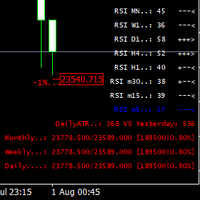
Dieser Indikator wurde hauptsächlich für den persönlichen Gebrauch erstellt. Ich beschloss, die letzten 3 Balken des RSI nachzuschlagen, es ist gut für Scalping oder für den wöchentlichen Handel und sieht aus wie universelle fx-toy. Im Menü können Sie die täglichen prozentualen Gewinne anzeigen lassen, das ist gut für Kryptowährungen, wie für mich, wöchentliche und monatliche Gewinne sind ebenfalls enthalten. Short ATR hilft zu bestimmen, wann der Preis gestoppt wurde und Eingang für Puls Pumpe
FREE

Basierend auf der Aktiensoftware Gold Line Indikator angepasst. Die Parameterwerte können nach Bedarf angepasst werden. Spezifische Regeln für die Verwendung finden Sie in der Anleitung der jeweiligen Aktiensoftware. ////////////////////////////////////////////////////////////////////////////////////////// // Der Quellcode der Aktienformel lautet wie folgt:
VAR1:=(HIGH+LOW+OPEN+CLOSE)/4;
Gold Line:EMA(3*VAR1-2*SMA(VAR1,2,1),13); ////////////////////////////////////////////////////////////////
FREE

Der Indikator hat noch ein paar Bugs, ist aber testbereit.
Dies ist mein erster Indikator, der Einstiegs- und Ausstiegspunkte bestimmt. Der Einstiegspunkt basiert auf dem Durchbrechen der Spitzen, die durch einen Kanal bestimmt werden, der Hochs und Tiefs anzeigt (unsichtbare Kanäle). TP1 ist ein wahrscheinliches Ziel, bei dem die meisten Positionen geschlossen werden können. Der Kanal, der die Eröffnung und Schließung von Positionen bestimmt, basiert auf verschiedenen Annahmen. Die rote Stop-L
FREE

Der Indikator ermöglicht Ihnen den Handel mit binären Optionen. Der empfohlene Zeitrahmen ist М1 und die Verfallszeit ist 1 Minute. Der Indikator ist für den automatischen und manuellen Handel geeignet. Ein mögliches Signal wird als ein Pfeil über/unter einer Kerze angegeben. Sie sollten warten, bis die Kerze geschlossen ist! Die Pfeile werden nicht neu gezeichnet Handelssitzungen: TOKYO-Abschnitt (halbes Ende) und LONDON-Abschnitt (erste Hälfte) Währungspaare: EUR/USD Arbeits-Zeitrahmen: M1 Ver
FREE

TREND MATE ist ein nützlicher Indikator, der Sie bei Ihrer Entscheidung unterstützt, entsprechend dem aktuellen Trend zu handeln . Es ist möglich, einen Alarm und eine Push-Benachrichtigung zu konfigurieren, die Sie beim Eintritt in die erste Kerze eines Bullen-/Bärentrends erhalten. Wenn Sie diesen Indikator für einen EA verwenden möchten, benutzen Sie die Funktion iCustom wie folgt:
DOWNTREND : iCustom(NULL,0,"Trend_Mate",0,0) . Bei einem Abwärtstrend ist das Ergebnis "1", sonst "0".
UPTREN
FREE

Modifizierter Parabolic SAR: Ihr zuverlässiger Assistent am Markt Diese erweiterte Version des Parabolic SAR-Indikators zeigt effektiv die Trendrichtung an und kann eine wertvolle Ergänzung zu Ihrer Handelsstrategie sein. Vorteile: Reflexion der Trendrichtung: Der Indikator zeigt die Trendrichtung des Marktes deutlich an und hilft Ihnen so, fundierte Handelsentscheidungen zu treffen. Signal-Filterung: Der Indikator dient als hervorragender Filter zur Ergänzung Ihrer Strategie und hilft Ihnen, f
FREE
Dieses Produkt ist kostenlos und kann gerne für Ihre Zwecke verwendet werden!
Ich freue mich sehr über Ihr positives 5-Sterne-Feedback! Vielen Dank!
// Hervorragende Handelsroboter und Indikatoren finden Sie hier: https://www.mql5.com/en/users/def1380/seller
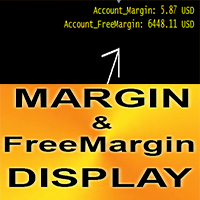
Der Crypto_Forex-Indikator „Margin-Anzeige“ für MT4 ist ein hervorragendes zusätzliches Handelstool.
– Dieser Indikator zeigt die aktuelle Marge und die freie Marge des Kontos an. – Anzeigewerte können in jeder Ecke des Charts platziert
FREE
Bar Timer Percent Der Indikator zeigt den Zeitpunkt der Bildung des aktuellen Balkens in Prozent an.
Anzeigeeinstellungen color_back1 - Hintergrundfarbe # 1 color_flat1 - Rahmenfarbe für Hintergrund # 1 color_back2 - Hintergrundfarbe #2 Alert_Percent - Prozentwert für akustische Warnung Sound_file - der Name der Sounddatei, die benutzerdefinierte Sounddatei muss sich im Terminalordner unter dem Soundordner befinden und die Erweiterung haben - .wav
FREE

Der Indikator zeigt Signale nach der Strategie von Bill Williams auf dem Chart an . Die Demoversion des Indikators hat die gleichen Funktionen wie die kostenpflichtige Version , außer dass sie nur auf einem Demokonto funktionieren kann .
Das Signal "First Wise Man" entsteht, wenn ein divergenter Balken mit Angulation entsteht. Bullish divergent bar - mit niedrigerem Minimum und Schlusskurs in der oberen Hälfte. Bearish divergent bar - höheres Maximum und der Schlusskurs in der unteren Hälfte. E
FREE

Dies ist die Demo-Version von PipsFactoryMonthly Dieser Indikator hängt von den Höchst- und Tiefstkursen der Währungen im letzten Monat ab und dann habe ich einige geheime Gleichungen erstellt, um 10 Linien zu zeichnen.
Eigenschaften Sie werden wissen, zu welchem genauen Preis Sie in den Markt einsteigen sollten. Sie werden wissen, wann Sie aus dem Markt aussteigen sollten. Sie werden wissen, was Sie im Markt tun sollten: Kaufen Verkaufen Gewinn mitnehmen und es gibt 3 Ebenen, um Ihren Gewinn m
FREE

Currency Switcher-Indikator
Der "Currency Switcher"-Indikator wurde für MetaTrader 4 entwickelt und ermöglicht es dem Benutzer, schnell zwischen verschiedenen Währungspaaren und anderen Handelsinstrumenten direkt im Chartfenster zu wechseln. Dieser Indikator erstellt eine Reihe von Schaltflächen auf dem Chart, die jeweils mit einem bestimmten Handelssymbol verbunden sind. Der Benutzer kann auf diese Schaltflächen klicken, um das aktuelle Chartsymbol zu ändern.
Hauptmerkmale
- **Symbolkategor
FREE
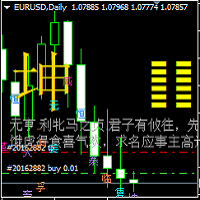
Zhouyi Yijing 64 Hexagramme Hexagrammwechselanzeige
1. Beschreibung des Hexagramm-Indikators: (1) Dieser Indikator mit 64 Hexagrammen basiert auf dem Yin-Yang-Transformationsgedanken der "Buch der Wandlungen"-Philosophie der alten chinesischen Kultur und integriert die Ergebnisse des Long- und Short-Spiels jeder Kerzen-K-Linien-Periode des K-Linien-Charts für den Finanzhandel unter Verwendung der ältesten Vorhersage-Codierungsmethode Chinas, in Form der 64 Hexagramme des Buches der Wandlungen,
FREE
Der MetaTrader Market ist eine einzigartige Plattform für den Verkauf von Robotern und technischen Indikatoren.
Das Merkblatt für Nutzer der MQL5.community informiert Sie über weitere Möglichkeiten: nur bei uns können Trader Handelssignale kopieren, Programme bei Freiberuflern bestellen, Zahlungen über das Handelssystem automatisch tätigen sowie das MQL5 Cloud Network nutzen.
Sie verpassen Handelsmöglichkeiten:
- Freie Handelsapplikationen
- Über 8.000 Signale zum Kopieren
- Wirtschaftsnachrichten für die Lage an den Finanzmärkte
Registrierung
Einloggen
Wenn Sie kein Benutzerkonto haben, registrieren Sie sich
Erlauben Sie die Verwendung von Cookies, um sich auf der Website MQL5.com anzumelden.
Bitte aktivieren Sie die notwendige Einstellung in Ihrem Browser, da Sie sich sonst nicht einloggen können.