Technische Indikatoren für den MetaTrader 4 - 110
KT Bollinger Shots arbeitet mit einer auffälligen Mischung aus dem Slingshot-Muster und dem Mean-Reversion-Phänomen, das auf die Finanzmärkte angewendet wird.
Darüber hinaus wird ein mathematischer Algorithmus mit variabler Abweichung verwendet, um die Signale des Indikators auf einer anderen Ebene fein abzustimmen.
Gewinnender Handel: Wenn der Preis nach einem Signal das mittlere Band im Gewinn berührt, wird er als Gewinner betrachtet. Verlorener Handel: Wenn der Kurs nach einem Signal das e
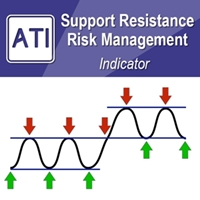
Einführung in das Risikomanagement von Support Resistance Support Resistance ist die vertrauenswürdigste technische Analyse. Allerdings wird das Risikomanagement für die Unterstützung und den Widerstand nicht oft praktiziert. Daher stellen wir eine effektive Risikomanagement-Methode für den Unterstützungs- und Widerstandshändler vor. In dem Buch: Scientific Guide To Price Action and Pattern Trading (Wisdom of Trend, Cycle, and Fractal Wave) wird beschrieben, wie man Support Resistance, Fibonacci

Der Indikator signalisiert das Auftreten eines möglichen Divergenzbalkens auf der Grundlage der Form des Balkens ohne Erkennung der Winkelung. Ein zinsbullischer Divergenzbalken ist ein Balken, der in seiner oberen Hälfte schließt (je höher, desto besser), ein niedrigeres Minimum als der vorhergehende Balken aufweist und stark vom Alligator-Indikator abfällt. Ein bärisch divergierender Balken ist ein Balken, der in seiner unteren Hälfte schließt (je niedriger, desto besser), einen höheren Höchst

Der Indikator signalisiert das Auftreten eines möglichen Divergenzbalkens anhand der Form des Balkens und seiner Standardabweichung vom Alligator-Indikator. Ein Aufwärtsdivergent-Balken ist ein Balken, der in seiner oberen Hälfte schließt (je höher, desto besser), ein niedrigeres Minimum als der vorherige Balken aufweist und stark vom Alligator abweicht. Ein bärisch divergierender Balken ist ein Balken, der in seiner unteren Hälfte schließt (je niedriger, desto besser), einen höheren Höchststand
PAX BDB Trade Chaos System von Bill Williams (Bearish/Bullish divergent bar)
Eines der Signale des "Trade Chaos"-Systems von Bill Williams. (Erster Wiseman) Wenn sich der Balken vom "Alligator"-Indikator wegbewegt und der Awesome Oscillator-Indikator eine Divergenz aufweist, zeigt dies einen potenziellen Punkt für eine Bewegungsänderung an. Er basiert auf der Eröffnung/Schließung des Balkens, der Position relativ zu den vorherigen, dem Alligator und dem AO. Beim Handel erfolgt der Einstieg am

Kontaktieren Sie mich nach der Bezahlung , damit ich Ihnen das Benutzerhandbuch PDF Datei. Volumen-Profil-Indikator Ein funktionelles und nützliches Werkzeug, das Ihren Handelsplan verbessern kann.
Dieser Indikator berechnet das Volumen in den Kursniveaus (typische Volumenindikatoren zeigen nur das Kerzenvolumen an).
Mit dem Volumen der Kursniveaus können Sie wichtige Bereiche identifizieren, die das Potenzial haben, umzukehren. Sie können auch das Volumen von Unterstützungs- und Widerstandsni

Scalping channel Indikator für die Richtung der Preisbewegung. Wo der Kanal hinschaut, bewegt sich der Preis dorthin. Wenn der Kanal nach unten zeigt und der Preis am oberen Rand des Kanals liegt, eröffnen wir einen Verkaufshandel. Wenn der Kanal nach oben schaut und der Preis am unteren Rand des Kanals liegt, eröffnen wir ein Kaufgeschäft. Dies ist eine einfache Scalping-Strategie für den Intraday-Handel in den Zeitrahmen M1, M5, M15, M30.
Jeder, der diesen Indikator kauft, erhält einen Scalp

Der Echtzeit-Indikator gibt Kauf- und Verkaufssignale an. Bei der Wahl der Richtung nach dem Haupttrend werden etwa 75-80% der Signale zum Gewinn ausgearbeitet. Absolut alle Signale bleiben auf dem Chart und ändern ihre Position nicht, so dass Sie die Funktion des Indikators sowohl auf der Geschichte als auch im Strategietester leicht testen können. Der Parameter Velocity ist für die Anzahl und Häufigkeit der Signale verantwortlich, der optimale Wert liegt zwischen 10 und 40, abhängig vom Arbei

Scalping Points Pro ist ein Indikator, der mögliche Preisumkehrpunkte auf dem Chart anzeigt und seine Signale nicht neu zeichnet. Außerdem sendet der Indikator Signale per E-Mail und Push an den Händler. Die Genauigkeit der Signale dieses Indikators beträgt etwa 92-94 % im M5-Zeitrahmen und mehr als 95 % im H1-Zeitrahmen. Somit ermöglicht dieser Indikator dem Händler, Trades genau zu eröffnen und weitere Preisbewegungen vorherzusagen.
Der Indikator zeichnet seine Signale nicht neu. Der Indika

Scalping Snake Pro ist ein einzigartiger Scalping-Indikator, der dem Trader die Momente der Preisumkehr anzeigt und nicht neu zeichnet. Im Gegensatz zu vielen anderen Indikatoren im Internet zeichnet dieser Indikator seine Werte nicht neu. Er zeichnet Signale auf dem allerersten Balken, was Ihnen erlaubt, nicht zu spät mit der Eröffnung von Geschäften zu sein. Dieser Indikator benachrichtigt den Händler per Telefon und E-Mail, wenn ein Signal erscheint. All diese Funktionen erhalten Sie für nur
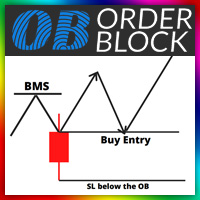
Ordensblock-Detektor: Der Orderblock-Detektor kann den Durchbruch der Marktstruktur automatisch erkennen. Nachdem der Trendrahmen durchbrochen wurde, kann der Orderblock-Bereich automatisch eingezeichnet werden. Um den OB-Bereich genauer zu zeichnen, finden wir auch automatisch die Kerze auf der linken und rechten Seite der ursprünglichen Kerze nach ihrem Handelsprinzip, und zeichnen einen genaueren OB-Bereich durch eine subtilere quantitative Regel Beurteilung. Futures : 1. Passen Sie die BMS-

Dieser Angebots- und Nachfragezonenindikator zeichnet die Zonen auf dem Chart und sendet Warnungen, wenn der Preis eine Zone erreicht oder durchbrochen hat. Es ist auch möglich, es zu verwenden, um über reguläre doppelte Tops/Bottoms anstelle von Zonen benachrichtigt zu werden. Es ist möglich, RSI-, Volumen- und Divergenzfilter zu verwenden, um nur die stärksten Setups herauszufiltern. In Kombination mit Ihren eigenen Regeln und Techniken ermöglicht Ihnen dieser Indikator, Ihr eigenes leistungss

Echter Angebots- und Nachfrageindikator - ermöglicht es Ihnen, die Position von Widerstands- und Unterstützungsniveaus in allen Zeitrahmen schnell zu bestimmen. Der Indikator wird für diejenigen nützlich sein, die technische Analysen in ihrem Handel verwenden. Der Indikator ist einfach zu verwenden, ziehen Sie ihn einfach per Drag-and-Drop auf den Chart und der Indikator zeigt Ihnen die wahrscheinlichsten Unterstützungs- und Widerstandsniveaus. Wenn Sie den Zeitrahmen wechseln, sehen Sie
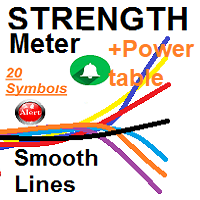
separates Indikatorfenster für Währungen Glatte Linien für bis zu 20 Symbole auf Basis von (5) Zeitrahmen &&& MAIN Window Power TABLE für bis zu 20 Symbole für (5) Timeframes und die gesamte berechnete Symbolstärke für jedes
1- Stärke der Währungen - Es zeichnet glatte Linien für bis zu 20 Währungspaare, die die Volatilitätsstärke und -kraft darstellen, die nicht nur durch 5 ausgewählte Zeitrahmen berechnet werden ***Arbeitet auf jedem Zeitrahmen , aber ich empfehle M15 M30 H1 .... (die niedri
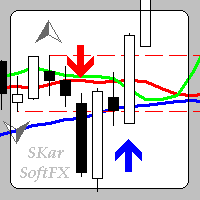
Der Indikator wurde entwickelt, um Ausbrüche des Bill Williams Fractal Levels auf dem Instrumentenchart im MetaTrader 4 zu erkennen.
Nach der Installation des Indikators auf dem Chart des Instruments wird bei einem Durchbruch des Bill Williams Fractal Levels der Signalbalken (Kerze) mit einem farbigen Zeiger (Pfeil) in Richtung des Durchbruchs markiert.
Für mehr Klarheit können Sie einen Standardindikator "Bill Williams Fractal" zum Chart des Instruments hinzufügen.
Wenn Sie den Indikator zu
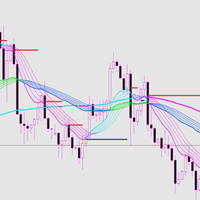
Dieser Indikator hat eine gute Trendanpassungsfähigkeit und eine gute Trendwiderstands-Unterstützungslinie. Dieser Indikator hat eine gute Trendanpassungsfähigkeit und eine gute Trend-Widerstands-Unterstützungslinie. Die Farbe ändert sich mit dem Trend der verschiedenen Ebenen. Die Unterstützungs- und Widerstandslinie bedeutet, dass der Kurs folgt oder sich umkehrt.
Grundlegende Anzeige Ein Preisschild mit historischen Unterstützungs- und Widerstandslinien. Zeigt die ungefähre empfohlene Spanne

Bollinger Bands Breakout Strategie hat eine Pfeile und Scanner Dashboard Indikator gesetzt. Es ist für MT4 (Metatrader 4) Plattform.
Wenn der Preis aus einem Bollinger Außenband in einer starken Weise ausbricht, wird es eine große Position für Scalping. Denn die nächsten Balken werden sich höchstwahrscheinlich in dieselbe Richtung bewegen. Vor allem, wenn das mittlere Band ebenfalls in Richtung dieses Ausbruchs tendiert. Es eignet sich auch hervorragend für binäre Optionen, wenn man die nächst
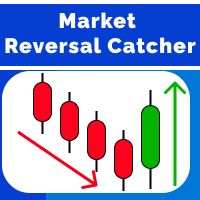
Der Market Reversal Catcher Indikator sucht nach Marktumkehrpunkten oder größeren Rücksetzern. Dazu analysiert er frühere Kursbewegungen und gibt mit Hilfe eines flexiblen Algorithmus zur Einschätzung der Wahrscheinlichkeit einer Umkehrung auch Empfehlungen zu Einstiegspunkten und setzt empfohlene Gewinnziele für Positionen, die auf ein Signal hin eröffnet werden.
Market Reversal Cather Benutzerhandbuch - Lesen
Version für MetaTrader 5 - hier Der Indikator ist sehr einfach zu bedienen und erf
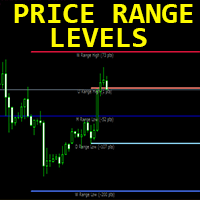
Forex-Indikator „Room_UP_DWN_Day_Week_Month“ für MT4
- Der Indikator „Room_UP_DWN_Day_Week_Month“ ist ein sehr nützliches zusätzliches Handelstool. - Er zeigt Ihnen täglich, wöchentlich und monatlich die wahrscheinlichsten Levels, die durch den Preis erreicht werden können (Preisbereichslevel). - Der tägliche Bereich ist für Intraday-Trader nützlich. - Wöchentliche und monatliche Bereiche sind für Swing- und langfristige Trader. - Der Indikator ist hervorragend geeignet, um Ihre Take-Profit-Zi
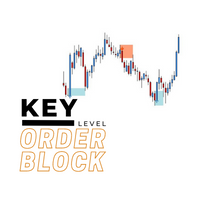
Der Key-Level-Orderblock-Indikator zeichnet automatisch Order-Blöcke für Sie auf dem Chart. Der Indikator ergänzt jede Strategie und kann auch als eigenständiges Werkzeug verwendet werden. Er kann mit Smart-Money-Konzepten, harmonischen Mustern, Angebot und Nachfrage, Flaggenmustern, der Quasimodo-Strategie und vielen anderen arbeiten.
Vorteile
Der Key-Level-Order-Block wird NICHT erneut gedruckt, was Ihnen Vertrauen gibt, wenn ein Signal auftaucht, und auch beim Rückblick hilft. Der Key-Leve
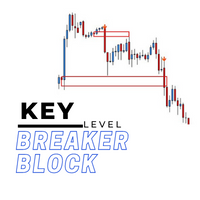
Der Key-Level-Breaker-Block-Indikator zeichnet automatisch Breaker-Blocks für Sie auf dem Chart. Breaker Blocks sind, kurz gesagt, fehlgeschlagene Orderblöcke, die jedoch starke Unterstützungs- und Widerstandszonen schaffen, wenn der Preis zurückkommt, um sie erneut zu testen.
Vorteile
Der Key-Level-Breaker-Block wird NICHT erneut gezeichnet, was Ihnen Vertrauen gibt, wenn ein Signal auftaucht, und auch beim Rückblick hilft. Der Key-Level-Breaker-Block verfügt über eine Ein-/Ausschalttaste a
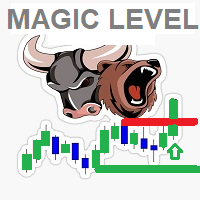
::: DAS MAGISCHE PREISNIVEAU ::: * Dieser intelligente Indikator erkennt die Marktrichtung, indem er Superkerzen und große Preisaktionen identifiziert, um wichtige Unterstützungs-/Widerstandsniveaus zu erzeugen. * Er erkennt die großen Ausbruchskerzen mit der Größe des Kerzenkörpers und zeigt sie in einem separaten Fenster an, um einen guten Hinweis auf die Marktstärke und -richtung zu geben * Unterstützungs- und Widerstandslinien werden durch eine einzigartige Strategie mit Hilfe von Balkenmust
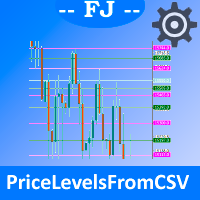
Mit diesem Indikator können Sie verschiedene Kurse, Kurslinien, aus einer Datei laden. Sie können einfach die gleichen Informationen zwischen all Ihren Fenstern importieren, ohne dass Sie sich Sorgen machen müssen, die gleichen Informationen von Fenster zu Fenster zu replizieren. Darüber hinaus sind bis zu 6 verschiedene Gruppen möglich, deren Visualisierung unterschiedlich konfiguriert werden kann, sowie die Möglichkeit, jede Gruppe nach Belieben visuell zu aktivieren oder nicht.
Konfigurati

Angebot-Nachfrage-Zonen Indikator für mögliche KAUF-/Verkaufszonen basierend auf dem Smart-Volumes-Indikator zwei Ebenen von Kauf-/Verkaufszonen: Hauptbereich BUY/SELL SUPPLY-Bereich in Rot DEMAND-Bereich in Grün Ihre Strategie ist es, den generierten Pfeilen zu folgen: 1- Sie können kaufen, wenn der Preis über dem grünen KAUFEN-Bereich und über dem Hoch der vorherigen Kerze geschlossen wird 2- Sie können verkaufen, wenn der Preis unter einer roten SELL-Zone und unter dem Tiefpunkt der vorherige

Fibo Panda ist ein Indikator, der Ihnen helfen kann, das Ende von Tagestrends vorherzusagen. Wenn der Tageskurs das END L4 oder END H4 erreicht hat, bedeutet das, dass das Tagesvolumen ausreichend ist. Wenn der Tageskurs den Höchst- oder Tiefstwert erreicht hat, bedeutet dies, dass der Kurs das höchste oder niedrigste Niveau erreicht hat. Der Kurs muss das End Hi oder End Low Level berühren, um die Kursbewegung jedes Zeitrahmens abzuschließen. Es kann eine Schlussfolgerung gezogen werden, ob gek

TripleStar Trend Indicator, bahnbrechende Lösung für Trend Trading und Filtering mit allen wichtigen Trend-Tool-Funktionen in einem Tool integriert ! Dies ist ein benutzerdefinierter MT4 (Metatrader 4) Indikator, der den Trend und die Volatilität analysiert und den Anfang und das Ende des Trends identifiziert, der für die meisten Währungspaare und Zeitrahmen funktioniert. Der Trend Monitor Indikator verwendet eine optimierte Formel, die auf Momentum basiert , um die Trendvolatilität zu berechnen

Dies ist leicht der am häufigsten übersehene Indikator, der Ihnen die meisten Einblicke in die Preisbewegung gibt. Es ist der einzige Indikator, den ich selbst verwende.
Dieser Indikator gibt Ihnen Aufschluss darüber, wie stark sich der Preis heute bewegen wird und in welche Richtung höchstwahrscheinlich.
ADR steht für Average Daily Range. Wenn Sie Intraday traden oder skalpieren, müssen Sie die Spanne kennen, um die sich der Preis bewegen wird.
Nehmen wir an, der Preis hat sich um die Hälft
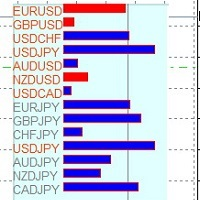
Dies ist ein Indikator, der die Korrelation zwischen dem wichtigsten Kreuz mit dem Koeffizienten von Bravais-Pearson berechnet. Sie können den Zeitrahmen und den Auswertungszeitraum wählen. Es ist ein nützliches Instrument, um die Bewegungen der verwandten Währungen zu antizipieren. Wenn ein Währungskreuz die Bewegung bereits vorweggenommen hat, kann erwartet werden, dass die korrelierten Währungspaare auch der entgegengesetzten (inverse Korrelation) oder gleichen (direkte Korrelation) Bewegung
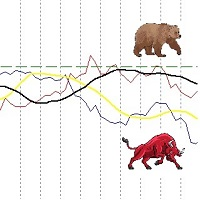
Indikator, der die Stärke der wichtigsten Währungen gegenüber anderen Währungen misst. Wenn die Stärke einer Währung die der anderen übersteigt, ist es an der Zeit, eine Position in KAUFEN oder VERKAUFEN zu eröffnen. Es ist möglich, die Benachrichtigungen über die Parameter zu aktivieren und die Signale direkt in die Grafik einzufügen oder nicht. Sehr zuverlässiger Indikator, der auf dem gesamten Markt der Hauptwährungen basiert und nicht nur auf dem einzelnen Währungskreuz.

"BUYUK SAVDOGAR" TM hat diese Strategie entwickelt, um alle zu unterstützen, die mit binären Optionen handeln. Wenn Sie mit binären Optionen handeln, sollten Sie dieses Handelssystem ausprobieren. Die meisten Benutzer berichten über gute Ergebnisse. Das Handelssystem basiert auf dem besten Algorithmus. Das Handelssystem hilft dabei, die Marktsituation anhand des Volumens zu bestimmen. Der Verlust des Interesses in der einen oder anderen Richtung am aktuellen Kurs wirkt sich auf die weitere Kursb
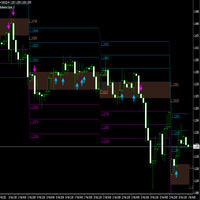
Ein Ausbruch liegt vor, wenn der Kurs eines Vermögenswerts über einen Widerstandsbereich oder unter einen Unterstützungsbereich steigt . Ausbrüche deuten darauf hin, dass der Kurs möglicherweise in die Richtung des Ausbruchs tendieren wird. Der Indikator arbeitet mit Pfeilen, die im Falle eines Durchbruchs auch ein Niveau von 1 tp, ein Niveau von 2 tp und ein Niveau von 3 tp anzeigen . Für weitere Informationen, willkommen in unserer Telegram Group. https://t.me/InfinXx
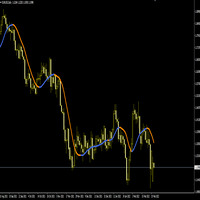
Der gleitende Hull-Durchschnitt (HMA) versucht, die Verzögerung eines traditionellen gleitenden Durchschnitts zu minimieren und gleichzeitig die Glätte der gleitenden Durchschnittslinie beizubehalten. Dieser von Alan Hull im Jahr 2005 entwickelte Indikator nutzt gewichtete gleitende Durchschnitte, um aktuellere Werte zu priorisieren und die Verzögerung stark zu reduzieren. Der daraus resultierende Durchschnitt ist reaktionsschneller und eignet sich gut zur Identifizierung von Einstiegspunkten. W
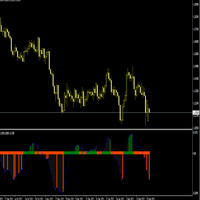
Der Indikator Steigung misst die Steigung einer linearen Regression , d. h. die Linie der besten Anpassung für eine Datenreihe. Eine 20-Perioden-Steigung misst also die Steigung einer linearen 20-Tage-Regression. ... Im Allgemeinen weist eine positive Steigung auf einen Aufwärtstrend hin, während eine negative Steigung einen Abwärtstrend anzeigt. Wie verwendet man den Steigungsindikator?
Durch die Anwendung des Slope-Indikators sowohl auf das Preisdiagramm als auch auf den relativen Preis könne

Der Superkanal ist ein sehr profitabler Indikator, der vorzugsweise auf den TF H1 und H4 verwendet wird, auch in einer kombinierten Version, die zwei von ihnen zusammen verwendet. Sein Signal ist hervorragend und in Verbindung mit der Auswertung von Unterstützungen und Widerständen ist das Signal sehr präzise. Die ersten Warnzeichen sind die Punkte, der grüne Punkt warnt vor einem bevorstehenden Kaufsignal, der rote Punkt warnt vor einem bevorstehenden Verkaufssignal. Der blaue Pfeil ist das Erö

Die MaxundMin-Anzeige gibt in Verbindung mit der Superkanal-Anzeige die Stärke des Eingangssignals an. Wenn der Pfeil dieses Indikators zusammen mit dem des Superkanals erscheint, ist das Signal ein Eingangssignal, wenn er allein erscheint, ist das Signal ein Alarmsignal. Sie können diesen Indikator auch zusammen mit der Preisaktion verwenden, um die wahren Höchst- und Tiefstwerte des Preises zu bestimmen. Seine Verwendung mit dem Super Canale Indikator gibt ein zusätzliches Warnsignal oder eine

Für Ichimoku-Liebhaber überlasse ich Ihnen diesen Indikator, mit dem Sie die Ichimoku-Kumo der nächsten beiden Perioden in der aktuellen Periode sehen können. Die Indikatorwerte in Perioden höher als die aktuelle werden automatisch angepasst, es ist nur notwendig, um die Parameter der Haupt ichimoku (es hat die Standard-Parameter 9,26,52) und auf der Grundlage dieser Parameter die anderen 2 Wolken oder Kumo berechnet werden.
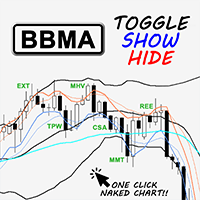
Intro Ein anpassbarer Toggle-Indikator, der auf dem BBMA (Bollinger Bands & Moving Averages)-Handelssystem basiert und es Händlern ermöglicht, mit einem Klick zwischen BBMA und Naked Chart zu wechseln, ohne die Chartvorlage ändern zu müssen.
Wichtigste Merkmale One Click Toggle Show/Hide: Wechseln Sie mit nur einem Klick zum Naked Chart! Kombinieren Sie es mit anderen Handelsstrategien, um mehr Einfluss auf Ihren Handel zu nehmen. Alle gezeichneten Objekte werden durch die Funktion zum Ein- und

Der Indikator zeichnet Preiszyklusblöcke auf und sendet Signale mit intelligenter Volumenbestätigung. Preiszyklen und Fraktale werden kombiniert, um die Nachfrage-/Angebotsblöcke zu bestimmen. Der Indikator kann allein oder in Kombination mit anderen Zyklusindikatoren verwendet werden. Eingaben: Periode: Der empfohlene Wert liegt zwischen 35 und 55 (das sind die Perioden von Set 1 und Set 2 des Cycle Sniper) Engulfing: Wenn dies der Fall ist, können Sie die Bestätigung des Engulfing Bar sehen.
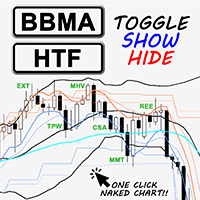
Intro Ein anpassbarer Toggle-Indikator, der auf dem BBMA (Bollinger Bands & Moving Averages)-Handelssystem basiert und es Händlern ermöglicht, mit einem Klick zwischen BBMA und Naked Chart zu wechseln, ohne die Chartvorlage ändern zu müssen. Es wurde die Möglichkeit hinzugefügt, mit einem Klick Zonen mit höherem Zeitrahmen auf einem Chart mit niedrigerem Zeitrahmen anzuzeigen, um Händler bei der Analyse mehrerer Zeitrahmen zu unterstützen.
Hauptmerkmale Ein-/Ausblenden mit einem Klick: Wechseln

Anatomie der Welle Besuchen Sie: http: // www.tradethevolumewaves.com für weitere Informationen
Konstruieren Sie Ihre eigenen 5 Wellen und analysieren Sie die Kursbewegungen:
Leichte Bewegung Schwierige Zeit für Bewegung Schnelle Bewegung Dieser Indikator basiert auf der Wyckoff's, David's Weis und meiner Speed Index Theorie. Dieser Indikator hilft Ihnen zu analysieren, was in 5 Preiswellen passiert, die Sie selbst konstruieren können. Dieses Tool ist für Scalper und Swing Trader gedacht und h

Was ist der MT4 Candlestick-Muster-Indikator? Candlestick-Muster sind Gruppen von Kerzen, die für den Händler eine Bedeutung haben. Diese Gruppen bestehen in der Regel aus zwei, drei, vier oder fünf Kerzen und zeigen irgendeine Form von Preisaktion an. In vielen Fällen nutzen Händler diese Muster, um zu entscheiden, was als nächstes zu tun ist. Candlestick Pattern Indicator for MT4 ist ein Plugin, mit dem Sie die häufigsten Candlestick-Muster auf Ihrem Chart sehen können. Der Indikator scannt da

Das Ichimoku-Panel ist ein Indikator, der das Verhalten der verschiedenen Ichimoku-Signale in allen Zeitrahmen anzeigt.
System-Parameter:
TENKAN SEN: Durchschnittliche Periode des Tenkan Sen.
KIJUN SEN: Durchschnittliche Periode des Kijun Sen.
SENKOU SPAN B: Durchschnittliche Periode des Senkou SpanB.
SHOW TENKAN..KIJUN: zeigt die Kreuzung der gleitenden Durchschnitte TENKAN SEN und KIJUN SEN.
SHOW KIJUN..KUMO: zeigt die Position des gleitenden Durchschnitts KIJUN SEN in Bezug auf die Kum

Der Trainspotting-Indikator für die technische Analyse zeigt Markteinstiegspunkte und potenzielle Marktumkehrpunkte an. Der intelligente Algorithmus des Indikators bestimmt präzise den Trend. Er verfügt über zwei Einstellungsmöglichkeiten. Der Indikator ist für eine einfache und effektive visuelle Trenderkennung mit einem zusätzlichen Glättungsfilter konzipiert.
Sind Sie das ständige Auf und Ab leid? Werden Sie nicht zum Opfer instabiler Marktbewegungen, es ist an der Zeit, sich davon irgendwi

Strangelove überwacht die Bildung eines Trends und hilft dem Benutzer, Einstiegspunkte zu identifizieren. Dank dieser Daten ist der Anleger in der Lage, die Situation vorherzusagen und eine Spielstrategie zu entwickeln. Es sind die Trendsignale, die es den Kunden von Maklerunternehmen ermöglichen, die Handelsinstrumente effizient einzusetzen und eine bessere Rentabilität zu erzielen.
Die richtige Berechnung des aktuellen Trends ist der Schlüssel zum erfolgreichen Handel mit Vermögenswerten auf

Reservoir ist ein Umkehrindikator und gehört zu einer besonderen Kategorie von Instrumenten. Der Indikator analysiert nicht nur die Kursbewegung, sondern zeigt auch die Punkte möglicher Umkehrungen an. Dies trägt zur schnellen und optimalen Eröffnung von Kauf- oder Verkaufsaufträgen bei (je nach der aktuellen Situation). In diesem Fall werden die historischen Daten des analysierten Vermögenswerts unbedingt berücksichtigt. Die korrekte Durchführung solcher Aktionen hilft den Händlern in vielerle

Back to the Future ist ein Trendindikator. Es besteht aus vier Teilen.
1. Teil ist die Fibo-Ebenen, die die minimalen und maximalen Ziele zu definieren.
2. Dies ist ein Ziel Ebene, die die minimale Korrekturziele und Trendziele definiert.
3. Dynamische Ebenen Korrekturziele und Trendziele..
4. Trend-Levels, die auf Trendlinien basieren.
Alle Teile sind im Indikatormenü enthalten.
Der Indikator Back to the Future wird nicht neu gezeichnet.
Die Änderung der Informationen erfolgt nach der Berechnun

Waterfront - Ein einzigartiger Trendindikator. Das neue System passt sich dem Markt an, eliminiert Nebenbedingungen und meistert seine Aufgabe. Ein revolutionärer neuer Weg, den Beginn eines Trends frühzeitig zu erkennen. Trendindikator, zeigt Signale an, kann mit einem optimalen Risikoverhältnis genutzt werden. Er verwendet zuverlässige Algorithmen zur Berechnung. Er zeigt günstige Einstiegszeitpunkte in den Markt mit Pfeilen an, d.h. die Anwendung des Indikators ist ganz einfach.
Trendindika

Price Action Areas ist ein Indikator, der die Bereiche einzeichnet, in denen zum Kauf oder Verkauf eingegriffen werden soll. Es ist geeignet für diejenigen, die mit der Preis-Aktion Handel. Er kann auch als Unterstützung mit anderen Indikatoren wie dem Super Channel, wie Sie auf den Bildern sehen, oder dem MaxandMin verwendet werden, um das Einstiegsniveau zu bestätigen. Sie können ihn verwenden, um Bereiche über mehrere Zeitrahmen hinweg zu betrachten, und Sie werden ein gutes Einstiegssignal e

Indikator, der den Trend und auch Kauf-/Verkaufsmöglichkeiten aufzeigt. Verwenden Sie ihn für Einstiege, die auf den Trend ausgerichtet sind. Obwohl Diamond Trend sehr genau ist, um Einstiegspunkte zu identifizieren, ist es immer empfehlenswert, einen Unterstützungsindikator zu verwenden, um die Operation zu bestätigen. Erinnern Sie sich daran, nach jenen Vermögenswerten und Zeitrahmen zu suchen, die am besten zu Ihrem Handelsverhalten/Bedürfnis passen... Gültig für Scalping und Long Term Operat
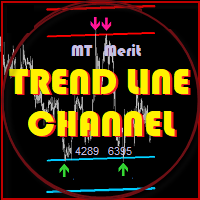
Bitte testen Sie den Indikator gründlich unter den von Ihnen bevorzugten Handelsbedingungen, bevor Sie eine Kaufentscheidung treffen.
Ihre Zufriedenheit und Ihr Vertrauen in die Leistung des Indikators sind von größter Bedeutung. MT MERIT TLC (Trend Line Channel) :
Der TLC-Indikator identifiziert Umkehr- oder Ausbruchssignale, indem er Trendlinienkanäle relativ zum aktuellen Kurs einzeichnet. Er ist auf manuelle Händler zugeschnitten, die das Risiko unabhängig verwalten (Stop Loss, Take Profit
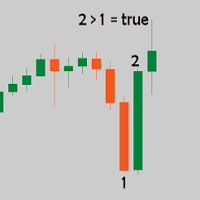
Der Kerzenlängen-Indikator ist, wie der Name schon sagt, ein Indikator, der die Körpergröße jeder Kerze anzeigt. Die Nenngröße wird unter jeder bärischen Kerze und unter jeder bullischen Kerze angezeigt. Wie installiert man den Kerzenlängen-Indikator auf der Metatrader 4 Handelsplattform? Laden Sie den Indikator herunter
Kopieren Sie die Dateien des Candle Body Size Indicator und fügen Sie sie in den folgenden Ordner Ihrer Metatrader 4 (MT4) Plattform ein: MQL4 > Indikatoren. Sie können auf die
Der Indikator " Support and Resistance Detect Signal" erkennt automatisch Unterstützungs- und Widerstandsniveaus sowie Trendlinien und gibt ein Signal aus, sobald die konfigurierte Bedingung erfüllt ist.
Er liest Unterstützungen und Widerstände, die manuell oder automatisch von anderen externen Indikatoren in den Chart eingezeichnet wurden.
Hinweis: Support and Resistance Detect Signal ist mit fast allen externen Indikatoren kompatibel, die neben Trendlinien auch Unterstützungs- und Widerstan

Der Sparta-Trendindikator analysiert den Zustand des Marktes, die Phase seiner Bewegung und bestimmt weitgehend den Erfolg des Händlers bei seiner schwierigen Arbeit. Der Indikator basiert auf dem Prozess der Identifizierung der Veränderungsrate des Preiswachstums und ermöglicht es Ihnen, Ein- und Ausstiegspunkte auf dem Markt zu finden. Er wurde auf der Grundlage der ursprünglichen Indikatoren zum Auffinden von Extrema entwickelt und ist gut geeignet, um eine Umkehrung oder einen großen Aussch

Der Handel mit dem Indikator "Transition to quality" ist so einfach wie möglich: Erscheint ein blauer Pfeil auf dem Diagramm, der nach oben zeigt, wird ein Kaufgeschäft eröffnet. Im gleichen Fall, wenn Sie einen roten Pfeil sehen, der nach unten zeigt, eröffnen Sie einen Verkaufsauftrag.
Das heißt, alles ist so einfach wie möglich, Positionen werden nach dem umgekehrten Schema geschlossen, das heißt, sobald ein Signal zur Eröffnung eines Auftrags in der entgegengesetzten Richtung Ihrer Positio

Abhängigkeit Pfeil Indikator für Forex, Futures und binäre Optionen ohne Redrawing. Es gibt eine Menge von Signalen, die zusätzliche Indikatoren erfordert, um sie zu überprüfen. Funktioniert nur bei Eröffnungskursen. Daher zuverlässig und ohne Redrawing. Oft werden Signale, die in die falsche Richtung gingen, beim nächsten Signal wieder aufgehoben.
Leider geben die meisten populären Indikatoren in der Praxis eine große Anzahl falscher Signale, da sie alle ohne Berücksichtigung der globalen Tre
Transition Angle ist ein Pfeilindikator zur Identifizierung potenzieller Einstiegspunkte. Ich mag ihn vor allem, weil er einen einfachen Arbeitsmechanismus hat, der sich an alle Zeiträume und Handelstaktiken anpasst. Er eignet sich für den Handel auf niedrigen Zeitebenen, da er plötzliche Preisspitzen oder Preiskorrekturen ignoriert, indem er das Marktrauschen um den Durchschnittspreis reduziert. Funktioniert bei allen Währungspaaren und in allen Zeitrahmen. Fertiges Handelssystem. Take Profit i
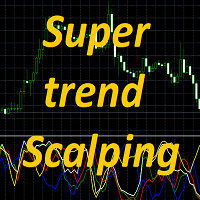
Super trend scalping ist ein Satz von fünf Stochastics auf verschiedene Währungspaare in einem Fenster. Entwickelt, um die Stärke und Richtung des Trends zu bestimmen und Kursumkehrpunkte zu finden. Mit diesem Indikator können Sie gleichzeitig die Korrelation von 5 Stochastik-Indikatoren in einem Fenster beobachten. Sie können auch die Divergenz der Stochastik bestimmen und die Einstiegspunkte zum Markt genau finden. Der Indikator eignet sich für die Arbeit mit beliebigen Währungspaaren und in

Naked Forex Känguru-Schwanz-Indikator für MT4 Der Känguru-Schwanz-Indikator ist ein Mustererkennungs-Indikator für Forex, Aktien, Indizes, Futures, Rohstoffe und Kryptowährungen.
Der Känguru-Schwanz ist ein Multi-Bar-Muster.
Das Känguru-Schwanz-Muster ist sehr effektiv und sehr einfach zu handeln.
Die mit dem Känguru-Schwanz verbundene Strategie basiert auf der Preisaktion.
Der Indikator tut das, wofür er entwickelt wurde: Er zeigt Känguru-Schwanz-Muster an . Erwarten Sie nicht, dass Sie den
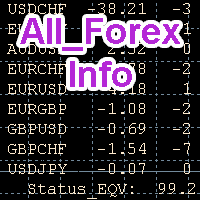
Ich habe ein sehr nützliches Informationstool für einen Trader, ohne das sich der Handel nicht lohnt. Probieren Sie es auf einem Demokonto aus und überzeugen Sie sich selbst. AllForexInfo ist ein Indikator zur Überwachung des Status von Wetten auf 13 Währungspaare. Er zeigt auch die Geschwindigkeit des Kursanstiegs oder -rückgangs durch den Neigungswinkel der gleitenden Durchschnittslinie auf 5-Minuten- und 30-Minuten-Charts für diese 13 Währungspaare in Form der bedingten Länge der Linie an. E

Naked Forex Tweezer Pro Indikator Der Tweezer Pro Indikator ist ein Mustererkennungsindikator für Forex, Aktien, Indizes, Futures, Rohstoffe und Kryptowährungen.
Der Standard-Tweezer ist ein Zwei-Balken-Muster. Unsere erweiterte Version ist ein Multi-Bar-Muster. Wir filtern die Muster für Sie, damit Sie nur die besten und effektivsten Muster erhalten und das Rauschen ignorieren.
Das Tweezer-Muster ist ein einfaches und effektives Muster zum Handeln.
Die Strategie, die mit dem Tweezer geliefer

Naked Forex Tweezer Standard-Indikator
Der Tweezer-Indikator ist ein Mustererkennungsindikator für Forex, Aktien, Indizes, Futures, Rohstoffe und Kryptowährungen.
Der Standard-Tweezer ist ein Zwei-Balken-Muster. Unsere erweiterte Version ist ein Multi-Bar-Muster. Wir filtern die Muster für Sie, damit Sie nur die besten und effektivsten Muster erhalten und das Rauschen ignorieren.
Das Tweezer-Muster ist ein einfaches und effektives Muster zum Handeln.
Die Strategie, die mit dem Tweezer gelief

Da MQL5 nur 1 Datei im ex4-Format zulässt, die hochgeladen werden kann, müssen Sie eine E-Mail an simplifyindi2022@embun.biz senden, um die Support-Indikatoren zu erhalten. Ohne solche Support-Indikatoren werden diese Indikatoren nicht wirksam sein.
Es gibt 14 Indikatoren, die als die besten in diesem SimplifyIndicator2022 (Multi Time Frame) angesehen werden :
Dieser Indikator wurde nach 2 Jahren Forschung während der Covid 19-Pandemie erstellt. Es wurden verschiedene Indikatoren verwendet, um

Naked Forex Big Shadow IndicatorBig Shadow Indicator ist ein Mustererkennungsindikator für Forex, Aktien, Indizes, Futures, Rohstoffe und Kryptowährungen.
Wenn Sie einen Big Shadow auf Ihrem Diagramm haben, ist dies ein starkes Signal, das bedeutet, dass Sie einer Umkehrung voraus sein könnten. Sie können andere Elemente (Momentum, Trend, Volatilität, Preisaktion, Fundamentaldaten) verwenden, um eine vollständige Strategie zu erstellen und Ihre Eingänge zu bestätigen. Beachten Sie, dass Sie mögl

TTM-Squeeze-Indikator TTM Squeeze ist ein Indikator, der den Einstiegszeitpunkt auf der Grundlage der Volatilität bestimmt.
TMM Squeeze ist vielleicht einer der besten und am meisten übersehenen Indikatoren. Er wurde von dem berühmten Trader John Carter entwickelt und wird auch von vielen Tradern wie Nathan Bear verwendet.
Warum ist der TTM Squeeze-Indikator so wichtig? Weil beim Handel das richtige Timing des Einstiegs wichtiger sein kann als die Wahl der richtigen Richtung. Dies ist ein Konz

Inside-Bar-Indikator Inside Bar ist ein sehr beliebtes Candlestick-Muster.
Der Inside Bar Indikator kann für den Handel mit Forex, Aktien, Indizes, Futures, Rohstoffen und Kryptowährungen verwendet werden.
Der Inside Bar Indikator sucht nach Inside Bar Kerzenmustern im Chart und zeigt diese an.
Der Indikator kann auch Warnmeldungen auf Ihrem Bildschirm anzeigen oder an Ihr Telefon senden.
Die Eingaben des Indikators sind:
Symbol : Typ des Char-Symbols, das im Chart angezeigt werden soll, u

Engulfing Bar IndikatorEngulfing Bar Indikator ist ein Mustererkennungsindikator für Forex, Aktien, Indizes, Futures, Rohstoffe und Cryptos.
Der Engulfing Bar Indikator ist ein verbessertes Muster des beliebten Engulfing Bar, um nur die besten Muster zu erhalten, die auf dem Markt produziert werden.
Die Strategie, die mit dem Engulfing Bar kommt, basiert auf der Preisaktion.
Eingaben des Indikators sind:
Abstand: Abstand in Pixeln relativ zum oberen oder unteren Ende der Kerze, um das Pfeilsymb

Pin-Bar-Indikator Der Pin Bar Indikator ist ein Mustererkennungsindikator für Forex, Aktien, Indizes, Futures, Rohstoffe und Kryptowährungen.
Die Strategie, die mit dem Pin Bar Muster einhergeht, basiert auf Preisaktionen.
Eingaben des Indikators sind:
Abstand : Abstand in Pixeln relativ zum oberen oder unteren Ende der Kerze, um das Pfeilsymbol anzuzeigen UseAlerts (true/false): Warnungen aktivieren PopAlerts (true/false): Warnungen im Popup-Fenster aktivieren EmailAlerts (true/false): E-Ma

Naked Forex Känguru-Schwanz Pro Indikator Kangaroo Tail Pro Indicator ist ein Mustererkennungsindikator für Forex, Aktien, Indizes, Futures, Rohstoffe und Cryptos.
Der Kangaroo Tail ist ein Multi-Bar-Muster.
Das Kangaroo Tail-Muster ist sehr effektiv und sehr einfach zu handeln.
Die mit dem Känguru-Schwanz verbundene Strategie basiert auf der Preisaktion.
Der Indikator tut das, wofür er entwickelt wurde: Er zeigt Känguru-Schwanz-Muster an . Erwarten Sie nicht, dass Sie den Auf- und Abwärtspf
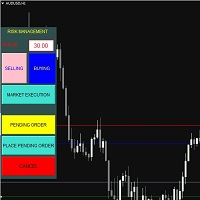
Bot für einfaches Volumenmanagement, bequem per Drag & Drop! Dies ist ein Bot, der es dem Benutzer ermöglicht, das Volumen zu berechnen, bevor er eine Order eingibt. Die Benutzer können flexibel das Risikoverhältnis von 1 Auftrag in $ eingeben. Dann können Sie wählen, ob Sie einen sofortigen Auftrag oder einen schwebenden Auftrag eingeben möchten. Der Bot zeigt Linien an, die dem Benutzer helfen, SL, TP zu bearbeiten und automatisch das entsprechende Volumen zu berechnen. https://tailieuforex.co
MetaTrader Market bietet jedem Entwickler eine einfache und bequeme Plattform für den Verkauf von Programmen.
Wir unterstützen Sie bei der Veröffentlichung des Produkts und beraten Sie gerne, wie man eine Beschreibung für den Market vorbereitet. Alle Produkte, die im Market verkauft werden, sind durch eine zusätzliche Verschlüsselung geschützt und können nur auf dem Rechner des Kunden gestartet werden. Illegales Kopieren ist ausgeschlossen.
Sie verpassen Handelsmöglichkeiten:
- Freie Handelsapplikationen
- Über 8.000 Signale zum Kopieren
- Wirtschaftsnachrichten für die Lage an den Finanzmärkte
Registrierung
Einloggen
Wenn Sie kein Benutzerkonto haben, registrieren Sie sich
Erlauben Sie die Verwendung von Cookies, um sich auf der Website MQL5.com anzumelden.
Bitte aktivieren Sie die notwendige Einstellung in Ihrem Browser, da Sie sich sonst nicht einloggen können.