Technische Indikatoren für den MetaTrader 4 - 22

Der Indikator sucht und zeigt Doji-Kerzenhalter auf dem Diagramm an und signalisiert das Auftreten einer solchen Kerze. Die Richtung des Signals hängt von der Richtung der vorherigen Kerzen ab, da der Doji eine Umkehrung oder Korrektur signalisiert. Zusätzlich zur Möglichkeit der Signalisierung wird die Stärke der Umkehrung grafisch dargestellt (je grüner, desto wahrscheinlicher ein Anstieg, desto roter ein Preisverfall). In den Anzeigeeinstellungen können Sie die Parameter des Doji-Kerzenhalte
FREE

Der Donchian-Kanal ist ein Indikator, der aus einer Reihe von benutzerdefinierten Perioden das obere und untere Band berechnet. Zeichnen Sie zwei Linien in das Diagramm gemäß der Formel des Donchian-Kanals. Diese unkomplizierte Formel basiert auf:
Die obere Linie ist der höchste Preis der letzten Perioden n Die untere Linie ist der niedrigste Preis der letzten Perioden n
Trendsysteme folgen Perioden, in denen Unterstützungs- und Widerstandsniveaus durchbrochen werden. In diesem Fall durchbric
FREE

Überblick über die Indikatoren Trendindikator Verwendung gleitender Durchschnitte. Alarme von höchster Qualität, die keiner Einführung bedürfen. Der Indikator bleibt dem ursprünglichen Algorithmus vollständig treu und nutzt weitere nützliche Funktionen.
Einfach zu handeln Führen Sie alle Arten von Benachrichtigungen aus Es ist keine neue Farbe und es ist keine Rückfarbe. Einstellung Indikator SMA50 im Zeitrahmen H1 für jedes Währungspaar und Gold Spot. EMA200 im Zeitrahmen H1 für jedes Währung
FREE

Session Killzone Indikator
Indikator, der Ihnen hilft, die Killzone-Zeiten der Londoner und New Yorker Sitzungen zu identifizieren, die in der Regel die Zeiten hoher Volatilität und des Liquiditätsentzugs auf dem Markt sind. Die Killzone-Zeiten sind über die Indikatorparameter konfigurierbar. Der Indikator passt den Bereich der Killzones auf der Grundlage der täglichen Handelsspanne an.
FREE

Die kostenlose Version des Hi Low Last Day MT4 Indikators . Der Hi Low Levels Last Day MT4 Indikator zeigt das Hoch und das Tief des letzten Handelstages . Sie haben die Möglichkeit , die Farbe der Linien zu ändern . Testen Sie die volle Version des Hi Low Last Day MT4 Indikators , in welche zusätzliche Indikator Funktionen verfügbar sind : Anzeige des Minimums und des Maximums des vorletzten letzten Tages Anzeige des Minimums und des Maximums der vorangegangenen Woche Ton Alarm beim Überschreit
FREE
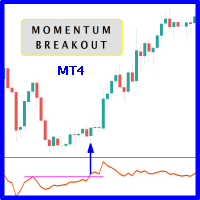
Wenn die Preise aus den Widerstandsniveaus ausbrechen und der Momentum-Oszillator aus seinen historischen Widerstandsniveaus ausbricht, besteht die Wahrscheinlichkeit, dass die Preise weiter steigen. Es wird dringend empfohlen, den Ausbruch des Preises mit dem Ausbruch des Oszillators zu bestätigen, da sie vergleichbare Auswirkungen auf den Preis haben, der die Unterstützungs- und Widerstandsniveaus durchbricht; sicherlich werden Short-Trades die gleiche Wahrnehmung haben. Das Konzept basiert da
FREE

Volume Footprint Analysis ist ein präzisionsgefertigter, volumenbasierter Indikator, der das rohe Marktvolumen in ein intuitives, farbcodiertes Signalsystem umwandelt. Dieses Tool, das auf Konzepten der Volume Spread Analysis (VSA) und Smart Money-Prinzipien basiert, macht Schluss mit dem Rätselraten bei der Interpretation des Volumens und liefert Händlern klare, umsetzbare Erkenntnisse darüber, wann sie kaufen oder verkaufen sollten - auf jedem Zeitrahmen und für jedes Handelsinstrument. MT5-Ve
Drawdown-Warnungen Kostenlos! Meta Trader 4 Indikator. Bitte hinterlassen Sie eine Bewertung zu diesem Produkt, damit andere Benutzer davon profitieren können. Dieser Drawdown Alerts Indikator zeigt den Drawdown-Prozentsatz in Echtzeit an und warnt Sie, wenn das von Ihnen festgelegte Limit erreicht ist. Die Berechnung des Drawdowns hängt von der Höhe des Handelssaldos ab. Sie können Drawdown Alerts anpassen für Ecke - Links , Rechts , Oben , Unten X Y Farbe Anzahl der Dezimalstellen Popup-Meldu
FREE

Der Fibonacci-Indikator zeigt automatisch die Fibonacci-Retracement-Levels an, die wichtige Unterstützungs- und Widerstandsmarken darstellen. Der Bereich für die Berechnung des Indikators kann aus dem Vortag, der Woche, dem Monat, dem Jahr oder einer benutzerdefinierten Sitzung stammen.
Niveaus 100 % (Hoch) der Spanne der vorangegangenen Sitzung. 0 % (Tiefstwert) der Spanne der vorangegangenen Sitzung. 76,4 % der Spanne der vorangegangenen Sitzung. 61,8 % der Spanne der vorangegangenen Sitzung
FREE
Bleiben Sie dem Marktmomentum voraus mit dem Pip Movement Alert MT4, einem vielseitigen Mehrwährungsindikator, der entwickelt wurde, um präzise Pip-Bewegungen über mehrere Symbole hinweg zu verfolgen und Trader zu benachrichtigen, ideal für den Handel mit Forex, Aktien, Kryptowährungen und Rohstoffen. In Handelsgemeinschaften wie Forex Factory und Reddit’s r/Forex gefeiert und in Diskussionen auf Investopedia und TradingView für seine Fähigkeit, plötzliche Marktveränderungen zu erkennen, hervorg
FREE

Was ist der Super Ichi-Indikator? Super Ichi ist eine fortschrittliche Kombination der Indikatoren Ichimoku Kinko Hyo und SuperTrend. Dieses leistungsstarke technische Analyseinstrument wurde entwickelt, um Markttrends zu erkennen und Handelssignale zu generieren. Was leistet es? Zweistufige Trendanalyse : Verwendet angepasste Versionen der Tenkan-sen- und Kijun-sen-Linien Automatische Signalerzeugung : Zeigt visuelle Markierungen (Pfeile) an Überkreuzungspunkten an Echtzeit-Warnsystem : Liefert
FREE

Der Indikator CYCLE WAVE OSCILLATOR ist ein Indikator, der auf zyklischen Kursschwankungen basiert. Dieser Indikator kann Ihnen helfen, überkaufte und überverkaufte Niveaus zu bestimmen und Preistrends innerhalb des Zyklus vorherzusagen. MT5-Version hier! Sie können diesen Indikator mit unseren untenstehenden Indikatoren kombinieren, um Ihre Handelsentscheidungen zu präzisieren: Angebot-Nachfrage-Band MT4 Basic
Merkmal: - Drei Trendtypen: + Null + Grundlegend + Erweitert
FREE

Verbessern Sie Ihre Handelspräzision mit dem WH Handelssitzungen MT4 Indikator für MetaTrader 4! Dieses leistungsstarke Tool hilft Ihnen, wichtige Marktsitzungen mühelos zu visualisieren und zu verwalten. Basierend auf: WH SMC Indicator MT4
MT5-Version: WH Trading Sessions MT5 Hauptmerkmale: Interaktives GUI-Panel – Einfaches Auswählen und Umschalten zwischen Asien, London und New York Handelssitzungen.
Anpassbare Warnungen und Einstellungen – Passen
FREE

Der Indikator basiert auf dem Konzept der Preiskanäle, die durch Aufzeichnung der höchsten Höchst- und niedrigsten Tiefstkurse über einen bestimmten Zeitraum gebildet werden. Der Donchian-Kanal-Indikator besteht aus drei Linien: einer oberen Kanallinie, einer unteren Kanallinie und einer mittleren Kanallinie. Die obere Kanallinie stellt das höchste Hoch über einen bestimmten Zeitraum dar, während die untere Kanallinie das niedrigste Tief darstellt. Die mittlere Kanallinie ist der Durchschnitt de
FREE

Der Indikator zeigt den Nulldurchgang des gleitenden Durchschnitts des Oszillators (OsMA) in Form von Pfeilen an. Der Indikator benachrichtigt über ein Signal durch ein Pop-up-Alarm-Fenster oder durch das Senden einer Benachrichtigung per E-Mail.
Parameter Schneller EMA Zeitraum - schneller EMA. Dies ist ein exponentieller gleitender Durchschnitt eines Preises mit einer kurzen Periode. Langsamer EMA Zeitraum - langsamer EMA. Hierbei handelt es sich ebenfalls um einen exponentiell gleitenden Dur
FREE
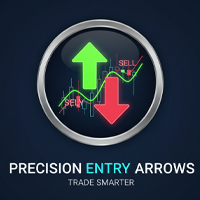
Präzisionseinstiegspfeile: Verpassen Sie nie wieder einen hochwahrscheinlichen Handel! Hören Sie auf zu raten und beginnen Sie, mit Zuversicht zu handeln. Der Precision Entry Arrows-Indikator ist ein ausgeklügeltes All-in-One-Tool, das hochwertige, nicht nachmalende Kauf- und Verkaufssignale direkt auf Ihrem Chart liefert. Er kombiniert gekonnt die Leistung von MACD , Stochastik und einem einzigartigen EMA 5 Cross , um exakte Einstiegszeitpunkte zu ermitteln, und filtert dann alles durch einen
FREE

Entfesseln Sie Ihr Handelspotenzial mit dem Goldenen Fraktalkreuz Sind Sie es leid, Ihre Trades immer wieder in Frage zu stellen? Hätten Sie gerne ein klares, zuverlässiges System, das Sie bei Ihren Entscheidungen unterstützt? Wir stellen Ihnen den Goldenen Fraktal-Kreuz vor - einen leistungsstarken und benutzerfreundlichen Indikator, der Ihnen hilft, Handelsmöglichkeiten mit hoher Wahrscheinlichkeit zu erkennen. Es handelt sich hierbei nicht um einen weiteren Durchschnittsindikator, sondern um
FREE

Touch VWAP ist ein Indikator, der es Ihnen ermöglicht, einen volumengewichteten Durchschnittspreis (VWAP) zu berechnen, indem Sie einfach die Taste "w" auf Ihrer Tastatur drücken und dann auf die Kerze klicken, die Sie berechnen möchten. Wenn Sie unter der Kerze klicken, wird der VWAP auf der Grundlage des Tiefstpreises mit dem Volumen berechnet, Wenn Sie auf den Kerzenkörper klicken, wird der VWAP auf der Grundlage des Durchschnittspreises und des Volumens berechnet, und wenn Sie auf die Kerze
FREE
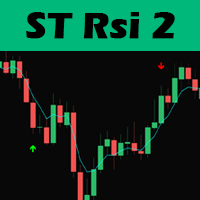
Hallo Trader, diese Handelsstrategie basiert auf der Larry Connors RSI-2 Strategie. Wir beginnen mit einer 200 Perioden EMA um die Richtung des Marktes zu finden. Dies ist wichtig, weil wir nur in der Haupttrendrichtung handeln.
Dann suchen wir nach Pull-Backs, indem wir den RSI mit einer Periode von 2 verwenden, um Einstiegssignale zu erhalten. Der Ausstieg aus dem Handel erfolgt dann anhand des 5 EMA.
Die Losgröße sollte mit 1% von 1 des ATR-Wertes berechnet werden und Positionen können hin
FREE

Scalping-Pfeile werden nicht neu gezeichnet - ein Indikator, der Preisumkehrpunkte auf dem Chart anzeigt und seine Signale nicht neu zeichnet. Außerdem sendet der Indikator Signale per E-Mail und Push an den Händler. Die Genauigkeit der Signale dieses Indikators beträgt etwa 92-94 % im M5-Zeitrahmen und mehr als 95 % im H1-Zeitrahmen. Somit ermöglicht dieser Indikator dem Händler, Trades genau zu eröffnen und weitere Preisbewegungen vorherzusagen. Kursumkehrpunkte auf dem Chart werden mit einfa

Spline Searcher MT5 — Multi-Währungs-Indikator zur Früherkennung von Preissplines und Interessenspunkten Hilfswerkzeug zur automatischen Erkennung und Visualisierung früher Stadien komplexer Preisformationen. Der Indikator ist ausschließlich für das manuelle Trading konzipiert und eignet sich für Händler, die mit der Früherkennung fortgeschrittener Marktformationen oder Trends experimentieren, deren Bestandteil einfachere Formationen sein können. Der Indikator identifiziert bis zu sechs Arten v
FREE

Channel Searcher MT5 — Multi-Währungs-Indikator zur Erkennung von Preis-Kanälen Hilfswerkzeug zur automatischen Erkennung und Visualisierung von Preis-Kanälen auf Basis fraktaler Extrempunkte und geometrischer Analyse. Der Indikator ist ausschließlich für das manuelle Trading konzipiert und eignet sich für Trader, die einen strukturellen Marktzugang bevorzugen. Er identifiziert Kanäle anhand mehrerer Kriterien: Anzahl der Berührungen, Neigung, Füllgrad, Tiefe des Breakouts und relative Position
FREE

High-Precision Volatility Notifier V1.10 Entwickelt von: Grazia-system-com Titel: Hören Sie auf, der Volatilität hinterherzujagen: Lassen Sie sich nur benachrichtigen, wenn der echte Ausbruch beginnt. Das professionelle, geräuschgefilterte Tool, das Ihren MT4/MT5 in ein intelligentes, proaktives Überwachungssystem verwandelt. Verpassen Sie nie wieder eine Bewegung auf institutionellem Niveau. Warum dieser Detektor anders ist (Dual-Layered, Noise-Filtered Intelligence) Die meisten Volatilitä
FREE

Hören Sie auf, Trends zu verfolgen, und fangen Sie an, Umkehrungen zu erkennen: Der Stochastic Sniper stellt sich vor Haben Sie es satt, seitwärts laufende Märkte zu handeln oder von falschen Ausbrüchen überrascht zu werden? Der Stochastic Sniper Indikator wurde für einen präzisen Einstieg entwickelt. Er kombiniert die Volatilitätskanäle der Keltner-Bänder mit dem Momentum-Timing des Stochastik-Oszillators , um extreme Preisumkehrungen mit hoher Genauigkeit zu erkennen. Stellen Sie sich vor, Si
FREE

Nach dem Kauf können Sie mich gerne kontaktieren, um weitere Details zu erfahren, wie Sie einen Bonusindikator namens VFI erhalten, der sich perfekt mit Easy Breakout kombinieren lässt, um die Konfluenz zu verbessern !
Easy Breakout ist ein leistungsfähiges Price Action Trading System, das auf einer der beliebtesten und vertrauenswürdigsten Strategien unter Tradern basiert: der Breakout-Strategie ! Dieser Indikator liefert kristallklare Kauf- und Verkaufssignale, die auf Ausbrüchen aus wichtige
ChartFix - Feste Skalierung und Pan Chart Controls für MT4 ChartFix ist ein leichtgewichtiger Indikator, der dem MetaTrader 4 bequeme Tools zur Chartnavigation hinzufügt. Die Steuerelemente sind so konzipiert, dass sie einen Chart-Interaktionsstil bieten, der einen optionalen Wechsel zwischen der MT4-Standard-Autoskalierungsfunktion und einem Chart mit fester Skalierung ermöglicht, der nach oben und unten verschoben und einfach vertikal skaliert werden kann. Hauptfunktionen Vergrößern / Verklein

Donchian-Kanäle sind ein Instrument der technischen Analyse, mit dem die relative Volatilität eines Marktes und das Potenzial für Kursausbrüche bestimmt werden können.
kann dazu beitragen, potenzielle Kursausbrüche und -umkehrungen zu erkennen, also die Momente, in denen Händler aufgefordert sind, strategische Entscheidungen zu treffen. Diese Strategien können Ihnen dabei helfen, aus Preistrends Kapital zu schlagen und gleichzeitig vordefinierte Einstiegs- und Ausstiegspunkte zu haben, um Gewinn
FREE

Dieser Indikator berechnet die Korrelation zwischen Währungspaaren (vom Benutzer ausgewählt), um die am wenigsten und/oder am stärksten korrelierten Symbole in Echtzeit zu finden. Die Korrelation reicht von -100% bis +100%, wobei -100% für Währungen steht, die sich in entgegengesetzte Richtungen bewegen (negative Korrelation) und +100% für Währungen steht, die sich in dieselbe Richtung bewegen.
Hinweis Eine Korrelation von mehr als 80 (einstellbar) zwischen zwei Währungspaaren zeigt, dass sie i

Wenn Sie mit dem beliebten HLHB Trend-Catcher System handeln oder handeln möchten, dann ist dieser Indikator genau das Richtige für Sie! Er erkennt, wenn die Einstiegsregeln des HLHB-Systems erfüllt sind, und sendet einen Alarm in Form von Benachrichtigungen an Ihr Mobiltelefon und an Ihren PC. Durch das automatische Versenden von Benachrichtigungen entlastet dieser Indikator Ihre Arbeit, da Sie nicht den ganzen Tag vor Ihrem PC sitzen und alle Chats daraufhin überprüfen müssen, wann die Einstie
FREE

Fibonacci SR-Indikator
Dieser Indikator erstellt Unterstützungs- und Widerstandslinien. Dieser Indikator basiert auf Fibonacci Retracement und Extension Levels. Er berücksichtigt viele Kombinationen der Fibonacci-Levels und zeichnet Unterstützungs-/Widerstandslinien, die auf diesen basieren. Dieser Indikator verwendet in seinen Berechnungen die vom ZigZag-Indikator gezeichneten Höchst- und Tiefststände. Der ZigZag-Indikator kann auch auf dem Chart eingezeichnet werden, falls erforderlich. Der In
FREE

Highlights der Handelssitzungen im Chart
Die Demoversion funktioniert nur auf dem AUDNZD-Chart !!! Die Vollversion des Produkts ist verfügbar unter: (*** wird noch hinzugefügt ***)
Der Trading Session Indicator zeigt den Beginn und das Ende von vier Handelssitzungen an: Pazifik, Asien, Europa und Amerika. die Möglichkeit, den Beginn und das Ende der Sitzungen individuell zu gestalten; die Möglichkeit, nur ausgewählte Sitzungen anzuzeigen; funktioniert auf den Zeitrahmen M1-H2;
Die folgenden
FREE

Fortgeschrittener Renko & Point & Figure-Indikator mit Gewinn/Verlust-Musteranalyse Dieser leistungsstarke Indikator kombiniert zwei bewährte Strategien - Renko und Point & Figure (P&F) - zu einem umfassenden Tool für Trendidentifikation, Mustererkennung und Risikomanagement. Mit der dynamischen Box-Size-Berechnung (fest oder ATR-basiert), gleitenden Durchschnittsfiltern und der Erkennung von Gewinn-/Verlustmustern können Händler intelligentere, datengestützte Entscheidungen treffen.
Hauptmerk
FREE

Dieser Indikator zeigt die verbleibende Kerzenzeit an. Die verbleibende Zeit der Kerze wird alle 200 Millisekunden berechnet. 1. Sie können x (horizontal), y (vertikal) des Textes einstellen. 2. Sie können Schriftart, Farbe und Größe des Textes einstellen. 3. Sie können den Text entfernen, ohne den Indikator aus dem Chart entfernen zu müssen. Die verbleibende Zeit der Kerze hängt von dem Zeitrahmen des Charts mit dem Indikator ab.
FREE

Der Volatility Limit Trend Indicator (VLT), ein Originalindikator dieses Entwicklers, ist ein Trendindikator, der auf der Festlegung eines festen Volatilitätslimits als Prozentsatz des Preises basiert. Der volatile Preis darf zwischen zwei Kanallinien wandern, die die feste Volatilität um eine zentrale Linie definieren. Wenn der Kurs eine der Kanallinien überquert, wird die zulässige Volatilität überschritten, was eine von zwei Situationen einleitet: entweder eine Fortsetzung oder eine Umkehr de
FREE

APP System Signals ist ein technischer Indikator, der für aktive Nutzer auf den Finanzmärkten entwickelt wurde. Er verwendet eine Kombination aus exponentiellen gleitenden Durchschnitten (EMA), einfachen gleitenden Durchschnitten (SMA) und Trendanalysen, um Kauf- und Verkaufssignale auf der Grundlage historischer Kursbewegungen und Marktstrukturen zu identifizieren. Alle Parameter sind vollständig anpassbar, sodass der Nutzer das Werkzeug individuell auf seine bevorzugte Analyse- oder Handelsmet
FREE
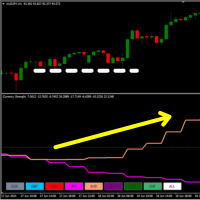
28 Märkte in einem einzigen Indikator! Sie haben 8 Linien und jede repräsentiert eine Währung { EUR - USD - GBP - JPY - AUD - NZD - CAD - CHF } .
Was macht er? Es berechnet einen benutzerdefinierten Oszillator für alle 28 Forex-Paare und zeigt Ihnen die Stärke jeder Währung an. Auf diese Weise können Sie den Trend und die Volatilität in einem Mehrwährungskurs analysieren. Wenn Sie auf zwei verschiedene Währungen klicken , ändert sich auch der Markt sofort.
Wie wird er verwendet? Sie können di
FREE

Merkmale:
- Aktueller TF GMMA Cross und Trend (Obligatorischer Check.. G-Up/G-Down) - HTF GMMA Trend Check (optional.. schräger Pfeil) - TDI oder NRTR Trend Check (Optional.. Diamant)
Lesen Sie den Beitrag für eine detaillierte Beschreibung und das Herunterladen von zusätzlichen Indikatoren: https://www.mql5.com/en/blogs/post/758264
Scanner:
Dies ist ein Dashboard-Scanner zum Auffinden guter Trades unter Verwendung der GMMA-Methode als Basis und der TDI-Methode zur Trendüberprüfung. Alle Scha

** Alle Symbole x Alle Zeitrahmen scannen nur durch Drücken der Scanner-Taste ** *** Kontaktieren Sie mich , damit ich Ihnen eine Anleitung schicken und Sie in die "ABCD-Scanner-Gruppe" aufnehmen kann, um Erfahrungen mit anderen Benutzern auszutauschen oder zu sehen. Einführung Dieser Indikator scannt AB=CD Retracement-Muster in allen Charts. Das ABCD ist ist die Grundlage für alle harmonischen Muster und hoch repetitiv mit einer hohen Erfolgsrate . Der ABCD-Scanner-Indikator ist ein ABCD-Umkeh

Hello, I need reviews from you guys. Thank you Der Fractal Swing Detector Pro Indikator wurde entwickelt, um Händlern dabei zu helfen, wichtige Schwungpunkte auf dem Markt zu identifizieren . Durch die Kombination von Fraktal- und Pivot-Analyse bietet dieser Indikator tiefere Einblicke in Kursbewegungen und potenzielle Umkehrpunkte . Hauptmerkmale: Fraktalanalyse : Identifizieren Sie hohe und niedrige Fraktale mit der Option, entweder 3 oder 5 Balken-Fraktale zu verwenden . Fraktale helfen, kle
FREE
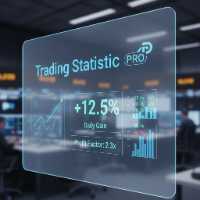
Der statistische Indikator für den Metatrader 5 TradingStatisticPro sammelt statistische Daten über Ihren Handel, die es Ihnen erleichtern, die Effektivität des Handels, den erzielten Gewinn und die Risiken zu beurteilen. Der Indikator ist kompakt in der Ecke des Hauptcharts des Terminals platziert und zeigt die folgenden Informationen an: 1. Der erzielte Gewinn. 2. Der maximale Drawdown. 3. Der Erholungsfaktor. 4. Der Gewinnfaktor. 5. Das Verhältnis von gewinnbringenden und ungewinnbringenden
FREE

Fractals ST Patterns ist eine Modifikation des Fractals-Indikators von Bill Williams. Im Gegensatz zum Standard-Fraktal-Indikator kann man bei Fractals ST Patterns eine beliebige Anzahl von Balken einstellen, um ein Fraktal zu finden. Dieser einfache Indikator entspricht den in der ST-Patterns-Strategie (https://stpatterns.com/) angegebenen Parametern. Strukturelle Zielmuster sind der Markt selbst, der konsequent in Komponenten unterteilt ist. Für die Bildung von ST-Patterns werden keine Trendli
FREE

Der Indikator verwendet die Kanalberechnungsmethode von Chester W. Keltner, die von der bekannten Traderin Linda Raschke modifiziert wurde. Durch die Modifikation enthält der berechnete Kanal einen wesentlich vollständigeren Überblick über die Kursbewegungen, wodurch die Wahrscheinlichkeit einer genauen Vorhersage der kommenden Kursbewegung erhöht wird. Anders als bei der klassischen Keltner-Methode wird die Basislinie des Kanals auf der Grundlage des Exponential Moving Average eingezeichnet, un
FREE

Was ist ein Point of Interest? Händler, die Smart-Money-Konzepte verfolgen, bezeichnen dies als Liquiditätspunkt oder als Bereiche, in denen von Einzelhändlern Liquidität aufgebaut wurde, auf die die Großbanken abzielen, um große Kursbewegungen auf dem Markt zu erzeugen. Wie wir alle wissen, verwenden Kleinhändler veraltete und unzuverlässige Handelsmethoden wie Trendlinien, Unterstützung und Widerstand, RSI, MACD und viele andere, um Geschäfte zu platzieren und ihre Stop-Loss-Punkte an Schlüsse

Weil Stil wichtig ist
Ich weiß, wie lästig es ist, jedes Mal auf Eigenschaften zu klicken, um die Farbe der Kerze zu ändern, den Hintergrund hell oder dunkel zu machen und das Gitter einzufügen oder zu entfernen. Hier ist die Lösung mit nur einem Klick:
Drei anpassbare Schaltflächen zur Auswahl des Kerzenstils, den Händler wünschen. Eine Schaltfläche zum Umschalten zwischen Tag- und Nachtmodus. Eine Schaltfläche zum Ein- und Ausblenden des Gitters in den Charts. *****In den Einstellungen kön
FREE

Renko Charts mit Heiken Ashi Filter haben jetzt die Alarme und die Win-Rate . Jetzt können Sie wissen, welches Signal Ihnen den Vorteil verschafft, den Sie für Ihren Handel benötigen. Risiko-Belohnungs-Einstellungen Gewinne gegen Verluste zählen Sie können zwischen vier Alarmtypen wählen, die Sie auf dem Bildschirm, per E-Mail oder per Telefon benachrichtigen. Die Alarmtypen haben auch Puffer für die Verwendung mit der Automatisierung. Dieser Indikator kann in jedes System integriert werden, das

Dieser Indikator scannt für Sie bis zu 30 Handelsinstrumente und bis zu 8 Zeitrahmen auf das Auftreten der hochwahrscheinlichen Umkehrmuster: Double Tops/Bottoms mit gefälschten Ausbrüchen . Bitte lesen Sie auch den Blog-Beitrag "Professionelles Trading mit Double Tops/Bottoms und Divergenzen ", der die Konzepte hinter dem ULTIMATE Double Top/Bottom-Indikator erklärt und wie Sie einen professionellen Top-Down-Ansatz nutzen können. Diese KOSTENLOSE Version des Scanners scannt nur EURUSD und GBPUS
FREE

Sonderangebot zu Ehren des neuen Jahres und Weihnachten!! https://www.mql5.com/ru/users/bossik2810
Trend-Filter Pro
Trend Filter Indikator.
Sehr guter Filter für Ihr Handelssystem, ich empfehle, ihn zusammen mit - System Trend Pro oder Quantum Entry PRO zu verwenden
Der Indikator malt nicht nach!!!
Einstellungen :
Ändern Sie den Parameter Periode für eine bessere Filterung ( Standard ist 90)
Haben Sie Fragen? Brauchen Sie Hilfe?, Ich bin immer glücklich zu helfen, schreiben Sie mir in
FREE
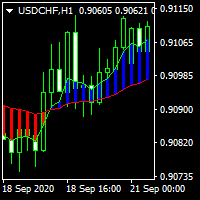
............................................hi................................................ .........................ist ein einfacher Indikator für gleitende Durchschnitte ............................
.........................verschiedene Darstellungen von gleitenden Durchschnitten.......................... ...............kann Zeitraum, Verschiebung, Modus und angewandten Preis auswählen.................. ............viele Händler nutzen gleitende Durchschnitte, um Marktbewegungen zu erkenne
FREE

Zukunftsvorhersage ist etwas, was jeder Händler gerne wissen würde, durch diese einfache Vorhersage Algorithmus kann ein Bild der Zukunft geben. Dieser Algorithmus basiert auf vergangenen Daten und die durchschnittlichen Preise der Daten, um zukünftige Kerzen zu simulieren. Dies ist ein Indikator, der neu gezeichnet werden wird. Dieser Indikator ist völlig kostenlos, kann als Trend Referenz verwendet werden, aber absolut nicht für den Handel verwenden.
FREE

Th3Eng HistoMaster Indikator Kostenloser Histogramm-Indikator zur Erkennung der aktuellen Trendrichtung. Der Indikator basiert auf dem CCI-Indikator. Zeichnet auch Pfeile, wenn er einen starken Kauf- oder Verkaufstrend erkennt, mit Alarmsystem (Popup mit Ton, E-Mail-Benachrichtigung und mobile Benachrichtigung). Zeichnet auch ein Dashboard zeigt alle Time-Frames "aktuelle Signal.
Anforderungen
Funktioniert mit allen Paaren, Aktien, CFDs und Kryptowährungen. Funktioniert mit allen Spreads Funkti
FREE
Entfesseln Sie intelligentes Handeln mit dem Smart Signal Generator Haben Sie genug vom Rätselraten bei Ihrem Handel? Der Smart Signal Generator ist Ihr neues, unverzichtbares Werkzeug, das Ihre Strategie vereinfacht und Ihnen einen entscheidenden Vorteil verschafft. Es handelt sich nicht um einen weiteren Indikator, sondern um ein System, das Ihnen mit hoher Wahrscheinlichkeit Einstiegssignale liefert, die Ihnen Zeit sparen und Ihr Vertrauen stärken. Hauptvorteile und Merkmale Intelligente Sign
FREE

QuantumAlert Stoch Navigator ist ein kostenloser Indikator, der für MT4/MT5-Plattformen verfügbar ist. Seine Aufgabe ist es, "Alarme" zu liefern, wenn sich der Markt in "überkauften und überverkauften" Regionen in Form von "Kauf- oder Verkaufssignalen" befindet. Dieser Indikator verfügt über viele Anpassungsoptionen, die im Abschnitt "Parameter" unten aufgeführt sind. Der Benutzer kann diese Parameter nach Bedarf anpassen. Treten Sie unserer MQL5-Gruppe bei, in der wir wichtige Neuigkeiten und U
FREE
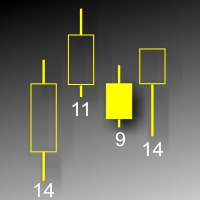
Dieser Indikator zeigt das Volumen (sichtbarer Bereich) eines jeden Balkens in Punkten an. Die Anzeigeparameter sind anpassbar. Der Indikator wurde für den persönlichen Gebrauch (Chartanalyse) entwickelt. Parameter: ColorL - Farbe der Textbeschriftung. Position - Position der Beschriftung: 0 - unten, 1 - oben. FontSize - Schriftgröße. ANGLE - Neigungswinkel des Textes.
FREE

Mahdad Candle Timer MT4 - Kerzen-Countdown in Echtzeit Mahdad Candle Timer ist ein leichter und präziser MetaTrader 4 Indikator, der die verbleibende Zeit bis zum Schließen der aktuellen Kerze direkt neben dem letzten Balken anzeigt. Er wurde für Trader entwickelt, die sich auf ein genaues Timing verlassen - sei es beim Scalping, Daytrading oder beim Warten auf die Kerzenbestätigung bei Swing-Setups. Hauptmerkmale Präziser Countdown - Verbleibende Zeit in HH:MM:SS (optional Millisekunden) Dy
FREE

Fraktalindikator für mehrere Zeitrahmen, der den Fraktalpunkt des höheren Zeitrahmens auf den niedrigeren Zeitrahmen anzeigt.
Parameter Fraktal_Zeitrahmen : Sie können die höheren Timeframes für Fraktale festlegen. Maxbar : Sie können die maximale Anzahl von Kerzen für die Berechnungen festlegen. Auf_Fraktal_Farbe, Auf_Fraktal_Symbol, Ab_Fraktal_Farbe, Ab_Fraktal_Symbol : Farb- und Stileinstellungen für die Fraktalpunkte. Linie_erweitern : Zeichnet eine horizontale Linie vom vorherigen Fraktalp
FREE
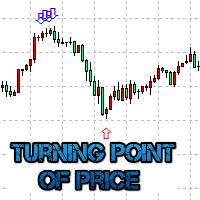
Der Preiswendepunkt-Indikator zeigt angenommene Preiswendepunkte auf dem Chart an. Er basiert auf den Daten des Prise Reversal Oszillators und des Standard-ADX. Wenn sich der Wert des Prise Reversal Oszillators in einem überkauften oder überverkauften Bereich befindet (die Größe des Bereichs wird vom Benutzer festgelegt) und der Wert der ADX-Hauptlinie den voreingestellten Wert überschreitet, zeichnet der Indikator für den Wendepunkt des Preises einen Pfeil, der auf die weitere angenommene Preis

Ultimate Market Master Trend Beherrschen Sie die Richtung des Marktes mit Präzision Der Ultimate Market Master Trend-Indikator ist ein All-in-One-Marktstimmungsanalysator, der für Händler entwickelt wurde, die Klarheit, Genauigkeit und Vertrauen in jede Bewegung verlangen.
Er kombiniert intelligente Trenderkennung , stochastisches Momentum für mehrere Zeitrahmen und dynamische visuelle Hinweise , um Ihnen zu helfen, mit Leichtigkeit hochwahrscheinliche Ein- und Ausstiege zu identifizieren. Haupt
Der Indikator Currency Strength Lines (CSL) ist sowohl für Anfänger als auch für erfahrene Trader ein sehr nützliches Instrument. Er ist in der Lage, die Stärke einzelner Währungen zu berechnen und auf einem Diagramm darzustellen, so dass Sie den Trend erkennen und Handelsmöglichkeiten ausmachen können.
Wie funktioniert er? Der CSL-Indikator führt Berechnungen für alle 28 Währungspaare durch und ermittelt so die Gesamtstärke der einzelnen Währungen zu einem bestimmten Zeitpunkt. Anhand dieser D
FREE

Unverzichtbar für Trader: Tools und Indikatoren Waves automatisch berechnen Indikatoren, Kanal Trend Handel Perfekte Trend-Welle automatische Berechnung Kanal Berechnung , MT4 Perfekte Trend-Welle automatische Berechnung Kanalberechnung , MT5 Lokales Trading Kopieren Einfaches und schnelles Kopieren, MT4 Einfaches und schnelles Kopieren, MT5 Lokales Trading-Kopieren für DEMO Einfaches und schnelles Kopieren , MT4 DEMO Einfaches und schnelles Kopieren , MT5 DEMO
Der homöopathische Indikator w
FREE
Zeigt den Wert des Kaufman-Effizienz-Verhältnisses, geglättet durch MA. Die Berechnung basiert auf der Bewegung geteilt durch die Volatilität in einem bestimmten Zeitraum. Die Niveaus und die Visualisierung sind einstellbar. Parameter: KERPeriod - Zeitraum für die Berechnung des Verhältnisses. EMAPeriod - Periode für den gleitenden Durchschnitt. Verschiebung - Verschiebung des Indikators. HigherLevel - niedriger Wert der höheren Zone. LowerLevel - hoher Wert der unteren Zone. ShowHigherZone - er
FREE

Der Hull Moving Average (HMA), entwickelt von Alan Hull im Jahr 2005, ist einer der sich am schnellsten bewegenden Durchschnittswerte, reduziert die Verzögerung und ist einfach zu verwenden, um Trends sowohl kurz- als auch langfristig zu identifizieren. Dieser Indikator basiert auf der exakten Formel des gleitenden Hull-Durchschnitts mit 3 Phasen der Berechnung: Berechnung des gewichteten gleitenden Durchschnitts (WMA_01) mit Periode n/2 & (WMA_02) mit Periode n Berechnen Sie RAW-HMA: RAW-HMA =
FREE

Smart Reversal Signal ist ein professioneller Indikator für die MetaTrader 4 Plattform, der von einer Gruppe professioneller Trader entwickelt wurde. Dieser Indikator ist für den Handel mit Forex und binären Optionen konzipiert. Wenn Sie diesen Indikator kaufen, erhalten Sie: Ausgezeichnete Indikator-Signale. Kostenlose Produktunterstützung. Regelmäßige Aktualisierungen. Verschiedene Benachrichtigungsoptionen: Alert, Push, Emails. Sie können ihn für jedes Finanzinstrument (Forex, CFD, Optionen)

WaPreviousCandleLevels MT4 zeigt die vorherigen Kerzenniveaus, es zeigt die vorherigen Kerzen Open High Low Close Levels (OHLC Levels) in verschiedenen Zeitrahmen. Es wurde entwickelt, um dem Händler zu helfen, den Markt zu analysieren und die Aufmerksamkeit auf die vorherigen Kerzenlevel in verschiedenen Zeitrahmen zu richten. Wir alle wissen, dass die OHLC-Levels auf Monats-, Wochen- und Tagesbasis sehr stark sind und dass der Preis in der Regel stark auf diese Levels reagiert. In der technis
FREE
Der MT4-Indikator, den wir hier beschreiben, wurde entwickelt, um Händler mit einem Alarm, einer Benachrichtigung und einer E-Mail zu versorgen, wenn Fibonacci-Levels überschritten werden. Die Fibonacci-Levels werden auf der Grundlage des Zickzack-Indikators berechnet, der hilft, potenzielle Trendumkehrungen auf dem Markt zu erkennen. Wenn der Indikator feststellt, dass ein Kurs ein Fibonacci-Level überschritten hat, löst er einen Alarm aus und sendet eine Benachrichtigung an die MT4-Mobil-App d
FREE

Dies ist ein Indikator, der die Trendrichtung erkennt. Er verwendet den beliebten Bill Williams Alligator. Er zeigt den Marktzustand auf allen Zeitrahmen in einem Diagramm an. Es ist bekannt, dass Trader den größten Gewinn auf dem Forex-Markt erzielen, wenn sie nach dem Trend handeln, und dass Verluste normalerweise auftreten, wenn der Markt flach ist. Um also Gewinne zu erzielen, sollte ein Händler lernen, den Trendmarkt und die Richtung des aktuellen Trends schnell zu erkennen. Dieser Indikato
FREE

RSI-Signal-Scanner Der primäre Trend der Aktie oder des Vermögenswerts ist ein wichtiges Instrument, um sicherzustellen, dass die Messwerte des Indikators richtig verstanden werden. Einige technische Analysten haben zum Beispiel die Idee propagiert, dass ein überverkaufter RSI-Wert in einem Aufwärtstrend wahrscheinlich viel höher als 30 % ist und ein überkaufter RSI-Wert in einem Abwärtstrend viel niedriger als 70 % ist. Dieser Indikator benachrichtigt Sie über wichtige RSI-Ausbrüche (30 % und 7
FREE

Verwandeln Sie Ihren MetaTrader 4 Chart in ein professionelles Handelscockpit. Apex Dashboard ist ein hochleistungsfähiges Dienstprogramm, das für ernsthafte Trader entwickelt wurde, die einen vollständigen Überblick über die Situation benötigen. Es geht über eine einfache Überwachung hinaus und bietet einen umfassenden Überblick über die Solvenz, die Performance und das Risiko Ihres Kontos in Echtzeit. Im Gegensatz zu Standardindikatoren verfügt Apex Dashboard über eine Persistent Data Engine .
FREE
Hochgradig konfigurierbarer gleitender Durchschnittsindikator.
Merkmale: Hochgradig anpassbare Alarmfunktionen (bei Levels, Kreuzen, Richtungsänderungen per E-Mail, Push, Sound, Popup) Multi-Timeframe-Fähigkeit Farbanpassung (bei Niveaus, Kreuzen, Richtungsänderungen) Option für lineare Interpolation Funktioniert im Strategie-Tester im Multi-Timeframe-Modus (auch am Wochenende ohne Ticks) Parameter:
MA Timeframe: Sie können den unteren/höheren Zeitrahmen für MA einstellen. MA Bar Shift: Sie kön
FREE

Vorteile: Basiert auf klassischen Indikatoren - ATR, Gleitender Durchschnitt Bestimmt den Trend / Flat im Markt durch Einfärben des Histogramms mit der entsprechenden Farbe Pfeile zeigen bestätigte Signale an Es ist ein hervorragender Filter für Kanalstrategien (bei Extremen)
Einstellungen :
Наименование Описание настройки Periode des Flachdetektors Anzahl der Balken/Kerzen für die Analyse Zeitraum des EMA Zeitraum des EMA (Gleitender Durchschnitt) Zeitraum der ATR Zeitraum von ATR (aktueller
FREE

Tritt dem Koala Trading Solution-Kanal in der MQL5-Community bei, um die neuesten Signale und Nachrichten zu allen Koala-Produkten zu erfahren. Der Beitrittslink befindet sich unten: https://www.mql5.com/en/channels/koalatradingsolution Beschreibung :
Wir freuen uns, Ihnen unseren neuen kostenlosen Indikator vorzustellen, der auf einem der professionellen und beliebten Indikatoren auf dem Devisenmarkt (Parabolic SAR) basiert. Dieser Indikator ist eine neue Modifikation des ursprünglichen Pa
FREE
Erfahren Sie, wie man einen Handelsroboter im MetaTrader AppStore, dem Shop für Applikationen für die MetaTrader Handelsplattform, kaufen kann.
Das Zahlungssystem der MQL5.community ermöglicht Zahlungen mit PayPal, Kreditkarten und den gängigen Zahlungssystemen. Wir empfehlen Ihnen eindringlich, Handelsroboter vor dem Kauf zu testen, um eine bessere Vorstellung von dem Produkt zu bekommen.
Sie verpassen Handelsmöglichkeiten:
- Freie Handelsapplikationen
- Über 8.000 Signale zum Kopieren
- Wirtschaftsnachrichten für die Lage an den Finanzmärkte
Registrierung
Einloggen
Wenn Sie kein Benutzerkonto haben, registrieren Sie sich
Erlauben Sie die Verwendung von Cookies, um sich auf der Website MQL5.com anzumelden.
Bitte aktivieren Sie die notwendige Einstellung in Ihrem Browser, da Sie sich sonst nicht einloggen können.