Technische Indikatoren für den MetaTrader 4 - 15

Zeichnet automatisch Fibonacci-Levels basierend auf den Höchst- und Tiefstpreisen des angegebenen Zeitrahmens Mehrere Balken können kombiniert werden: z.B. können Sie ein Fibonacci basierend auf den 10-Tage-Hochs und -Tiefs erhalten Mein #1 Tool : 66+ Funktionen, einschließlich dieses Indikators | Kontaktieren Sie mich bei Fragen | MT5-Version Hilft, potenzielle Umkehrlevel zu erkennen; An Fibonacci-Levels gebildete Muster sind oft stärker; Deutlich weniger Zeitaufwand für

Der Indikator definiert einen Handelskorridor, einen flachen Markt und Korrekturen.
Ermöglicht es Ihnen, die Bedeutung verschiedener flacher und trendmäßiger Bereiche zu vergleichen (nach Dauer des Bestehens und nach Volatilität). Dies ermöglicht es, den Marktzyklus und seine Stimmung auf einen Blick einzuschätzen.
Das heißt, wie lange dauert das Flat im Durchschnitt, und wie lang ist der Trend und welche Art von Volatilität haben sie in Punkten.
In der Regel gilt: Je länger das Flat dauert

Dieser Indikator zeigt Kauf- oder Verkaufssignale gemäß der Definition der Handelszone von Bill Williams an. [ Installationsanleitung | Update-Anleitung | Fehlerbehebung | FAQ | Alle Produkte ] Einfach zu bedienen und zu verstehen Vermeiden Sie den Handel mit flachen Märkten Deterministischer Indikator mit klaren Regeln Der Indikator zeichnet sich nicht neu auf Er implementiert alle Arten von Alarmen Der Indikator hat eindeutige Auswirkungen auf den Handel. Ein blauer Pfeil ist ein Kaufsignal Ei
FREE

Das Dashboard zur Währungsstärke des gleitenden Durchschnitts ist ein leistungsstarker und umfassender Indikator, der einen tiefen Einblick in die Währungsdynamik über mehrere Symbole und Zeitrahmen hinweg bietet. Dieses robuste Tool nutzt gleitende Durchschnitte, um die neuesten Kreuzungspunkte zu identifizieren und verfolgt effektiv die Stärke von Währungen bis zum aktuellen Preis. Mit seinem intuitiven Design und der benutzerfreundlichen Oberfläche bietet dieses Dashboard eine Fülle von

Der ICT Asian Range Indicator ist ein leistungsstarkes Tool, das Händlern hilft, wichtige Marktstrukturen und Liquiditätszonen basierend auf der ICT Asian Range Trading Strategy zu identifizieren. Er markiert die höchsten und niedrigsten Kursniveaus der asiatischen Sitzung (19:00 bis 24:00 Uhr New Yorker Zeit) und liefert wichtige Einblicke in die Marktbewegungen der folgenden Handelssitzungen. Dieser Indikator erhöht die Handelsgenauigkeit durch die Anzeige von Liquiditätsüberschreitungen u
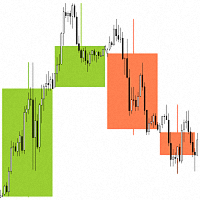
" Candlesticks MTF 4" ist ein Informationsindikator, der "japanische Candlesticks" anzeigt. Der Indikator analysiert und bestimmt die Eröffnungs- und Schlusszeiten von Kerzen aus höheren Zeitrahmen.
Für den Indikator "Candlesticks MTF 4" wurde ein Algorithmus entwickelt, der die Diskrepanz zwischen den Eröffnungs- und Schlusszeiten von Kerzen aus höheren Zeitrahmen korrigiert. Wenn zum Beispiel der Eröffnungszeitpunkt einer Kerze auf einem wöchentlichen Zeitrahmen der 1. des Monats ist und auf
FREE

Empfohlen für M15 und höhere Zeitrahmen
Sendet Alarme und Benachrichtigungen, wenn die Zone erstellt wird
Sendet Alarme und Benachrichtigungen, wenn die Zonen erneut getestet werden
Sie werden die Handelszonen sehen und die profitabelsten Punkte zum Eröffnen von Positionen identifizieren. Der Indikator markiert die Angebots- und Nachfragezonen.
Mit dieser Anzeige können Sie jetzt profitable Trades tätigen, die die Trends bestimmen.
Zeigt alle Unterstützungs- und Widerstandszonen an.
Kann
FREE
Hör auf zu raten, fang an zu schießen: Der neue SR Sniper! Haben Sie genug von zufällig erscheinenden Einstiegspunkten? Der SR Sniper-Indikator ist Ihr neues, unverzichtbares Werkzeug, um mit chirurgischer Präzision hochwahrscheinliche Trades zu finden. Er wurde entwickelt, um das Marktrauschen zu durchdringen und Ihnen klare Kauf- und Verkaufssignale genau an den kritischsten Preiszonen zu geben. Dieser leistungsstarke Indikator kombiniert die dynamische Analyse des Commodity Channel Index (CC
FREE

Cyber Engulf Indikator - Professionelles Handelssystem für MetaTrader 4 Was ist der Indikator?
Cyber Engulf ist ein fortschrittlicher Indikator für die technische Analyse, der Engulfing-Muster erkennt, die durch gleitende Durchschnitte gefiltert werden. Er identifiziert Trendumkehrpunkte und hilft Ihnen, Veränderungen in der Marktstruktur frühzeitig zu erkennen. Was macht er? Identifiziert automatisch Engulfing-Candlestick-Muster Filtert falsche Signale mithilfe des gleitenden Durchschnitts her
FREE
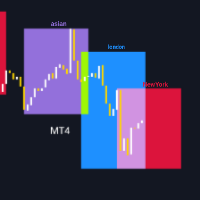
Bevor Sie die Funktionen dieses Indikators erkunden, bewerten Sie bitte dieses Produkt, hinterlassen Sie einen Kommentar zur Ihrer Erfahrung und abonnieren Sie meine Seite, um über die neuesten Veröffentlichungen und Werkzeuge informiert zu bleiben. Ihre Unterstützung ist wertvoll und hilft mir, meine Kreationen ständig zu verbessern! Beschreibung: Der TradingSessionVisualizer ist ein leistungsstarker Indikator für MetaTrader 4, der eine klare und anpassbare Visualisierung der wichtigsten Handel
FREE

Prüfen Sie meine kostenpflichtigen Tools sie funktionieren perfekt Bitte bewerten Sie Der einstellbare PIN BAR-Indikator ist ein nützliches Tool zur Suche nach Pin Bars, die Sie im Preisdiagramm finden möchten. Er verfügt über 2 Parameter, um die Art der Pin Bars herauszufiltern, nach denen Sie suchen möchten: 1) MinTailProc 75% (Standardeinstellung), was bedeutet, dass Pin Bars angezeigt werden, die eine Mindestgröße der Nose (Tail) von 75% der vollen Kerzengröße haben. Wenn die obere Nose (Tai
FREE
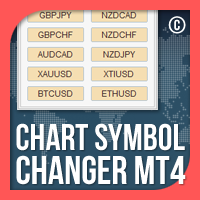
Chart Symbol Changer für MT4 ist ein Indikator/Dienstprogramm, das Ihnen die Möglichkeit bietet, das aktuelle Chartsymbol, das mit einem Klick auf eine Symbolschaltfläche auf seinem Panel verbunden ist, zu ändern. Chart Symbol Changer für MT4 bietet Ihnen die Möglichkeit, die 32 Symboltasten nach Ihren persönlichen Vorlieben zu konfigurieren, indem Sie die Paare hinzufügen, die Sie im Auge behalten und am häufigsten handeln möchten. Auf diese Weise verpassen Sie keine Gelegenheit, denn mit weni
FREE
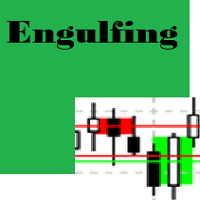
Engulfing Candle Detektor
Erkennbare Muster Double Candlestick-Muster Bullish Engulfing
Die erste Kerze ist eine schwarze Kerze. Die zweite Kerze eröffnet mit einer Lücke unter dem realen Körper der schwarzen Kerze, erholt sich aber nach oben und schließt über dem realen Körper der schwarzen Kerze. Mit anderen Worten, der reale Körper der zweiten Kerze verschlingt den realen Körper der ersten Kerze vollständig. Bearish Engulfing
Die erste Kerze ist eine weiße Kerze. Die zweite Kerze eröffnet m
FREE

Sentinel Arrow Hauptmerkmale:
⊗Exklusiver Algorithmus zur schnellen und präzisen Erkennung von Trends, Trendumkehrungen und Momentumwechseln.
⊗Entwickelt für den professionellen Einsatz, mit robuster Signallogik, die Verzögerungen und Fehlalarme verhindert.
⊗Geeignet für verschiedene Zeitrahmen.
⊗Zeichnet, löscht oder verändert keine vergangenen Signale.
⊗Alle Kauf- und Verkaufssignale werden direkt im Candlestick generiert und bleiben unverändert.
⊗Im realen Handel werden die Signale nic
FREE

Der Pipsometer Pro Indikator ist ein unverzichtbares, minimalistisches Tool, das für den disziplinierten Trader entwickelt wurde, der sofortiges Finanzfeedback auf einen Blick benötigt. Er fungiert als dedizierte Echtzeit-Anzeige, die kontinuierlich Ihren aktuellen schwebenden Gewinn oder Verlust, gemessen ausschließlich in **Pips**, für jeden offenen Handel auf dem aktiven Chart berechnet und anzeigt. Dieser Fokus auf Pips statt auf den Geldwert ermöglicht es Händlern, die Marktleistung und di
FREE
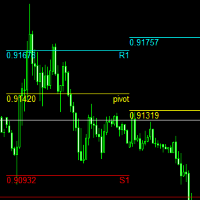
Pivot-Punkte werden von vielen Händlern verwendet und Pivot-Levels sind meistens sehr hilfreich. Dieser Indikator ist eine benutzerdefinierte mit internen Parametern. es kann zeigen, zwei mal Pivot (wöchentlich und täglich). Sie können wählen, Perioden insgesamt für jede Zeit zeigt Pivots.( 1 Woche , 2 Woche ,...1day , 2day ,...) Wenn Sie wöchentliche und tägliche Pivots verwenden, kann es Ihnen viele Unterstützungs- und Widerstandszonen zeigen. wenn haben Vorschlag Kommentar zu mir für die Aktu
FREE
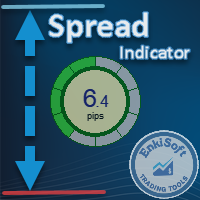
Benutzerdefinierter Spread-Indikator *Bitte schreiben Sie eine Bewertung, danke!
Auch eine MT5-Version ist verfügbar
Spread-Indikator zeigt den aktuellen Spread in Pips mit Farbcodes an. Behandelt 3 Stufen, Niedrig, Mittel, Hoch. Sie können Ebenen und Farben für jede Ebene (z. B. Low: Grün, Medium: Orange, High: Rot), und können wählen, Anzeigeposition auf dem Chart.
Es gibt zwei Spread-Berechnungsmodi: -> Server-Spread-Wert -> Ask - Bid Wert
Sie können die Deckkraft für eine bessere Anpassu
FREE
Level Box Tool ist ein leistungsstarker und benutzerfreundlicher Indikator für Händler, die technische Analysetools wie Rechtecke und Trendlinien verwenden , um wichtige Unterstützungs-, Widerstands- und Preiszonen zu identifizieren. Dieses Tool vereinfacht und beschleunigt den Prozess der Markierung von Chart-Levels und bietet mit seinem vollständig anpassbaren Panel sowohl visuelle Klarheit als auch Präzision und umfasst jetzt auch Preis-Cross-Warnungen - damit Sie nie wieder ein wichtiges Lev
FREE

Bitte überprüfen Sie regelmäßig die Registerkarte "What's new " für eine vollständige und aktuelle Liste aller Verbesserungen + Parameter. KOSTENLOSER Indikator für mein Handelsprogramm Take a Break . Dieser Indikator ermöglicht es Ihnen, mehrere andere EAs mit nur einer Take a Break EA-Instanz zu verwalten. Geben Sie einfach die entsprechende Chart-Gruppe in den Indikator(en) und den Take a Break EA-Einstellungen an und schon kann es losgehen.
Setup-Beispiele (Indikator + EA)
Als Voraussetzun
FREE
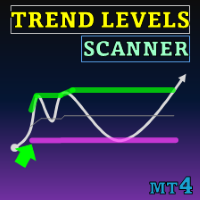
Special offer : ALL TOOLS , just $35 each! New tools will be $30 for the first week or the first 3 purchases ! Trading Tools Channel on MQL5 : Join my MQL5 channel to update the latest news from me Der Trend Levels -Indikator wurde sorgfältig entwickelt, um während Marktbewegungen kritische Trendniveaus — Hoch, Mittel und Tief — präzise zu identifizieren. Mit Echtzeitberechnungen, die auf den höchsten, niedrigsten und mittleren Werten über einen anpassbaren Rückblickzeitraum basier
Beschreibung:
NR4 & NR7 Inside Bar Highlighter für MetaTrader 4 ist ein Indikator, der automatisch Preis-Kompressionsmuster erkennt, basierend auf der Kombination von NR4 oder NR7 mit einem Inside Bar . Funktionsweise:
Das Muster NR4 (Narrow Range 4) identifiziert die Kerze mit der kleinsten Spanne der letzten 4 Balken, während NR7 die letzten 7 betrachtet. Wenn diese enge Spanne zusammen mit einem Inside Bar (eine Kerze, die vollständig in der vorherigen enthalten ist) auftritt, deutet das hä
FREE
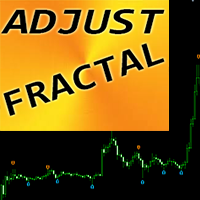
„Adjustable Fractals“ – ist eine erweiterte Version des Fraktalindikators, ein sehr nützliches Handelstool!
– Wie wir wissen, hat der Standard-Fraktalindikator mt4 überhaupt keine Einstellungen – das ist für Händler sehr unpraktisch. – Adjustable Fractals hat dieses Problem gelöst – es hat alle notwendigen Einstellungen: - Einstellbarer Zeitraum des Indikators (empfohlene Werte – über 7). - Einstellbarer Abstand von Hochs/Tiefs des Preises. - Einstellbares Design fraktaler Pfeile. - Der Indika
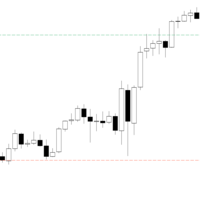
PDHL - zeigt einfach die Höchst- und Tiefstwerte der vergangenen Tage direkt in Ihrem Diagramm an und bietet so eine schnelle und visuelle Referenz für vergangene Schlüsselwerte. Der Indikator ist leichtgewichtig und leicht anpassbar . Sie können die Anzahl der angezeigten Tage, die Farben sowie den Stil und die Dicke der Linien nach Ihren Wünschen einstellen. Der Indikator ist einfach und praktisch gestaltet, funktioniert aber möglicherweise nicht auf allen Instrumenten oder Plattformen .
Nur T
FREE

Produkttitel Smart Ichimoku (MT4) – Teil der SmartView Indicators Serie Kurzbeschreibung Ein Ichimoku -Indikator mit einzigartiger Benutzererfahrung auf der MetaTrader-Plattform. Bietet erweiterte Funktionen, die zuvor nicht verfügbar waren, wie das Öffnen von Einstellungen per Doppelklick, das Ausblenden und Anzeigen von Indikatoren ohne Löschung und die Anzeige des Indikatorfensters in voller Chartgröße. Entwickelt für nahtlose Zusammenarbeit mit dem Rest der SmartView Indicators Serie. Überbl
FREE

Produkttitel Smart MACD (MT4) – Teil der SmartView Indicators Serie Kurzbeschreibung Ein MACD -Indikator mit einzigartiger Benutzererfahrung auf der MetaTrader-Plattform. Bietet erweiterte Funktionen, die zuvor nicht verfügbar waren, wie das Öffnen von Einstellungen per Doppelklick, das Ausblenden und Anzeigen von Indikatoren ohne Löschung und die Anzeige des Indikatorfensters in voller Chartgröße. Entwickelt für nahtlose Zusammenarbeit mit dem Rest der SmartView Indicators Serie. Überblick Die
FREE
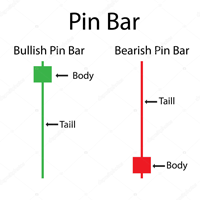
Pin-Bar-Muster sind gekennzeichnet durch einen langen oberen oder unteren Docht mit einem kleinen Körper im Verhältnis zur Größe des Dochts und wenig bis gar keinem unteren oder oberen Schatten. Pin-Bars dürfen nicht isoliert gehandelt werden , sondern müssen im größeren Kontext der Chartanalyse betrachtet werden. Ein Pin-Bar-Einstiegssignal kann in einem Trendmarkt einen sehr wahrscheinlichen Einstieg und ein gutes Risiko-Ertrags-Verhältnis bieten.
Eingaben MinimumTailPips- Mindestgröße des T
FREE
The Super Arrow PRT Indicator generates high-probability trading signals by using multiple indicators such as Moving Averages, Bull/Bear power, Relative Strength Index (RSI), Bollinger Bands, and Magic Filter. It filters out false signals and provides good trade signals by combining these indicators. The Supper Arrow PRT indicator is a trend reversal system that paints buy/sell signal arrows at the potential reversal zone of the price. The buy/sell signal arrows are painted directly on the ch
FREE

Dies ist eine unkonventionelle Version des Heiken Ashi Smoothed-Indikators , der als Linien statt als Histogramm implementiert ist. Im Gegensatz zu einem üblichen Histogramm zeichnet der Indikator die Messwerte der beiden gleitenden Durchschnitte in Form von farbigen Linien.
Beispiel Wenn die Kerze zwei Indikatorlinien nach oben kreuzt, wird davon ausgegangen, dass der Trend von bärisch nach bullisch wechselt. Wenn die Kerze zwei Indikatorlinien nach unten kreuzt, wird davon ausgegangen, dass s
FREE
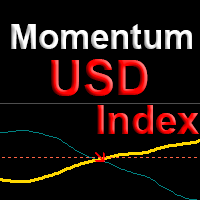
Der Indikator zeigt Punkte für die Fortsetzung des Trends für Währungspaare mit der Beteiligung des USD Dollars mit einer Wahrscheinlichkeit von mehr als 80% an. Der Algorithmus basiert auf dem Vergleich des Momentums des aktuellen Währungspaares mit dem Momentum des DX-Dollar-Index zum aktuellen Zeitpunkt. Die Verwendung des Dollar-Index ermöglicht es uns, nicht nur das aktuelle Paar, sondern das gesamte Bild für alle wichtigen Währungen auf einmal zu bewerten. Dieser Ansatz erhöht die Zuverläs
Volume Profile Order Blocks - Ein intelligenter Weg zur Visualisierung von Liquidität, Volumen und wichtigen Niveaus. Volume Profile Order Blocks ist ein hochmoderner Indikator, der die traditionellen Orderblock-Strategien durch die Einbettung eines detaillierten Volumenprofils direkt in jeder Zone erweitert. Dadurch erhalten Händler einen klaren, datengestützten Überblick darüber, wo das institutionelle Interesse liegen könnte - nicht nur im Preis, sondern auch in der Volumenverteilung. MT5-Ver
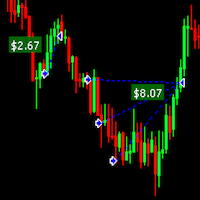
Der DrawProfit-Indikator kann jenen Händlern effizient helfen, die auf dem Chart alle geschlossenen Positionen sehen wollen: Gewinn oder Verlust. Wenn Sie DrawProfit auf Ihren Chart setzen, der von einem Expert Advisor (EA) verwaltet wird, werden Sie dessen Leistung anhand seiner Gewinne und Verluste deutlich sehen. Meine anderen Produkte: https: //www.mql5.com/en/users/hoangvudb/seller
Eingabe-Parameter: Show Profit Labels : zeigt den Gewinn von Aufträgen mit einem Label an (true/false). Gewin
FREE

Gold Pro Scalper
Präzise Einstiegspunkte für Währungen, Krypto, Metalle, Aktien, Indizes! Indikator 100% nicht nachgemalt!!!
Wenn ein Signal erschienen ist, verschwindet es nicht! Im Gegensatz zu Indikatoren mit Redrawing, die zum Verlust der Einlage führen, weil sie ein Signal zeigen können, und dann entfernen Sie es.
Der Handel mit diesem Indikator ist sehr einfach.
Warten Sie auf ein Signal des Indikators und tätigen Sie das Geschäft entsprechend dem Pfeil
(Blauer Pfeil - Kaufen, Roter

Scalping-Indikator. Er berücksichtigt die Volatilität, die Preisbewegung im lokalen Intervall und die Richtung des aktuellen Trends. Empfohlener Zeitrahmen - M5. Vorteile: Geringe Volatilität beim Erscheinen eines Signals sorgt für minimale Bewegung gegen eine offene Position. Der Indikator zeichnet seine Signale nicht neu. Es gibt Alarmsignale. Er ist ein hervorragendes Instrument für den Daytrading.
Einstellungen: Name Beschreibung Zeitraum Zeitraum des Indikators Bereich eines jeden Balkens
FREE

Bei den drei weißen Soldaten und den drei schwarzen Krähen handelt es sich um Umkehrmuster, die einen Richtungswechsel eines Trends vorhersagen. Das Muster besteht aus drei aufeinanderfolgenden Kerzen mit langem Körper, die sich innerhalb des realen Körpers der vorherigen Kerze öffnen, und einem Abschluss, der den der vorherigen Kerze übertrifft. Es ist wichtig zu beachten, dass beide Formationen nur dann gültig sind, wenn sie nach einem starken Aufwärts- oder Abwärtstrend auftreten, während ihr
FREE

Definiert die Extrema. Dieser Indikator besteht aus zwei Teilen. Der erste zeichnet Linien auf dem Diagramm, die eine geringe Volatilität in der relativen täglichen Marktaktivität anzeigen. Der zweite ist für die Bestimmung des Extremwerts verantwortlich und gibt Kauf- oder Verkaufssignale. Dieses System ist für alle Instrumente geeignet. Es wird empfohlen, einen Zeitrahmen von m15 bis h4 zu verwenden. Bevor Sie es verwenden, müssen Sie die Einstellungen für sich selbst wählen. Konfigurieren Sie
FREE

Einführung in den Timebox-Indikator Der Time Box Indicator ist ein unverzichtbarer Indikator für jeden Trader. Er zeigt tägliche, wöchentliche und monatliche Boxen an, je nach Ihren Präferenzen. Sie können jedoch alle wichtigen Kursniveaus in Ihrem Chart automatisch erweitern. Sie können diese als wichtige Unterstützungs- und Widerstandsniveaus verwenden. Es ist ein sehr einfaches, aber effektives Werkzeug für Ihren Handel.
Grafik-Einstellung Weißes Diagramm verwenden Linienstil für den aktuell
FREE

Dieser umfassende technische Indikator berechnet und zeichnet bis zu 3 gleitende Durchschnitte mit 3 verschiedenen Zeiträumen auf. Durch die Verwendung von drei gleitenden Durchschnitten mit unterschiedlichen Rückblickperioden kann der Händler feststellen, ob der Markt tatsächlich eine Trendänderung erfahren hat oder ob er lediglich eine kurze Pause einlegt, bevor er seinen vorherigen Zustand wieder aufnimmt. Das SX Golden MA Pack für MT5 ist hier erhältlich . Je kürzer die Periode des gleitend
FREE

Nur eine weitere einfache Super-Trend-Indikator.
Auf dieser habe ich einen weiteren Puffer (auf Index 2), die auf EA verwendet werden kann hinzugefügt; die Werte ist -1, um eine Baisse-Trend zu identifizieren, während für bullish Trend der Wert 1 ist.
Hier ein Code-Schnipsel:
int trend = ( int ) iCustom ( NULL , Timeframe, "SuperTrend" , Period , Multiplier, 2 , 1 ); Es funktioniert auf jedem Zeitrahmen.
Wenn Sie Hilfe benötigen, um es in Ihren EA zu integrieren, zögern Sie nicht, mich zu ko
FREE

Der Multi Time Frame Indicator fungiert als Scanner, der auf dem Ichimoku-Handelssystem basiert. Das Ergebnis wird auf einer Tafel angezeigt. Dies hilft Ihnen, sich "auf einen Blick" ein mentales Bild des Systems zu machen, ohne den Chart öffnen zu müssen. Es können bis zu 10 Währungen beobachtet werden. Gescannte Elemente und Legende "KUMO Futur" - Grün : Der Kumo Futur ist bullisch. "KUMO Futur" - Rot : Der Kumo Futur ist bärisch. "PRICE Cross KJ" - Grün : Der Preis liegt über dem Kijun Sen. "
FREE
CandleStick Countdown – Kerzenrestzeit-Anzeige CandleStick Countdown ist ein einfaches und praktisches MT4-Indikator, das in Echtzeit einen Countdown anzeigt, wie viele Minuten und Sekunden bis zum Abschluss der aktuellen Kerze verbleiben. Es hilft, die Genauigkeit des Trade-Timings zu verbessern und wird von vielen Tradern genutzt. Hauptfunktionen Zeigt die verbleibende Zeit der aktuellen Kerze im Format „Minuten:Sekunden“ an Als Text auf dem Chart dargestellt, für hohe Sichtbarkeit Position wi
FREE

War: $99 Jetzt: $49
Der Blahtech Daily Range-Indikator zeigt die durchschnittliche tägliche Spanne neben den einzelnen Sitzungsspannen an. Unter Verwendung des täglichen Eröffnungskurses als Referenz zeigt der Indikator feste und dynamische Kursziele als Linien auf den Charts an. Diese Linien zeigen deutlich, wann die durchschnittliche Spanne ausgeschöpft ist. Tages- und Sitzungsspannen können nützlich sein, um Einstiege zu bestätigen oder Ziele festzulegen, und sie sind eine hervorragende Mögl

Einführung
Trendindikator, der keine Einstiegssignale neu zeichnet Zeigt einen genauen Preisumkehrindikator an. Ist eine Handelswaffe, die zu jedem Chart hinzugefügt werden kann. Die Umkehrsignale haben einen hohen Genauigkeitsgrad und eignen sich für Scalping-Trades auf 5-Minuten-Basis oder für den Handel in 30-Minuten-Schwankungen. Kauf- und Verkaufspfeile werden auf dem Chart als Einstiegssignale angezeigt, bilden aber am Ende der K-Linie Bestätigungsoptionen mit Warnungen. Viele Trader habe
FREE
Advanced Breakout Scanner Dashboard Verpassen Sie keine starken Ausbruchsgelegenheiten mehr! Das Advanced Breakout Scanner Dashboard ist ein professionelles Trading-Tool, das bis zu 28 Währungspaare in Echtzeit überwacht und gleichzeitig nach zehn einzigartigen Ausbruchsstrategien mit hoher Wahrscheinlichkeit sucht. Verbinden Sie es mit einem einzigen Chart, um einen vollständigen Überblick über den gesamten Markt zu erhalten und die besten Handels-Setups sofort zu erkennen, wenn sie entstehen.
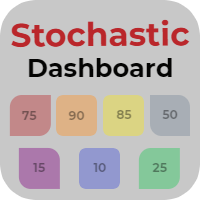
Stochastic Dashboard ist ein Informationspanel, das Ihnen einen globalen Marktüberblick durch einen stochastischen Indikator ermöglicht. Stochastic Dashboard analysiert und verfolgt alle Vermögenswerte, in die Sie investieren möchten. Profitieren Sie von diesem nützlichen Dashboard, mit dem Sie in wenigen Sekunden den Chart öffnen und schnell in ihn investieren können.
Hauptmerkmale von Stochastic Dashboard Grafisches Panel, das es Ihnen ermöglicht, die Situation vieler Vermögenswerte zu erkenn

Fractal ist einer der wichtigsten Indikatoren in einer Reihe von Strategien. Volume Fractals hat die Funktionalität der Standardversion des Indikators erweitert. Das Produkt bietet die Möglichkeit, Fraktale zu sortieren und Fraktale anzuzeigen, die sowohl Preis- als auch Volumenextrempunkte darstellen.
Anwendung Stop Losses Umkehrsignale Platzierung von Pending Orders für einen Fraktal-Ausbruch
Optionen Balken der Historie - Anzahl der Chart-Balken, für die der Indikator angezeigt wird Linksse
FREE

Der Indikator zeigt minimierte Charts jedes Symbols aus jedem Zeitrahmen an. Die maximale Anzahl der angezeigten Diagramme beträgt 28. Die Diagramme können sich sowohl im Haupt- als auch im unteren Fenster befinden. Zwei Anzeigemodi: Kerzen und Balken. Die Menge der angezeigten Daten (Balken und Kerzen) und die Diagrammgrößen sind einstellbar. Parameter: Corner - Startecke anzeigen (aus der Liste ausgewählt) CandleMode - Anzeigemodus: true - Kerzen, false - Balken ShowLastBid - Aktivieren/Deakti
FREE
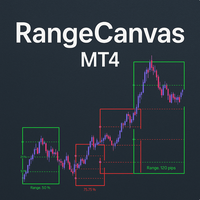
Tägliche Range-Boxen : Der Indikator zeichnet rechteckige Kästchen um die Höchst- und Tiefstkurse jedes Tages und schafft so eine klare visuelle Begrenzung für die tägliche Handelsspanne. Farbkodierte Logik : Grüne Boxen , wenn der aktuelle Kurs (oder Schlusskurs) über dem Tageseröffnungswert liegt Rote Kästchen , wenn der aktuelle Kurs unter dem Tageseröffnungswert liegt Prozentuale Level-Linien : Innerhalb jedes Kästchens werden drei horizontale Linien bei: 25% der täglichen Spanne 50% der Ta
FREE

FOTSI ist ein Indikator, der die relative Stärke von Währungen in wichtigen Devisenpaaren analysiert. Er zielt darauf ab, Korrekturen in Währungspaaren nach starken Trends zu antizipieren, indem er potenzielle Einstiegssignale durch überkaufte und überverkaufte Zielbereiche identifiziert. Theoretische Logik der Konstruktion: Berechnung des individuellen Währungsmomentums: FOTSI beginnt mit der Berechnung des Momentums für jedes Währungspaar, das eine bestimmte Währung enthält, und aggregiert da

Ein Indikator, der sowohl für Anfänger als auch für Profis geeignet ist. RECOMMEHDATION Handel mit diesem Indikator für 2-3 Wochen und Sie werden erhebliche Fortschritte in Ihrem Handel fühlen. Dieser Indikator wurde auf der Grundlage von HMA, Laguerre, CCI entwickelt. Der Indikator ist klar und erfordert keine Einstellung. Er wird nicht neu gezeichnet und funktioniert mit dem Eröffnungsbalken. Er funktioniert auf den Zeitrahmen M1-D1. Ich verwende Zeitrahmen M5, um den Markt zu betreten .
FREE

Moving Average Trend Alert ist ein dreifacher MA-Indikator, der Händlern hilft, potenzielle Markttrends auf der Grundlage der Ausrichtung und Überkreuzung von 3 MAs zu erkennen.
Merkmale von Moving Average Trend Alert: Anpassbare kurzfristige, mittelfristige und langfristige MAs. Option zum Filtern von Signalen basierend auf einem Mindestabstand zwischen gleitenden Durchschnitten, um eine vorzeitige Ausrichtung der MAs zu vermeiden. Optionale Filterung von Signalen mit dem RSI-Indikator für übe
FREE

Der RoundNumbers-Indikator ist ein einfaches und leistungsstarkes psychologisches Kursniveau. Trader verwenden diese Niveaus normalerweise als Unterstützung und Widerstand (SnR). Indikator Eingabe: Levels - Anzahl der auf dem Chart gezeichneten Levels. Standardmäßig 30 Levels. BoxSize - Boxgröße, die auf jedem Level gezeichnet wird, um Puffer um die Levels anzuzeigen. Standardwert 1pips (10point) über und unter jedem Level. ZoneSize - Abstand zwischen den einzelnen Levels, Standardwert 10pips (1
FREE

Der Keltner-Kanal ist ein auf der Volatilität basierender technischer Indikator, der aus drei separaten Linien besteht. Die mittlere Linie ist ein exponentieller gleitender Durchschnitt (EMA) des Kurses. Zusätzliche Linien befinden sich oberhalb und unterhalb des EMA. Das obere Band liegt in der Regel um das Zweifache der Average True Range (ATR) über dem EMA, und das untere Band liegt in der Regel um das Zweifache der ATR unter dem EMA. Die Bänder dehnen sich aus und ziehen sich zusammen, wenn
FREE
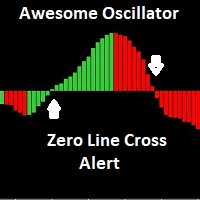
Der Awesome Oscillator (AO) ist ein Indikator, der zur Messung der Marktdynamik verwendet wird. Der AO berechnet die Differenz zwischen einem einfachen gleitenden 34-Perioden- und 5-Perioden-Durchschnitt. Die verwendeten einfachen gleitenden Durchschnitte werden nicht anhand des Schlusskurses berechnet, sondern anhand der Mittelpunkte der einzelnen Balken. Dieser Indikator verfügt über E-Mail- und Pushup-Mobilfunktionen Alert, für Anregungen, bitte zögern Sie nicht, danke
FREE

[NEUE VÖLLIGKEIT] Pferd Alles im Signal - WinWiFi Robot Series ต้อนรับปีใหม่ 2026 ด้วยความมั่งคั่งและพลังที่คึกคักเหมือนม้าศึก! สัมผัสประสบการณ์การเทรดเหนือระดับกับอินดิเคเตอร์ตัวล่าสุดจาก WinWiFi Robot Series ในชื่อ "Horse All in Signal" เครื่องมือที่จะเปลี่ยนกราฟของคุณให้กลายเป็นสนามทำกำไร ด้วยระบบ AI อัจฉริยะที่สแกน Price Action ในทุกช่วงเวลา คุณสมบัติเด่น (Hauptmerkmale): AI Price Action Engine: วิเคราะห์พฤติกรรมราคาแบบ Echtzeit แม่นยำทั้งในช่วงตลาดมีเทรนด์ (Trend) และช่วงพักตัว (Si
FREE

GAP-DETEKTOR
FVG steht im Handel für "Fair Value Gap" und ist ein Konzept, das in der technischen Analyse verwendet wird, um Bereiche auf einem Preisdiagramm zu identifizieren, in denen eine Diskrepanz oder Lücke zwischen Angebot und Nachfrage besteht. Diese Lücken können durch rasche Kursbewegungen entstehen, in der Regel als Folge wichtiger Nachrichten oder wirtschaftlicher Ereignisse, und werden in der Regel später gefüllt, wenn sich der Markt stabilisiert. Der GAP DETECTOR-Indikator wurde
FREE
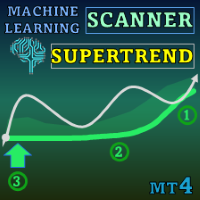
Special offer : ALL TOOLS , just $35 each! New tools will be $30 for the first week or the first 3 purchases ! Trading Tools Channel on MQL5 : Join my MQL5 channel to update the latest news from me Entfesseln Sie die Kraft des fortschrittlichen maschinellen Lernens mit dem Machine Learning Adaptive SuperTrend , einem hochmodernen Indikator, der entwickelt wurde, um sich nahtlos an sich ändernde Marktbedingungen anzupassen. Durch die Integration der k-Means-Clusteranalyse mit der Su

Das RSI / TDI-Warnungs-Dashboard ermöglicht es Ihnen, RSIs (von Ihnen wählbar) für jedes wichtige Paar, das Sie handeln, sofort zu überwachen.
Sie können es auf zwei Arten verwenden:
1. Wählen Sie mehrere Zeitrahmen aus und der Strich zeigt Ihnen, wenn es mehrere Zeitrahmen gibt, die über die normalen Handelsbedingungen hinausgehen. Ein großartiger Indikator dafür, dass der Preis in letzter Zeit stark nach oben gedrückt hat, da er über mehrere Zeiträume hinweg ein überkauftes oder überverkau

Als Forex-Händler verstehen Sie den Wert der Fibonacci- Handelsstrategie in der technischen Analyse. Das manuelle Zeichnen und Anpassen der Fibonacci-Werte kann jedoch zeitaufwändig sein. Hier kommt der Fibonacci Of Yesterday Ultimate- Indikator ins Spiel. Er wurde speziell für Händler entwickelt, die die Fibonacci-Strategie basierend auf der Preisentwicklung des Vortages anwenden, wodurch Sie Zeit und Mühe sparen. Dieser innovative Indikator identifiziert automatisch Einstiegs-, Stop-Lo

Multicurrency und Multitimeframe Modifikation des Indikators Bollinger Bands. Auf dem Dashboard können Sie Ausbrüche und Berührungen der Bollinger Bänder sehen. In den Parametern können Sie alle gewünschten Währungen und Zeitrahmen angeben. Der Indikator kann auch Benachrichtigungen senden, wenn der Preis die Bollinger Bänder berührt, wenn sich die aktuelle Volatilität ändert (steigt oder fällt) und wenn der Preis alle Bänder berührt. Wenn Sie auf eine Zelle mit einer Periode klicken, werden di
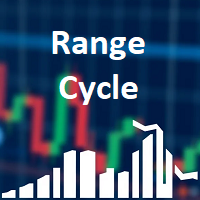
Range Cycle Indikator. Gibt Signale über den Preisbereich Zyklus geglättet durch gleitenden Durchschnitt. Es ist besser, ihn auf H1+ Zeitrahmen zu verwenden und Seitwärtsmärkte zu vermeiden. Denn wenn der Markt flach ist, wird dieser Indikator zu viele Null-Gewinn- oder sogar Verlustsignale geben. Parameter: PopUpAlert - für die Benachrichtigung bei Trendänderungen; EMailAlert - für E-Mail-Warnungen; period - dies ist ein Glättungskriterium, verwenden Sie höhere Werte für niedrigere Zeitrahmen;
FREE

Bitcoin Predictor ist ein pfeilbasierter Indikator, der entwickelt wurde, um Preisumkehrungen vorherzusagen. Dieses Tool kann mit BTC und anderen Kryptos verwendet werden. Es kann auch mit Währungen verwendet werden. Aber Sie müssen zuerst prüfen, welche Paare am besten funktionieren. Einige Paare und Zeitrahmen können wirklich großartig funktionieren. Es steht Ihnen frei, es selbst zu testen und zu sehen. Der Indikator ist sehr einfach zu bedienen. Alles, was Sie brauchen, ist, den Pfeilen zu f

Dieser automatisierte DOJI BAR FINDER INDICATOR kann zur Verwaltung von Trades und zur Identifizierung potenzieller Unterstützungs- und Widerstandsbereiche sowohl für Käufe als auch für Verkäufe verwendet werden. Er wurde entwickelt, um Zonen für Kauf-/Verkaufstransaktionen zu identifizieren und kann effektiv in Verbindung mit anderen Indikatoren, wie z.B. Orderblock-Indikatoren, verwendet werden. Derzeit für MT4 entwickelt, wird er später an MT5 angepasst werden. Wir bieten auch die Möglichkeit
FREE
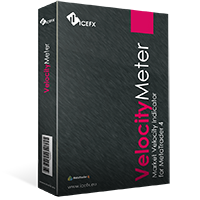
IceFX VelocityMeter ist ein einzigartiger Indikator auf der MetaTrader 4 Plattform, der die Geschwindigkeit des Devisenmarktes misst. Es ist kein normaler Volumen- oder sonstiger Messindikator, denn IceFX VelocityMeter ist in der Lage, Marktgeschwindigkeitsbewegungen zu verstehen, die in Ticks versteckt sind und diese wertvollen Informationen können nicht auf gewöhnliche Weise aus den Kerzen gelesen werden. Die Software überwacht die empfangenen Ticks (Frequenz, Größe der Veränderung) innerhalb
FREE
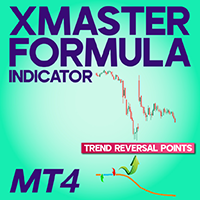
XMaster XHMaster Formula MT4-Indikator - No-Repaint-Strategie Der XMaster / XHMaster Formula-Indikator für MetaTrader 4 (MT4) ist eines der beliebtesten Non-Repaint-Tools, die im Forex-Handel verwendet werden. Laut Quellen wie XS.com und TradingFinder wurde der Indikator entwickelt, um die Marktrichtung, die Stärke des Momentums und potenzielle Umkehrbereiche mit hoher Genauigkeit zu erkennen. Diese MT4-Version kombiniert mehrere technische Elemente - wie EMA-basierte Trendanalyse, MACD-Momentum
FREE

Dieser Indikator ist ein multifunktionales Werkzeug der technischen Analyse, das auf der Kombination eines adaptiven exponentiellen gleitenden Durchschnitts und Volatilitätsfiltern basiert, die über den Average True Range (ATR) berechnet werden. Er wurde entwickelt, um die aktuelle Preisrichtung präzise zu identifizieren, Schlüsselbereiche möglicher Trendwenden hervorzuheben und potenzielle Wendebereiche visuell darzustellen. Der Algorithmus basiert auf der dynamischen Konstruktion eines Trendba
TCM Breakeven Calculator Pro ist das ultimative Dienstprogramm für professionelle Trader. Es berechnet automatisch den gewichteten durchschnittlichen Einstiegskurs für alle Ihre offenen Positionen für das aktuelle Symbol. Es zeichnet eine klare Linie auf dem Chart und zeigt ein intelligentes Dashboard an, das genau anzeigt, wohin der Kurs gehen muss, damit Sie mit $0,00 Verlust aussteigen . Hauptmerkmale: Null Verzögerung: Entwickelt mit Hochgeschwindigkeits-Ereignisverarbeitung. Sofortige Aktu
FREE

Dieser Indikator ermöglicht es Ihnen, Ihr Engagement zu verwalten und zu sehen, wie sich das Lot verändert. Sie können den optimalen Lot-Wert für Ihr Depot wählen, ohne echte Positionen zu eröffnen. Und Sie können auch neue Handelsinstrumente bewerten. Wenn Sie manuell handeln, wird Ihnen das Risikomanagement helfen, unerwartete Verluste zu vermeiden. Der Indikator bietet die Möglichkeit, bei Erreichen eines bestimmten Niveaus ein akustisches Signal zu erhalten sowie Push-Benachrichtigungen und
FREE
Der Supertrend-Indikator ist ein beliebtes Instrument der technischen Analyse, das Händlern bei der Erkennung von Markttrends helfen soll. Der Indikator kombiniert die Average True Range (ATR) mit einem Multiplikator, um seinen Wert zu berechnen. Dieser Wert wird dann zum Schlusskurs des Vermögenswerts addiert oder davon subtrahiert, um die Supertrend-Linie darzustellen. Der Supertrend-Indikator kann helfen, Trends zu erkennen, Risiken zu steuern und Markttendenzen zu bestätigen. Der Indikator
FREE

Leistungsstarkes, nicht nachzeichnendes Tool für Intraday- oder Swing-Trading, Teil des Power Lines Trading Systems, das im realen Handel täglich mit bewährten, soliden Handelssignalen eingesetzt wird. Der Power Lines-Indikator ist ziemlich unkompliziert und einfach einzurichten und kann perfekt auf jedem Zeitrahmen und mit jedem Währungspaar oder anderen Finanzinstrument verwendet werden. Für den Intraday-Handel wird die Verwendung der Zeitrahmen M5, M15 oder M30 und für den Swing-Handel H1, H4
FREE

Der Indikator synchronisiert acht Arten von Markierungen auf mehreren Charts eines Handelsinstruments.
Dieser Indikator kann bequem in Verbindung mit "Multichart Dashboard" oder einem ähnlichen Assistenten verwendet werden, mit dem Sie gleichzeitig mit mehreren Charts arbeiten können.
"Multichart Dashboard" finden Sie unter dem Link auf meinem Youtube-Kanal.
Die Einstellungen:
Aktivieren die vertikale Liniensynchronisation
Aktivieren die horizontale Liniensynchronisation
Aktivieren die Trendlin
FREE
Der MetaTrader Market ist die beste Plattform für den Verkauf von Handelsroboter und technischen Indikatoren.
Sie brauchen nur ein gefragtes Programm für die MetaTrader Plattform schreiben und schön gestalten sowie eine Beschreibung hinzufügen. Wir helfen Ihnen, das Produkt im Market Service zu veröffentlichen, wo Millionen von MetaTrader Benutzern es kaufen können. Konzentrieren Sie sich auf dem Wesentlichen - schreiben Sie Programme für Autotrading.
Sie verpassen Handelsmöglichkeiten:
- Freie Handelsapplikationen
- Über 8.000 Signale zum Kopieren
- Wirtschaftsnachrichten für die Lage an den Finanzmärkte
Registrierung
Einloggen
Wenn Sie kein Benutzerkonto haben, registrieren Sie sich
Erlauben Sie die Verwendung von Cookies, um sich auf der Website MQL5.com anzumelden.
Bitte aktivieren Sie die notwendige Einstellung in Ihrem Browser, da Sie sich sonst nicht einloggen können.