Technische Indikatoren für den MetaTrader 4 - 39
Einführung
Der Grid Option Strike-Indikator wurde für MetaTrader 4 entwickelt und basiert auf den Strike-Levels von Futures-Optionen . Er liefert ein klares Muster der Kursbewegungen von Währungspaaren wie EUR/USD, GBP/USD und AUD/USD. Dieses Tool hilft Händlern, dynamische Unterstützungs- und Widerstandsbereiche zu identifizieren, die auf den 25- und 50-Punkte-Spannen basieren, die häufig von institutionellen Händlern und auf den Optionsmärkten verwendet werden.
Hinterlassen Sie einen Komment
FREE
Dieser Indikator erstellt einen Kanal relativ zu anderen Chart-Indikatoren: Indikator + ATR und Indikator - ATR . Nützlich zu wissen, ob der Preis zu weit von Ihrer Basislinie gestiegen ist. Die ATR-Werte können mit einem Multiplikator angepasst werden. Diese Version ist komplexer als ihr MT5-Pendant, um einige der MT4-Einschränkungen zu umgehen: Sie müssen den Namen Ihrer Baseline, Parameter (in einer durch Kommas getrennten Zeichenfolge) und Puffer eingeben . Stellen Sie sicher
FREE

CFN - Multi MA & EMA Indikator für MT4 - mit Alarmen Verbessern Sie Ihre technische Analyse mit dem Multi MA & EMA Indikator - ein leistungsstarkes Tool für Händler, die sich auf gleitende Durchschnitte und exponentielle gleitende Durchschnitte verlassen, um Trends, Ein- und Ausstiege zu erkennen. Hauptmerkmale: Unterstützt bis zu 5 gleitende Durchschnitte (MA) & 5 exponentielle gleitende Durchschnitte (EMA):
Plotten Sie mehrere MAs und EMAs gleichzeitig in Ihrem Chart, vollständig anpassb
FREE

An indicator showing volumes with the addition of four moving averages of these volumes. What is this indicator for? When analyzing the Forex markets, metals, indices on the H1, H4 charts, at the beginning of the day and at the end of the trading day according to server time, the volumes are less than in the middle of the day. This indicator was created for this. It will help you compare trading volumes within the day. The indicator is distributed as is. Tags: Volume, Custom Volume, MA, Custom M
FREE
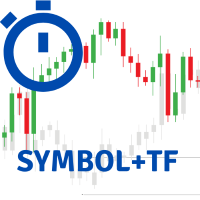
Der Indikator zeigt den aktuellen Zeitrahmen und den Symbolnamen an. Es ist auch möglich, die Anzeige der Zeit bis zum Ende des aktuellen Balkens einzuschalten. In den Einstellungen können Sie Folgendes festlegen - die Position des Indikators im Verhältnis zum Terminalfenster, oben links, oben rechts, unten links und unten rechts - die Anordnung der Textanzeige in einer Reihe, so dass sich die Beschriftungen nicht gegenseitig überlappen - die Farbe - Schriftart - die Schriftgröße.
FREE
Wir möchten Ihre Aufmerksamkeit auf den Indikator Price Action Indicators lenken. Er benötigt keine Einstellungen. Außerdem ist er nicht an mehr als einen Indikator gebunden, was ihn nicht anfällig für verschiedene Konten oder Makler macht.
Fügen Sie eine Einstellung PERIOD hinzu.
Mit freundlichen Grüßen, Mikhail
Price Action Indicators wird für Ihre Aufmerksamkeit angeboten. Er benötigt keine Einstellungen. Und er ist auch nicht an einen Indikator gebunden, was ihn nicht anfällig für versch
FREE

In der Physik ist der "Ruck" die dritte Zeitableitung der Position, wobei die Beschleunigung die zweite Ableitung und die Geschwindigkeit die erste Ableitung ist. In der technischen Analyse ist die erste Ableitung des Preises der Preisimpuls, wobei die zweite Ableitung, die Beschleunigung, selten verwendet wird und die dritte Ableitung praktisch unbekannt ist. Der Betragsfrequenzgang eines digitalen Differenzierers ist eine Gerade mit positiver Steigung, die durch die Frequenz Null verläuft. Dah
FREE

Der Indikator zeichnet automatisch bullish und bearish engulfing ohne jegliche Regeln. Bearish und Bullish engulf ist bekannt für Angebot und Nachfrage Bereich Markierung. Dieser Indikator kann in jeder Strategie verwendet werden, die eine Angebots-Nachfrage-Zone benötigt. Show Last Engulf : Aktivieren Sie diese Option, um unfrische Engulfing-Kerzen zur Berechnung anzuzeigen : Bei der Einstellung 0 werden alle historischen Balken geladen, was mehr Speicherplatz beanspruchen kann Bearish Engulfin
FREE
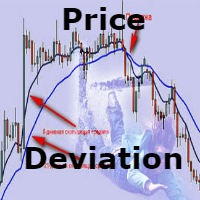
Ein sehr einfacher und intuitiver Indikator, der die Abweichung vom gleitenden Durchschnitt in Prozent anzeigt. Die Voreinstellung ist ein gleitender 50-Tage-Durchschnitt. Werfen Sie einfach einen Blick auf das Diagramm und der Indikator wird in einem separaten Fenster unter dem Diagramm angezeigt.
Dies kann sehr praktisch sein, wenn Ihre Strategie eine bestimmte prozentuale Abweichung vom gleitenden Durchschnitt vorschreibt. Die manuelle Berechnung ist nicht sehr bequem. Die Methode der Mittel
FREE

Der Zweck dieser neuen Version des MT4-Standardindikators, der in Ihrer Plattform enthalten ist, besteht darin, in einem Unterfenster mehrere Zeitrahmen desselben Indikators anzuzeigen. Siehe das Beispiel im Bild unten. Aber die Anzeige ist nicht wie bei einem einfachen MTF-Indikator. Dies ist die tatsächliche Anzeige des Indikators in seinem Zeitrahmen. Hier sehen Sie die verfügbaren Optionen des FFx-Indikators: Wählen Sie die anzuzeigenden Zeitrahmen (M1 bis Monthly) Definieren Sie die Breite
FREE

Verwenden Sie beim Handel dynamische Bandbreiten (wie Bollinger Bänder oder Hüllkurven)? Normalerweise wird für solche Berechnungen ein fester Zeitraum verwendet. Aber ist ein solcher Ansatz für die Natur des Marktes überhaupt relevant? In der Tat besteht das Preisdiagramm aus einer Reihe von aufeinander folgenden Prozessen - Trends und Flats. In diesem Fall können wir nur über die interne Entwicklungslogik innerhalb eines einzigen Prozesses sprechen. Daher lässt sich das Wesen des Marktes besse
FREE
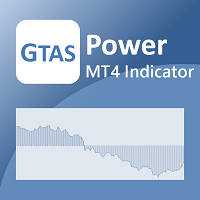
GTAS Power ist ein Momentum-Indikator, der durch die Kombination von gleitenden Durchschnitten hilft, tiefgreifende Trends zu ermitteln. Dieser Indikator wurde von Bernard Prats Desclaux, Eigenhändler und ehemaliger Hedgefondsmanager, Gründer von E-Winvest, entwickelt.
Beschreibung Der Indikator wird als grünes oder rotes Histogramm um eine 0-Gleichgewichtslinie dargestellt.
Wie man ihn benutzt Wenn GTAS Power grün ist, ist der tiefe Trend bullisch. Wenn er rot ist, ist der tiefe Trend rückläu
FREE

Es handelt sich um einen sehr einfachen und nützlichen Mikroindikator. Er zeigt den aktuellen Briefkurs und den maximalen relativen Briefkurs bis zum aktuellen Zeitpunkt auf dem Chart in den ersten N Kerzen an. Er erleichtert eine schnelle Entscheidungsfindung, indem er eine visuelle Referenz bietet. Wenn wir den Cursor darüber positionieren, zeigt er uns ebenfalls den maximalen Spread seit der Anwendung des Indikators bis zum aktuellen Zeitpunkt an. Er ist perfekt für das Scalping geeignet. Sta
FREE
Dieser Indikator zeichnet Linien auf der Grundlage des Standard-Fraktal-Indikators. Sobald ein Fraktal nach oben oder unten durchbrochen wird, generiert der Indikator eine Warnung, sendet eine E-Mail-Benachrichtigung und eine Push-Nachricht auf Ihr Mobiltelefon.
Benutzereingaben Historie - die Anzahl der Balken in der Historie für die Berechnung. Farbe Fraktal oben - die Farbe der oberen Fraktallinie. Farbe unteres Fraktal - die Farbe der unteren fraktalen Linie. Breite - die Breite der Linie.
FREE
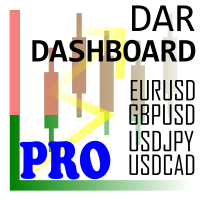
Daily Average - Retracement Dashboard is an indicator that allows you to monitor more than one currency pairs at one time. This indicator is mainly for strategy that trade price retracement based on Resistance3/4 or Support 3/4. After apply this indicator to the chart window, it will hide the chart and display the currency pairs in a table form. There are several data shown on the table that will help trader know when to analyze the currency and do trade using retracement. The indicator will s
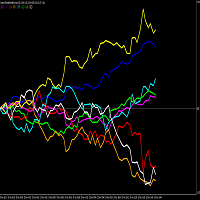
BITTE BEACHTEN SIE, DASS WIE VIELE ANDERE INDIKATOREN AUF DIESEM MARKT, WIRD DIESER INDIKATOR NICHT ALS DEMO-DOWNLOAD FÜR STRATEGIETESTER FUNKTIONIEREN. Daher ist die 1-Monats-Option zu den niedrigsten erlaubten Kosten von $10 für Sie zum Testen verfügbar. Eine der besseren Möglichkeiten zum Handeln ist die Analyse einzelner Währungen und nicht von Währungspaaren. Dies ist mit Standard-Chart-Indikatoren auf MT4 nicht möglich. Mit diesem Währungsstärkemesser kann man mit der stärksten und der sc

Tick Speed Free zeigt die Tick-Geschwindigkeit auf dem Chart an, damit Sie die Ebbe und Flut der Marktaktivität beobachten können. Die Beobachtung des Anstiegs und des Rückgangs der Tick-Geschwindigkeit kann es Ihnen ermöglichen, den Zeitpunkt des Einstiegs besser zu bestimmen, um Slippage und Re-Quotes zu reduzieren.
Die Optionen umfassen: - Farben für niedrige, mittlere und hohe Tick-Geschwindigkeiten - Platzierung und Styling - Präfix und Suffix zum Anpassen der Geschwindigkeitsbezeichnung
FREE

Der Indikator RS 24 Titanium ist ein Signalindikator für mehrere Währungen und Zeitrahmen, der mit dem Algorithmus des Autors erstellt wurde. Er wurde entwickelt, um schnell den Trend (die Stimmung der Marktteilnehmer) für ein bestimmtes Finanzinstrument auf allen Zeitrahmen gleichzeitig zu bewerten. RS 24 Titanium scannt die Messwerte aller Zeitrahmen für ein Finanzinstrument und zeigt die Daten in Form einer visuellen Tabelle an. Der Indikator kann mit jedem Broker (mit 4/5-stelligen Kursen) v
FREE

Dieser klassische "old school" MAGIC MACD Indikator gibt Ihnen das Kreuz der Parameter, die Sie einstellen. Die Standardeinstellung ist (12,26,9). Die Pfeile zeigen Ihnen eine mögliche Trendänderung an. Seien Sie vorsichtig und verwenden Sie diesen Indikator nicht als einzige Signalquelle.
Kostenlose Version Bitte schauen Sie sich auch unsere anderen REX-Indikatoren an. Wir haben auch andere kostenlose Indikatoren.
"OLD BUT GOLD"
FREE

Aktuelle Pips und Geldgewinn Dieser Indikator zeigt die Ergebnisse der aktuell offenen Position in der Grafik an. Das Ergebnis in Pips und in der Rechnungswährung. Dadurch können Sie das Diagramm auf den gesamten Bildschirm vergrößern und haben die Kontrolle über das Ergebnis des Handels, ohne ein Terminalfenster zu öffnen, das einen Teil des Bildschirms einnimmt. Die Anzeigepositionen dieser Daten können nach dem Ermessen des Benutzers angepasst werden, ebenso die Farben.
FREE
Verbesserte Version des einfachen Indikators Trend und Oszillator in den Farben Rot, Gelb und Grün. Die Farben Rot, Gelb und Grün werden verwendet, um Aufwärtstrends, Oszillatoren und Abwärtstrends anzuzeigen. Rot zeigt einen kurzen Trend (abwärts) an. Grün zeigt einen langen Trend (aufwärts) an. Gelb zeigt einen Oszillator an. Ein Wechsel von Gelb zu Rot kann den Markt von einem Oszillator in einen Abwärtstrend verwandeln. Eine durchgehend rote Farbe weist auf einen starken Abwärtstrend hin. Ei
FREE
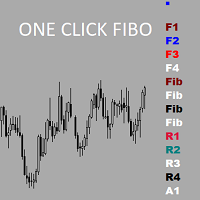
In den Einstellungen können Sie die Fibonacci-Stufen, Farben, Stile und Dicke der Linien und Textbeschriftungen auf den Schaltflächen ändern. Es besteht die Möglichkeit, die Funktionalität zu erweitern, Fibonacci-Zeitzonen, Fibo-Bögen, Winkellinien, Erweiterung der rechteckigen Zonen auf den aktuellen Preis hinzuzufügen.Empfehlungen senden, alles kann innerhalb des kostenlosen Dienstprogramms implementiert werden.
FREE

Der Zweck dieser neuen Version des MT4-Standardindikators, der in Ihrer Plattform enthalten ist, besteht darin, in einem Unterfenster mehrere Zeitrahmen desselben Indikators anzuzeigen. Siehe das Beispiel im Bild unten. Aber die Anzeige ist nicht wie bei einem einfachen MTF-Indikator. Dies ist die tatsächliche Anzeige des Indikators in seinem Zeitrahmen. Hier sehen Sie die verfügbaren Optionen des FFx-Indikators: Wählen Sie die anzuzeigenden Zeitrahmen (M1 bis Monthly) Definieren Sie die Breite
FREE

Der Indikator ermöglicht Ihnen den Handel mit binären Optionen. Der empfohlene Zeitrahmen ist М1 und die Verfallszeit ist 1 Minute. Der Indikator ist für den automatischen und manuellen Handel geeignet. Ein mögliches Signal wird als ein Pfeil über/unter einer Kerze angegeben. Sie sollten warten, bis die Kerze geschlossen ist! Die Pfeile werden nicht neu gezeichnet Handelssitzungen: Londoner und New Yorker Abschnitt Währungspaare: AUD/CAD Arbeits-Zeitrahmen: M1 Verfallszeit: 1 Minute Der Indikato
FREE
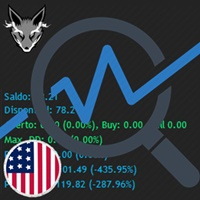
Verfolgen Sie Ihre gesamten Trades! Monitor New Fox ist ein hervorragender Indikator, der Ihre aktuellen Gewinne anzeigt, und zwar monatlich, wöchentlich und täglich, d.h. alle Gewinne, die Sie erzielt haben, wenn Sie den mt4 geöffnet haben. Unser brandneuer Monitor New Fox Indikator ist in der Lage, alle fortgeschrittenen Funktionen des MetaTrader 4 zu nutzen. Dieser Indikator kann mit einfachen Daten die wichtigsten Metatrader-Kontodaten grafisch darstellen (Saldo, Eigenkapital, freie Marge, a
FREE

The TMA Centered Bands indicator for MT4 draws bands on the chart and reports the overall price trend, as well as gives arrows signals to buy and sell when the bar closes outside the channel.
Unlike many TMAs, our version uses the calculation part of the algorithm without redrawing, and also adds the ability to select a symbol. The bands are made up of moving averages, and each of them has an MA period. The name TMA comes from triangular moving averages, as the indicator draws triangular bands
FREE
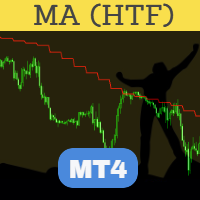
Perfected MA (Moving Average) HTF (Higher Time Frame) ist vielleicht der fortschrittlichste und zuverlässigste HTF-Indikator. Der Indikator ist in Bezug auf die Ausführung hochgradig optimiert und verfügt über die Standardeinstellungen des MA-Indikators, der mit der MT4-Plattform geliefert wird. Platzieren Sie den Indikator auf dem Chart in einem beliebigen Zeitrahmen, wobei Sie in den Indikatoreingaben einen höheren Zeitrahmen auswählen können. Derselbe Indikator kann auf einem Chart mehrfach v
FREE

Bitte kontaktieren Sie mich auf Telegramm https://t.me/smartforex7 Nach dem Kauf von SmartForex Indicator dann verwenden Sie diesen Indikator...................... SMART EXIT PROFIT LINE Indicator ist sehr hilfreich mit SmartForex Indicator ........................................ SMART EXIT PROFIT LINE Indikator mit SmartForex Indikator anhängen, nachdem die rote Linie den Kaufgewinn und die grüne Linie den Verkaufsgewinn anzeigt................
FREE

Basierend auf einer Kombination von Indikatoren, PS Acid Fulx ist ein ausgezeichneter Indikator für zu wissen, wann zu kaufen oder zu verkaufen auf einem Vermögenswert und Temporäre. Der Indikator selbst habe ich als Werkzeug für meine Analyse beim Handel mit Forex verwendet. Es ist ein nützlicher und leicht verständlicher Trendindikator. Wenn Sie es mit Ihren eigenen Analysen kombinieren, werden Sie sicherlich ein gutes Ergebnis in Ihrer Operation erhalten.
FREE
Hochgradig konfigurierbarer Indikator für Akkumulation und Verteilung (AD). Merkmale: Alert-Funktionen. Multi-Timeframe-Fähigkeit (auch untere und obere TF). Farbanpassung. Optionen für lineare Interpolation und Histogramm-Modus. Funktioniert im Strategie-Tester im Multi-Timeframe-Modus (auch am Wochenende ohne Ticks). Einstellbare Levels. Parameter:
Ad Timeframe: Sie können die unteren/höheren Timeframes für Ad einstellen. Balkenverschiebung für unteren Zeitrahmen: Verschieben Sie die Kerze de
FREE
Der Swaps-Indikator ermöglicht es, die Swapsätze der gewünschten Instrumente an einem Ort zu überwachen. Es gibt mehrere Möglichkeiten, die Liste der Instrumente für den Indikator auszuwählen: Instrumente aus Market Watch auswählen Alle Instrumente auswählen Auswahl von Instrumenten aus der manuell angepassten Liste Alle Farbeinstellungen sind im Indikator einstellbar: Sie können die Farbe für Überschriften, für Symbolnamen, für positive und negative Swaps einstellen. Es gibt auch die Möglichkei
FREE

APriceChannel ist eine Modifikation des Standard Price_Channel Indikators. Der EA zeichnet 2 Ebenen - die obere Ebene zeigt das Preishoch für den angegebenen Zeitraum, die untere Ebene zeigt das Preistief für den gleichen Zeitraum. Zusätzlich zur Periode können Sie einen vertikalen Offset in Punkten einstellen, um den Kanal nach oben und unten zu verbreitern. Dies verhindert falsche Ausbrüche von aktuellen Unterstützungs-/Widerstandsniveaus.
Eingaben Periode - Zeitspanne in Takten - die Anzahl
FREE

Session Standard Deviation Date Range Analyzer: Bewerten Sie die Standardabweichung des Preises jedes Balkens (Höchst-, Tiefst-, Schluss-, Eröffnungs-, gewichteter, mittlerer und typischer Preis) innerhalb definierter Handelssitzungen und Datumsbereiche, um detaillierte Einblicke in die Preisvolatilität und das Marktverhalten zu erhalten. **Hinweis:** Wenn die Handelsplattform geschlossen ist, wird der Indikator möglicherweise nicht korrekt geladen. Um sicherzustellen, dass er funktioniert, müs
FREE

Der Range-Indikator bezeichnet die durchschnittliche tägliche Kursbewegung. Der Einfachheit halber wird er visuell auf den Charts angezeigt, allerdings mit dem Zeitrahmen H4 und darunter. Der Indikator wird täglich neu gezeichnet und die Lücken werden in die Berechnung einbezogen. Eine zusätzliche gepunktete Linie bedeutet, dass 80 % der täglichen Bewegung überschritten wurden. Ein wichtiges Instrument im Arsenal eines professionellen Händlers oder eines, der es werden will. PrimeTools ist eine
FREE

Der Indikator Alert TIME LINE warnt, wenn der Kurs eine bestimmte Zeitspanne erreicht hat.
Ziehen Sie den Indikator auf das Diagramm, drücken Sie auf die Schaltfläche ZEITLINIE SETZEN, verschieben Sie die erscheinende Linie auf die gewünschte Zeit, wenn das Diagramm die angegebene Zeit erreicht, wird ein Alarm ausgelöst.
Dieser Indikator wird als Hilfsmittel beim Handel mit Zeitzonen verwendet, wobei das kostenlose TIME LINE Forex System zum Einsatz kommt, siehe die Ergebnisse und Screenshots
FREE

MTF (Multi-Timeframe) Countdown Timer Indikator, entwickelt für MetaTrader 4 (MT4). Der Indikator zeigt die verbleibende Zeit für neue Kerzen über mehrere Zeitrahmen hinweg an, zusammen mit anderen wichtigen Handelsinformationen wie Serverzeit, Ortszeit und der Spanne der benutzerdefinierten Währungspaare. Merkmale: Multi-Timeframe-Countdown : Zeigt die verbleibende Zeit für die nächste Kerze in bis zu sechs konfigurierbaren Zeitrahmen an, z. B. M5, H1 oder D1. Anpassbares Erscheinungsbild : Hin
FREE
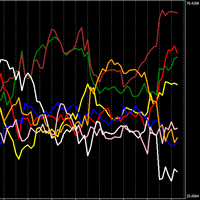
Leistungsstarker Indikator, der die Stärke der einzelnen Währung anzeigt.
Je höher er ist, desto stärker ist die Währung, umgekehrt, je niedriger er ist, desto schwächer ist sie.
Handelsstrategie N1: Eröffnen Sie eine Position bei Linienkreuzungen. Wenn eine Linie nach oben und die andere nach unten kreuzt, eröffnen Sie eine Position bei der Währung, die steigt.
Handelsstrategie N2: Eröffnen Sie eine Position durch den Kauf der stärksten Währung und den Verkauf der schwächsten Währung.
In d
FREE

Der MT4 CCI Dashboard Scanner hilft Ihnen, die Commodity Channel Index (CCI) Werte über verschiedene Zeitrahmen und Instrumente hinweg zu verfolgen und bietet Echtzeitbenachrichtigungen, wenn ein neues Signal erkannt wird. Er ist benutzerfreundlich und benötigt wenig Rechenleistung, was eine reibungslose Leistung auf jedem Computer gewährleistet. Hauptmerkmale: Automatische Instrumenten Gruppierung: Der Scanner sammelt alle Instrumente aus Ihrer Marktbeobachtungsliste und organisiert sie in Kate
FREE

Der Preis-Volumen-Trend-Oszillator (PVTO) ist ein leistungsfähiges technisches Analyseinstrument, das Einblicke in die Beziehung zwischen Preisbewegungen und Handelsvolumen bietet. Dieser Indikator bietet eine einzigartige Perspektive auf Markttrends und hilft Händlern, potenzielle Kauf- und Verkaufschancen zu erkennen. Parameter: EMA kurze Periode: Legt die kurze EMA-Periode für die Berechnung der PVTO fest. Standardwert 3 EMA langer Zeitraum: Legt die lange EMA-Periode für die PVTO-Berechnung
FREE
Dieser Indikator verwendet eine Formel, die auf den Bollinger Bändern basiert, um festzustellen, ob sich der Markt in einer Range befindet oder nicht. Er kann verwendet werden, um Einstiege zu filtern und in einem seitwärts tendierenden Markt nicht zu funktionieren.
Er hat einen Mindestwert von 0,2, ab dem er eingesetzt werden kann, obwohl Sie ihn in den Optionen ändern können, um ihn an Ihren Handelsstil oder den von Ihnen verwendeten Markt anzupassen.
Wenn das Histogramm unten rot ist, befi
FREE

dieser Indikator Konstruktion auf Gann-Winkel und es, s sehr effektiv. Sie können es als (Unterstützung und Widerstand)
es, s sehr erfolgreich und einfach zu bedienen.wenn Kerze Kreuz durch Ebene, die bedeutet, Preis geht ti nächste Ebene
aber mit auf Bedingung. Der Preis kommt von einem früheren Niveau
Es gibt eine Variable von Winkeln für Frames das beste ist 1h Frame und stander Variable.........
FREE

Dieser Indikator ist eine eigenständige Version von MP Pivot Levels (All in one) mit Woodie Pivots. Woodie's Pivot-Punkte bestehen aus mehreren Schlüsselebenen, die aus vergangenen Kurspunkten berechnet werden, um den Handel auf eine einfache Art und Weise zu gestalten. Zu den Schlüsselniveaus gehören der "Pivot" selbst sowie mehrere Unterstützungs- und Widerstandsniveaus (in der Regel jeweils bis zu drei). Händler nutzen diese Niveaus als Richtschnur für künftige Kursbewegungen bei der Planung
FREE
Zusätzlich zu den MA des eingestellten Zeitraums werden die MA der beiden höheren Zeitrahmen mit demselben Zeitraum gleichzeitig auf dem Chart angezeigt (wenn auch auf simulierte Weise). Unabhängig davon, auf welchen Zeitrahmen Sie umschalten, wird der MA für diesen Zeitrahmen sowie die MAs für die beiden höheren Zeitrahmen angezeigt. Zusätzlich wird auch der 200 MA angezeigt!
Um den MA für die höheren Zeitrahmen auf dem aktuellen Chart anzuzeigen, müssen Sie den mit dem Indikator Gleitender Du
FREE

Der technische Indikator für Beschleunigung/Verzögerung (AC) misst die Beschleunigung und Verzögerung der aktuellen treibenden Kraft. Dieser Indikator ändert seine Richtung, bevor sich die treibende Kraft ändert, die ihrerseits ihre Richtung vor dem Preis ändert. Wenn Sie erkennen, dass die Beschleunigung/Verzögerung ein Signal für eine frühere Warnung ist, bietet Ihnen das offensichtliche Vorteile. Ein klassischer AC-Indikator enthält jedoch keine Eingabeparameter. In der Quelldatei können wir
FREE

Trendindikator mit Oszillator. Zeigt den Kursbereich zwischen zwei gleitenden Durchschnitten und einem Oszillator an. Ein Aufwärtstrend wird in rot angezeigt, ein Abwärtstrend in blau. Einstellungen: Langsamer MA-Zeitraum - Langsamer MA-Zeitraum Schnelle MA-Periode - Schnelle MA-Periode Geglättete Daten - Daten glätten Show Area MA - Anzeige der MA Preisbereiche Oszillation anzeigen - MA-Oszillation anzeigen Oszillation zum langsamen MA verschieben - Anzeige eines Oszillators auf einem langsame
FREE

Der Indikator zeigt die aktuelle Situation bei 16 Indikatoren und 10 Strategien an.
Seine Werte werden auf der Grundlage der Bewertung der angegebenen Kriterien für jede einzelne Strategie gebildet.
Als Ergebnis kann man auf dem Diagramm die Stärke aller darin enthaltenen Indikatoren sowie eine zusätzliche Logik beobachten. Vorteile: Die Werte der Signale werden nicht neu gezeichnet. Der Pfeil wird nach der Bestätigung gezeichnet. Alle Arten von Alarmen. Zeigt schwache Zonen auf der Grundlage
FREE

In Abweichung vom herkömmlichen Ansatz können Händler das bärische Engulfing-Candlestick-Muster als Kaufsignal für kurzfristige Mean-Reversion-Trades nutzen. Diese alternative Strategie läuft folgendermaßen ab: Das Bearish-Engulfing-Muster (das in der Regel eine Umkehrung des Aufwärtsmomentums signalisiert) wird in diesem Zusammenhang anders interpretiert. Anstatt es als Vorbote einer weiteren Abwärtsbewegung zu betrachten, sehen wir es als Hinweis auf einen potenziellen kurzfristigen Kursanstie
FREE
Suchen Sie schnell nach übereinstimmenden gleitenden Durchschnitten (MAs) an jedem beliebigen Punkt, den Sie im Diagramm anklicken! Durch die sofortige Anzeige der MAs, die durch einen ausgewählten Punkt verlaufen, ist es hervorragend geeignet, Trendspitzen zu identifizieren und bessere Handelsentscheidungen zu treffen.
Merkmale: Einfache Bedienung: Klicken Sie auf einen beliebigen Punkt, an dem Sie den MA finden möchten. Sofortige Ergebnisse: Zeigt übereinstimmende MAs an, falls gefunden. Ruhef
FREE

Power Trend Free - der Indikator zeigt die Trendstärke im ausgewählten Zeitraum an.
Eingabe-Parameter Der Indikator hat drei Eingabeparameter: Periode - eine positive Zahl, die größer als eins ist und die Anzahl der für die Berechnungen verwendeten Candlesticks angibt. Wenn Sie eine oder Null eingeben, wird kein Fehler auftreten, aber der Indikator wird nicht gezeichnet. Angewandter Preis - der Standardsatz "Anwenden auf:", d.h. die für die Berechnung des Indikators verwendeten Daten: Close - S
FREE

Überblick über die Indikatoren Trendindikator Verwendung gleitender Durchschnitte. Alarme von höchster Qualität, die keiner Einführung bedürfen. Der Indikator bleibt dem ursprünglichen Algorithmus vollständig treu und nutzt weitere nützliche Funktionen.
Einfach zu handeln Führen Sie alle Arten von Benachrichtigungen aus Es ist keine neue Farbe und es ist keine Rückfarbe. Einstellung Indikator WMA50 im Zeitrahmen H1 für jedes Währungspaar und Gold Spot. EMA200 im Zeitrahmen H1 für jedes Währung
FREE

Dieser Indikator zeigt den realistischen und präzisen Trend an. Die gezeichnete Linie als Trendindikator ist der beste und sicherste Ort, um den Stop-Loss zu setzen.
Bei einem Aufwärtstrend sehen Sie die gezeichnete Linie unter den Kerzen und bei einem Abwärtstrend befindet sich die gezeichnete Linie auf der oberen Seite der Kerzen. Kaufen Sie die kostenpflichtige Version dieses Indikators, die Statistical Support Resistance heißt.
FREE

Sendet Kurswarnungen bequem auf Ihr Android/IOS-Gerät. Stellen Sie sicher, dass Push-Benachrichtigungen in den Metatrader-Einstellungen aktiviert sind und der PC/VPS 24/7 online ist. Die Preisniveaus werden automatisch aktualisiert, aber Sie können sie in den globalen Variablen ändern, falls erforderlich. Geeignet für jedes Marktinstrument, aber wenn die Benachrichtigungen zu häufig sind, erhöhen Sie den Punktwert des Indikatorparameters.
FREE
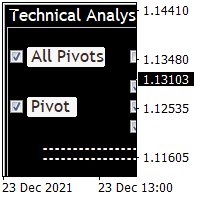
Technische Analyse 4 in 1 gibt Ihnen Pivot-Punkte, Widerstände, Unterstützungen, Fibo, OHCL alle zusammen mit jedem Zeitrahmen und Sie können zurück, wie Sie wollen in Kerzen Pivot-Punkte sind schon seit langem eine Handelsstrategie. Mit dieser Methode können Sie durch ein paar einfache Berechnungen verstehen, wohin sich der Markt an einem Tag entwickelt. Sie können jede beliebige Linie ein- und ausschalten. Bitte sehen Sie sich die Bilder an, um mehr über diesen Indikator zu erfahren.
FREE
Wir stellen Ihnen Austin RSI vor - einen innovativen Indikator, der Ihre Forex-Handelsstrategie verbessert, indem er gleitende Durchschnitte auf den MetaTrader 4-Indikator RSI anwendet.
Der Relative Strength Index (RSI) ist ein beliebter Momentum-Oszillator, der die Geschwindigkeit und Veränderung von Kursbewegungen misst. Er schwankt zwischen 0 und 100 und wird verwendet, um überkaufte und überverkaufte Bedingungen auf dem Markt zu erkennen. Händler verwenden den RSI häufig, um die Stärke von
FREE
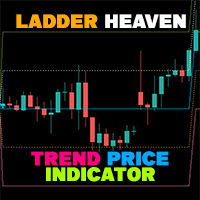
Wenn Sie Schwierigkeiten haben, den Trend sowie Einstiegspunkte, Stop-Loss-Punkte und Take-Profit-Punkte zu bestimmen, wird Ihnen "Ladder Heaven" dabei helfen. Der "Ladder Heaven"-Algorithmus wird auf den Preis in Abhängigkeit von den von Ihnen eingegebenen Parametern angewendet und liefert Ihnen Signale, Trends, Einstiegspunkte, Stop-Loss-Punkte, Take-Profit-Punkte, Unterstützung und Widerstand in der jeweiligen Trendrichtung.
Hilft Ihnen, Trends, Stop Losses und Take Profits in Ihrer Strate
FREE

MP Relative Bandwidth Filter (RBF) wurde entwickelt, um Ihre Handelszonen auf Basis der Volatilität zu identifizieren. Dieser einfach zu bedienende technische Indikator versucht, zwischen der Bandbreite höherer Länge und der ATR niedrigerer Länge zu vergleichen, um die Bereiche niedriger und hoher Volatilität zu identifizieren: Relative Bandbreite = Bandbreite / ATR Die Bandbreite basiert auf dem Bollinger Band, dessen Länge idealerweise höher sein sollte, während die ATR-Länge idealerweise nie
FREE
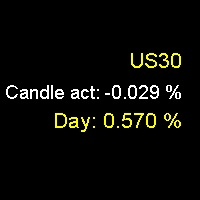
Täglicher Prozentsatz und aktuelle Kerze Möchten Sie wissen, um wie viel ein Vermögenswert an einem Tag oder in der letzten Kerze gestiegen oder gefallen ist? Möchten Sie eine numerische Referenz für die Stärke und Richtung der Kursbewegung? Dann ist der Indikator Täglicher Prozentsatz und aktuelle Kerze genau das richtige Werkzeug für Sie. Der Indikator Tagesprozentsatz und aktuelle Kerze zeigt Ihnen den prozentualen Anstieg oder Rückgang eines Vermögenswerts am aktuellen Tag oder in der letzte
FREE

Trade Zones: Angebots- und Nachfragemöglichkeiten" Indikator für MetaTrader: Erhöhen Sie Ihren Handel mit strategischer Genauigkeit Der "Trade Zones: Supply and Demand Opportunities" ist ein revolutionäres Tool, das die Entscheidungsfindung von Händlern durch die eindeutige Identifizierung von Chancenbereichen auf der Grundlage der fundamentalen Prinzipien von Angebot und Nachfrage unterstützt. Dieser MetaTrader-kompatible Indikator bietet einen intuitiven Einblick in kritische Bereiche des Mark
FREE

Willkommen zum kostenlosen Bull Vs Bear Professional Combiner Binary Options and Forex Indicator Projekt. Dies ist eine kostenlose KI, die leistungsstärkste in ihrer Kategorie für MT4, mit 43 Strategien, 30 Filtern, Unterstützung für 10 externe Indikatoren und 10 externe Bots, entwickelt, um in den Forex- und Binär-Optionen-Märkten zu arbeiten.
↓ Bull vs Bear API Indicator ↓ Telegram4Mql.dll ↓ Bull vs Bear EA Forex
Download:
@bullvsbearcombine
Website:
bullvsbearcombiner
FREE
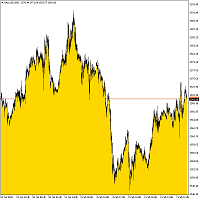
Bottom Background 4 Der Indikator setzt je nach Einstellung den unteren Hintergrund einer bestimmten Farbe auf den aktuellen Preis. Beschreibung der Anzeigeeinstellungen: MODE - drei Anzeigeoptionen für den Indikator: Low - Anzeige des Mindestpreises, Open / Close - Anzeige des Eröffnungs- oder Schlusskurses, je nachdem, welcher Wert niedriger ist, MA - Anzeige des gleitenden Durchschnitts. PeriodMA - Periode des gleitenden Durchschnitts.
FREE
Hochgradig konfigurierbarer MFI-Indikator. Merkmale: Hochgradig anpassbare Alarmfunktionen (bei Levels, Kreuzen, Richtungsänderungen per E-Mail, Push, Sound, Popup) Multi-Timeframe-Fähigkeit Farbanpassung (bei Levels, Kreuzen, Richtungswechseln) Optionen für lineare Interpolation und Histogramm-Modus Funktioniert im Strategie-Tester im Multi-Timeframe-Modus (auch am Wochenende ohne Ticks) Einstellbare Levels Parameter:
MFI Timeframe: Sie können den aktuellen oder einen höheren Timeframe für MF
FREE

Unverzichtbar für Händler: Tools und Indikatoren Waves automatisch berechnen Indikatoren, Kanal Trend Handel Perfekte Trend-Welle automatische Berechnung Kanal Berechnung , MT4 Perfekte Trend-Welle automatische Berechnung Kanalberechnung , MT5 Lokales Trading Kopieren Einfaches und schnelles Kopieren, MT4 Einfaches und schnelles Kopieren, MT5 Lokales Trading-Kopieren für DEMO Einfaches und schnelles Kopieren , MT4 DEMO Einfaches und schnelles Kopieren, MT5 DEMO
Kann der Zyklus für andere Sorte
FREE
Die Verwendung mehrerer Zeitrahmen für die Analyse mit dem Multi Timeframe Average Directional Index kann Händlern mehrere bedeutende Vorteile bieten: Umfassende Marktsicht: Durch die Anwendung des Mtf ADX Standard über verschiedene Zeitrahmen hinweg erhalten Händler eine breitere Perspektive auf die Marktdynamik. Dies ermöglicht es ihnen, Trends, Muster und potenzielle Umkehrpunkte zu erkennen, die in verschiedenen Zeitskalen deutlicher oder konsistenter sein könnten. Verbesserte Mustererkennun
FREE

Der Indikator erkennt Markteffizienzen und -ineffizienzen, indem er die Kursbewegungen untersucht und die Kerzen markiert, bei denen die besten Effizienzen aufgetreten sind. Die "effizientesten" Kerzen werden mit einem vertikalen Balkenhistogramm angezeigt. Höhere Balken stellen diese Kerzen dar. Die Höchst- und Tiefstwerte dieser Kerzen sind Angebots- und Nachfragebereiche, wichtige Niveaus, die in der Zukunft erneut getestet werden. Es kann auf allen Zeitrahmen mit den gleichen Einstellungen
FREE

Schnelle T3 MA Trendindikator, der von gleitenden T3-Durchschnitten abgeleitet ist. Dieser Indikator ist Teil des T3 Cloud MA Indikators und wird hier als eigenständiger Indikator veröffentlicht. Kauf-/Verkaufsmöglichkeiten oberhalb/unterhalb der Linie. Die MA-Linie kann auch als dynamische Unterstützung/Widerstand für aggressivere Einstiege verwendet werden. Verwenden Sie die Standardwerte für die besten Einstellungen. Die Anzahl der Rückblick-Balken ist benutzerdefiniert. Dieser Indikator kann
FREE

Der Hauptvorteil des Bottom-Indikators besteht darin, dass er nicht so lästig ist wie die meisten anderen, er zeigt den Durchschnittspreis auf dem aktuellen Chart an. Der Indikator informiert über die Anzahl der offenen Positionen für das aktuelle Instrument sowie für alle offenen Instrumente einschließlich. bei der Berechnung des Durchschnittspreises berücksichtigt er die Kommission und Swaps und zeigt den Nettopreis an. Der Indikator wird im Chart am unteren Rand des Bildschirms angezeigt, die
FREE
Indikatorfunktion: Vervollständigen Sie den Kreuzcursor, um die Mausposition mehrerer Fenster zu synchronisieren. Funktion aktivieren : Klicken Sie auf das "H"-Etikett, das Etikett wird zu "S", schalten Sie den Kreuzcursor ein, schließen Sie die Positionssynchronisation des zweiten Fensters oder darüber durch Mausklick ab. Sie können den großen Zyklus mit dem kleinen Zyklus synchronisieren (Hinweis: Wenn Sie den großen Zyklus mit dem kleinen Zyklus synchronisieren, müssen Sie darauf achten, ob g
FREE
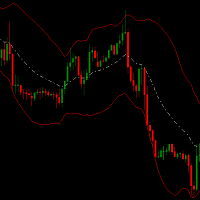
Der Channel Hero Indikator ist ein spezieller Kanal, der Ihnen hilft, überverkaufte/überkaufte Bereiche zu erkennen. Er kann ein ergänzender Indikator für Ihre Strategie sein.
Er kann mit den Bollinger Bändern kombiniert werden. Wenn der Kurs über die Bollinger Bänder ausbricht und das obere Channel Hero Band über dem Bollinger Band liegt und auch
die weiße Linie (mittlere Kanal-Helden-Linie) über dem mittleren BB liegt, dann hat dieser Punkt eine große Chance, nach oben zu gehen. Ein guter S
FREE
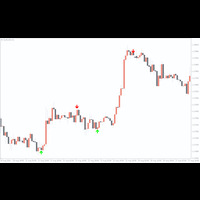
Der Indikator ist ein 15-Minuten-Signalindikator für alle Arten von Händlern. Das bedeutet, dass Sie mit zwei verschiedenen Signalen in einem Indikator viele Gewinne erzielen können.
HINWEIS: Beide Indikatoren sind Kanäle, die das gleiche Ergebnis erzielen. ROTER PFEIL - Verkaufssignal BLAUER PFEIL -- Kaufsignal
Kaufen Sie jetzt und werden Sie Teil unserer Community. Wir bieten Standard-Chart-Setups sowohl für Anfänger als auch für fortgeschrittene Trader. Handeln Sie mit Leichtigkeit!
FREE

Mit diesem Indikator können Sie drei verschiedene gleitende Durchschnitte gleichzeitig auf dem Chart einblenden. Jeder dieser gleitenden Durchschnitte verfügt über zusätzliche Einstellungen wie: -Zeitrahmen
-Shift
-MA-Methode
-Angewandter Preis
Mit diesem Indikator können Sie ganz einfach drei gleitende Durchschnitte einrichten und denjenigen finden, der Ihnen am besten passt. Sie können diesen Indikator auch verwenden, um den Trend zu bestimmen, wenn sich die gleitenden Durchschnitte kreuzen.
FREE
Ist Ihnen bekannt, warum der MetaTrader Market die beste Plattform für den Verkauf von Handelsstrategien und technischer Indikatoren ist? Der Entwickler braucht sich nicht mit Werbung, Programmschutz und Abrechnung mit Kunden zu beschäftigen. Alles ist bereits erledigt.
Sie verpassen Handelsmöglichkeiten:
- Freie Handelsapplikationen
- Über 8.000 Signale zum Kopieren
- Wirtschaftsnachrichten für die Lage an den Finanzmärkte
Registrierung
Einloggen
Wenn Sie kein Benutzerkonto haben, registrieren Sie sich
Erlauben Sie die Verwendung von Cookies, um sich auf der Website MQL5.com anzumelden.
Bitte aktivieren Sie die notwendige Einstellung in Ihrem Browser, da Sie sich sonst nicht einloggen können.