Technische Indikatoren für den MetaTrader 4 - 11
Renko Chart mit gleitendem Durchschnitt. Klassische Renko-Chart-Idee. Es wird auf dem Hauptdiagramm dargestellt und der Gleitende Durchschnitt kann angewendet werden. Die Preise für die Balken werden von einem niedrigeren Zeitrahmen verwendet. Parameter: BarsBack - wie viele Bars des unteren Zeitrahmens verwendet werden sollen. Wenn der Wert Null ist, werden alle verfügbaren Balken verwendet. LTF - unterer Zeitrahmen. BrickSize - Renko-Balken in Punkten. BullishColor - Farbe für die Bullenkerze
FREE

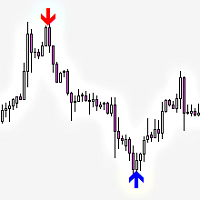
Zeigt Preisumkehrpunkte mit Pfeilen an. Funktioniert in allen Zeitrahmen und allen Währungspaaren. Sowohl für Scalping als auch für den langfristigen Handel geeignet. Wenn der blaue Pfeil erscheint, müssen Sie eine Kauforder eröffnen. Wenn der rote Pfeil erscheint, müssen Sie eine Verkaufsorder eröffnen. Empfohlene Zeiträume M5, M15, H1, H4. Der Indikator zeigt die besten Ergebnisse bei GBPUSD, XAUUSD, EURUSD, USDJPY, AUDUSD, USDCHF, EURGBP, EURJPY, EURCHF und anderen wichtigen Währungspaaren.

Handelsverlauf für MT4 Dieser Indikator wurde speziell für Trader entwickelt, die ihre Trades auf den Charts anzeigen möchten. Zeigt die Historie und die aktuellen Geschäfte auf dem Chart an. Trades werden auf dem Chart mit einer gepunkteten Linie angezeigt, und der Gewinn wird in Echtzeit angezeigt. Gekaufte Trades werden in Bullenfarbe angezeigt, verkaufte Trades in Bärenfarbe.
Tipp: Die vom Indikator angezeigte historische Order ist mit der "Account History" verknüpft. Bitte stellen Sie die
FREE
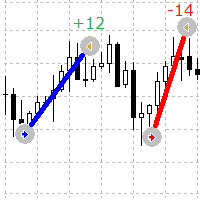
Ein einfacher, aber nützlicher Indikator, um die Ein- und Ausstiegspunkte von Aufträgen auf dem Chart visuell zu sehen
Dieser Indikator zeigt aktuelle offene Orders und abgeschlossene Orders auf dem Symbol
Indikatorparameter
Lines Buy color - gibt die Farbe der Linien für Kaufaufträge an Lines Sell color - legt die Farbe der Linien für Verkaufsaufträge fest Lines Width - legt die Linienbreite fest, funktioniert für Solid-Stiltypen Lines style - legt den Linienstil fest Lines positive profit
FREE

Ranging Market Detector scannt den Markt nach Momentum und Preis, um zu prüfen, ob der Preis in einem bestimmten Bereich liegt und in welche Richtung er ausbrechen wird. Er arbeitet mit allen Vermögenswerten und zeigt Ihnen visuell an, wann sich der Markt entweder in einer Spanne befindet oder einen Trend aufweist. Informiert Sie darüber, wann der Kurs einen Rücksetzer beendet hat, ein günstiger Zeitpunkt, um frühzeitig wieder in den Trend einzusteigen. Dies hilft Ihnen bei der Positionsverwaltu
Indikator basierend auf Tick-Spread-Ungleichgewicht. TF:
Funktioniert auf allen Zeitrahmen (M1 bis D1). Paar:
Kompatibel mit Forex, Indizes, Gold und CFDs (automatische Anpassung für JPY, Gold, CFDs). Einstellungen: TickWindow (200) – Beobachtungsfenster für Ticks SpreadWeight (1.5) – Gewichtung des Spreads NormalizationPeriod (20) – Normalisierungsperiode (z-Score) Overbought / Oversold (±3.0) – Alarmgrenzen AlertCooldown (300s) – Abkühlzeit zwischen Alarmen Fazit:
Proxy Order Flow – Imbalan
Überblick
Der TTM Squeeze-Indikator hilft bei der Identifizierung von Perioden geringer Volatilität (Squeeze), die häufig Kursausbrüchen vorausgehen. Er verwendet Bollinger Bänder (BB) und Keltner-Kanäle (KC), um festzustellen, wann sich der Markt "windet" und bereit ist, sich zu bewegen. Leitfaden zur Konfiguration Volatilitätseinstellungen Der Indikator verwendet Bollinger Bänder, um die Marktvolatilität zu messen. Wenn sich die BBs innerhalb der Keltner-Kanäle befinden, wird ein Squeeze erka
FREE

Der Block Master Pro-Indikator wurde entwickelt, um visuell Bereiche auf dem Chart zu identifizieren, in denen sich wahrscheinlich bedeutende Volumina von großen Marktteilnehmern konzentrieren. Diese Bereiche, die als Orderblöcke bezeichnet werden, stellen Preisbereiche dar, in denen große Marktteilnehmer ihre Orders platzieren und damit möglicherweise eine Preisumkehr und eine Bewegung in die entgegengesetzte Richtung signalisieren. Hauptmerkmale:
Identifizierung von Orderblöcken: Block Master
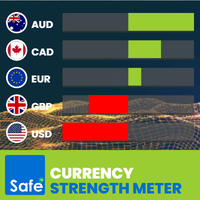
Was ist der Währungsstärkemesser? Der Währungsstärkemesser ist ein fortschrittlicher und dennoch einfach zu bedienender Indikator, der die relative Stärke von 8 Hauptwährungen misst, indem er ihre Echtzeit-Performance über 28 Währungspaare hinweg analysiert.
Er ordnet die Währungen visuell von der stärksten zur schwächsten Währung ein und hilft Ihnen: Handelsmöglichkeiten mit hoher Wahrscheinlichkeit zu erkennen
Starke Währungen gegen schwache Währungen abwägen
mit Vertrauen und Präzision zu han
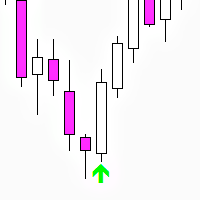
Three Bar Reversal (MT4) - kostenloser Indikator Three Bar Reversal ist ein einfacher und effektiver MetaTrader 4-Indikator, der das klassische Three-Bar-Reversal-Kerzenmuster mit zusätzlicher Filterung auf Basis von ATR und Kerzenkörpergrößen erkennt.
Die Pfeile werden auf der letzten geschlossenen Kerze des Musters angezeigt, und es werden auch Push-Benachrichtigungen gesendet. Ein automatisierter Handelsroboter Three Bar Reversal EA wurde auf der Grundlage dieses Indikators entwickelt. De
FREE

Stochastischer RSI-Indikator - Meistern Sie die Kunst des Timings Verbessern Sie Ihr Trading mit dem "Stochastik-RSI-Indikator". Dieses leistungsstarke Tool kombiniert den Stochastik-Oszillator mit dem Relative-Stärke-Index (RSI) und bietet präzise Einblicke in die Marktdynamik. Er ist Ihr Schlüssel zur Beherrschung der Kunst des Timings beim Handel. Über den Indikator : Der Stochastik-RSI-Indikator kombiniert zwei robuste Indikatoren - die Stochastik und den RSI - und bietet Händlern ein außerg
FREE

BITTE BEACHTEN SIE : Sie können die Einstellungen von Fast EMA, Slow EMA, MACD SMA & Main SMA anpassen. Die Genauigkeit ändert sich entsprechend Ihren Einstellungen.
100% Non-Repaint-Indikator
Vorwarnsignale
Non-Delay-Anzeigen
24/7-Signale
100% No Lag
Keine Neuberechnung Die Pfeile werden nicht neu gezeichnet, auch wenn das Signal fehlschlägt oder Sie mt4 aktualisieren oder neu starten. Der Indikator basiert auf einer einfachen Crossover-Strategie der Hauptlinie und der Signallinie des MACD-Ind
FREE

Wir bieten Ihnen Indikatoren, die auf Ihre Handelsanforderungen zugeschnitten sind: >> MT Magical <<
MT Supply Demand :
Es ist ein Indikator, der geschaffen wurde, um Angebot und Nachfrage zu finden, die wichtige Unterstützungs- und Widerstandsniveaus für den Preis darstellen. Supply Zone ist eine Zone, wo der Preis erreicht hat, ist es oft widerstanden. Mit anderen Worten, wenn der Preis diese Zone erreicht, gibt es mehr Verkaufskraft, um den Preis wieder nach unten zu drücken.
Die Nac
FREE
Der Indikator „Signalhistogramm-Scalper“ ist ein allgemeiner Indikator in Form eines Histogramms und signalisiert ohne Neuzeichnung oder Verzögerung. Der Indikator „Signal Histogram Scalper“ zeigt auf dem Chart die besten Einstiegspunkte entlang des Trends an. Es ist besser, ihn in Verbindung mit anderen Trendindikatoren als Filter zu verwenden. Der Indikator zeigt gute Ergebnisse im M5-Zeitrahmen. Das Signal wird nach dem Schließen der Kerze generiert und erscheint in Form von grünen und roten
Keltner Signals Pro: Klüger handeln, mehr verdienen! Keltner Signals Pro jetzt auch im EA-Format. Jetzt herunterladen. Verbessern Sie Ihre Handelsgenauigkeit und eliminieren Sie falsche Signale mit Keltner Signals Pro - dem fortschrittlichen und dennoch intuitiven Indikator, der für ernsthafte Trader entwickelt wurde, die beständige Gewinne anstreben! Haben Sie genug von irreführenden Handelssignalen? Keltner Signals Pro kombiniert auf meisterhafte Weise die Stärke der Keltner-Kanäle zur Identif
FREE

Торговля пивотами:
1.pp pivot
2. r1 r2 r3, s1 s2 s3 Necessary for traders: tools and indicators Waves automatically calculate indicators, channel trend trading Perfect trend-wave automatic calculation channel calculation , MT4 Perfect trend-wave automatic calculation channel calculation , MT5 Local Trading copying Easy And Fast Copy , MT4 Easy And Fast Copy , MT5 Local Trading copying For DEMO Easy And Fast Copy , MT4 DEMO Easy And Fast Copy , MT5 DEMO
Empfehlen dringend Trendindikatoren,
FREE
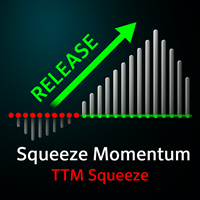
MT5-Version TTM Squeeze Momentum
Der TTM Squeeze Momentum ist ein verbesserter Indikator, der ideal ist, um Perioden der Konsolidierung auf dem Markt und den Beginn der nächsten explosiven Bewegung zu identifizieren. Diese verbesserte Version basiert auf dem Volatilitätsindikator „TTM Squeeze“ von John Carter, bei dem das Histogramm eher auf einer linearen Regression als auf einem einfachen Impulsindikator basiert. JETZT KOSTENLOS AUSPROBIEREN! Der rote Punkt auf der mittleren Linie zeigt an,
Der TPX Supply Demand Indikator warnt Sie, wenn Sie Angebots- und Nachfragebereiche erkennen. Mit dem Risiko/Ertrags-Filter erhalten Sie nur dann Warnungen, wenn diese mit der von Ihnen gewählten Konfiguration übereinstimmen. Mit dem First-Touch-Filter werden nur Warnungen in farbigen Bereichen ausgegeben, die noch nicht berührt wurden, d.h. sie wurden noch nicht abgewickelt und haben das größte Potenzial für eine Reaktion. Sobald der Bereich berührt wird, bleibt nur noch die Grenze übrig. Einst
FREE

So verwenden Sie
In diesem Beitrag finden Sie eine detaillierte Beschreibung über Alle Indikator-Extras und Vorlagen: https://www.mql5.com/en/blogs/post/758259
The Best Heiken Ashi System ist ein einfaches Handelssystem für den Handel basiert nur zwei Indikatoren für Signale zu generieren: Heiken Ashi geglättet und Vqzz Indikator Multi-Timeframe. Das System wurde für Scalping und Daytrading erstellt, kann aber auch für höhere Zeitrahmen konfiguriert werden. Wie bereits erwähnt, ist das Handel
FREE

Frühbucher-Breakout: Nutzen Sie die Macht der London Open Sind Sie es leid, in unruhigen, unvorhersehbaren Märkten zu handeln? Der Early Bird Breakout ist Ihr unverzichtbares Werkzeug, um eines der zuverlässigsten und explosivsten Muster am Forex auszunutzen: den Asia Session Breakout . Dieser intelligente Indikator identifiziert automatisch die entscheidenden Kursniveaus, die während der ruhigen asiatischen Stunden festgelegt werden, und alarmiert Sie in dem Moment, in dem das große Volumen de
FREE
EZ Risk Reward Ratio ist ein einfach zu bedienender MT4-Indikator, der es dem Benutzer ermöglicht, das Risiko-Ertrags-Verhältnis eines offenen Handels automatisch zu ändern, indem er einfach die Take-Profit- oder Stop-Loss-Linien auf die gewünschten Positionen in einem beliebigen Chart zieht. Das Risiko-Ertrags-Verhältnis wird in der von Ihnen gewählten Ecke angezeigt und kann durch Ziehen der TP- und SL-Linien geändert werden.
Platzieren Sie zunächst den EZ Risk Reward Ratio-Indikator auf dem M
FREE
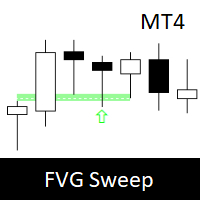
Fair Value Gap Sweep ist ein einzigartiger und leistungsfähiger Indikator, der Fair-Value-Lücken auf Ihrem Diagramm einzeichnet und Sie warnt, wenn eine Lücke vom Kurs übersprungen wurde. Eine Fair-Value-Lücke ist eine Kurslücke, die auftritt, wenn der Markt auf einem anderen Niveau eröffnet als der vorherige Schlusskurs, wodurch ein Ungleichgewicht zwischen Käufern und Verkäufern entsteht. Ein Gap Sweep liegt vor, wenn sich der Kurs zurückbewegt, um die Lücke zu schließen, was auf eine Änderun
FREE

Der Laguerre VIX Trend Extrema (LVTE) Indikator erkennt Höchst- und Tiefststände des Marktes. Wie der Name schon sagt, ist der LVTE ein prozentualer Preisoszillator, der extreme Bereiche im Marktpreis identifiziert. How to use: Buy when the indicator was in the lower "blue" range for more than 2 candles, and then moves up into grey. Sell when the indicator was in the upper "red" range, and then moves down into orange. Please see screenshots for examples! Der Einfachheit halber kann der

Dynamic Reversal Edge: Meistern Sie den Pullback, folgen Sie dem Trend Sind Sie es leid, dem Markt hinterherzulaufen oder sich in falschen Ausbrüchen zu verfangen? Beim erfolgreichen Handel geht es nicht darum, zu raten, sondern genau in dem Moment in den Markt einzusteigen, in dem ein Trend eine Atempause einlegt und sich darauf vorbereitet, wieder zu steigen. Dynamic Reversal Edge ist ein professionelles Trading-Tool, das entwickelt wurde, um hochwahrscheinliche Trend-Pullback-Setups zu ident
FREE

Goldziele sind der beste Trendindikator. Der einzigartige Algorithmus des Indikators analysiert die Bewegung des Vermögenspreises unter Berücksichtigung von Faktoren der technischen und mathematischen Analyse, ermittelt die profitabelsten Einstiegspunkte, gibt ein Signal in Form eines Pfeils und des Preisniveaus (KAUF-Einstieg / VERKAUF-Einstieg) aus eine Bestellung eröffnen. Der Indikator zeigt außerdem sofort das Preisniveau für Stop Loss und fünf Preisniveaus für Take Profit an.
ACHTUNG: De

Was ist der volumengewichtete Durchschnittspreis (VWAP)? Der volumengewichtete Durchschnittspreis (VWAP) ist eine von Händlern verwendete Handelsbenchmark, die den Durchschnittspreis angibt, zu dem ein Instrument im Laufe des Tages gehandelt wurde, und zwar auf der Grundlage von Volumen und Preis. Er ist wichtig, weil er Händlern einen Einblick in den Trend und den Wert des Instruments gibt.
Was ist der Unterschied zwischen VWAP und AVWAP? Während der VWAP den Anfang des Tages, der Woche, des

Der Swing-High-Low-Indikator ist ein unverzichtbares Werkzeug für Händler, die sich auf Preisaktionen verlassen. Er markiert automatisch wichtige Umkehrpunkte (Swing Highs in rot, Swing Lows in grün) und hilft Ihnen, Trends zu visualisieren, Ausbrüche zu erkennen und präzise Trendlinien zu zeichnen. Durch die Hervorhebung dieser kritischen Niveaus zeigt der Indikator Verschiebungen in der Marktstruktur auf - ob sich der Trend verstärkt, umkehrt oder in eine Konsolidierung übergeht. Der Indikator
FREE
Railway Tracks Pattern - Umkehrmuster-Indikator Railway Tracks Pattern ist ein Indikator, der automatisch ein starkes Zwei-Kerzen-Umkehrmuster auf dem Chart erkennt. Er sucht nach zwei Kerzen mit entgegengesetzten Richtungen (bullish und bearish), die ähnlich groß sind und nur minimale Dochte aufweisen - ein klares Zeichen für einen Momentumwechsel. So funktioniert es: Die erste Kerze ist stark und richtungsweisend. Die zweite Kerze bewegt sich in die entgegengesetzte Richtung und ist von
FREE

SIE KÖNNEN JETZT KOSTENLOSE VERSIONEN UNSERER KOSTENPFLICHTIGEN INDIKATOREN HERUNTERLADEN. ES IST UNSERE ART DER RÜCKGABE AN DIE GEMEINSCHAFT! >>> HIER GEHT'S ZUM DOWNLOAD Das System ist ein kostenloses Open-Source-Kiefer-Skript, das ursprünglich auf TradingView von everget veröffentlicht wurde . Es wurde von Forex Robot Makers auf Mt4 konvertiert. Dieses System ist ein beliebter Trendindikator, der auf ATR (Average True Range), Moving Averages und dem Donchian Channel basiert.
System Hintergr
FREE

This Indicator is a affordable trading tool because with the help of Popular Developers & Support of M Q L Platform I have programmed this strategy. I tried to combine logic of Moving Averages, Parabolic Stop And Reverse, Trend Strength, Oversold, Overbought . Furthermore, I have also care about Support Resistance that Trader can easily get in touch with market by selecting one indicator only. What is in for Trader?
Trading Modes: This selection is for activate whole strategy "Power A
FREE
Minotaur Waves ist ein fortschrittlicher Marktanalyse-Indikator, der entwickelt wurde, um potenzielle Wendepunkte zu erkennen und Richtungswechsel des Preises mit hoher Genauigkeit zu bestätigen. Das System kombiniert die Stärke des Minotaur Oscillators mit einer dynamischen Struktur adaptiver Bänder und bietet saubere, zuverlässige visuelle Signale für gut fundierte Einstiegspunkte. Es ist kompatibel mit allen Währungspaaren, wobei die beste Performance bei EURUSD, GBPUSD und USDJPY in den Zeit
Hochgradig konfigurierbarer Stochastik-Indikator.
Merkmale: Hochgradig anpassbare Alarmfunktionen (bei Levels, Kreuzen, Richtungsänderungen per E-Mail, Push, Sound, Popup) Multi-Timeframe-Fähigkeit Farbanpassung (bei Niveaus, Kreuzen, Richtungsänderungen) Optionen für lineare Interpolation und Histogramm-Modus Funktioniert im Strategie-Tester im Multi-Timeframe-Modus (auch am Wochenende ohne Ticks) Einstellbare Levels Parameter:
Stochastic Timeframe: Sie können den unteren/höheren Zeitrahmen fü
FREE

Präzisionsausbruch: Meistern Sie die Wendepunkte des Marktes! Sind Sie es leid, falschen Ausbrüchen hinterherzulaufen? Precision Breakout ist der Pivot-Indikator der nächsten Generation, der entwickelt wurde, um Handelsgelegenheiten mit hoher Wahrscheinlichkeit mit maximaler Klarheit zu erkennen. Dabei handelt es sich nicht um ein weiteres Unterstützungs- und Widerstandsinstrument, sondern um ein dynamisches System, das sich ständig an die Marktbewegungen anpasst und Ihnen genau die Niveaus lie
FREE

Auf der Welle des Trends reiten – Klare Signale für den Einstieg An den Finanzmärkten entstehen die stabilsten Gewinnchancen oft in klaren Trendphasen. Doch selbst erfahrene Trader tun sich schwer, diese Bewegungen zuverlässig zu nutzen. Ride the Trend Signal ist ein Signalindikator, der speziell für Rücksetzer innerhalb eines bestätigten Trends konzipiert wurde. Anstatt den Einstieg am Anfang eines Trends zu suchen, konzentriert sich dieser Indikator auf die zweite oder dritte Welle – nach Best
FREE

AlphaTrend Pro - Erweiterter visueller Trend-Erkennungs-Indikator Produkttitel AlphaTrend Pro - Erweiterte Trend-Erkennung mit kristallklaren visuellen Signalen Kurzbeschreibung AlphaTrend Pro ist ein hochentwickelter Trendfolge-Indikator, der die Volatilitätsanalyse (ATR) mit Momentum-Oszillatoren (RSI/MFI) kombiniert, um dynamische Unterstützungs- und Widerstandsniveaus zu schaffen. Mit großen Richtungspfeilen und einer intelligenten visuellen Positionierung liefert dieser professionelle MT4-I

Erschließen Sie den Präzisionshandel mit Pinpoint Extreme Swing! Sind Sie es leid, entscheidende Marktumkehrungen zu verpassen? Hätten Sie gerne ein zuverlässiges Werkzeug, um hochwahrscheinliche Swing-Trading-Gelegenheiten zu erkennen? Suchen Sie nicht weiter! Der Pinpoint Extreme Swing-Indikator ist Ihr ultimativer Partner in der dynamischen Welt des Tradings, der Ihnen den Vorsprung verschafft, den Sie für Ihren Erfolg brauchen. Dieser leistungsstarke MQL4-Indikator wurde entwickelt, um sign
FREE
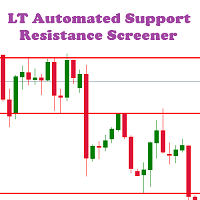
LT Automated Support Resistance Screener ist ein Level-Indikator oder ein Support-Resistance-Indikator, der zur Bestimmung des Niveaus von Unterstützungs- und Widerstandswerten verwendet werden kann. Dieser Indikator ist kostenlos und einfach in der Metatrader 4 Plattform zu verwenden, die mit der MQL4 Programmiersprache aufgebaut ist. Der Support-Resistance-Indikator ist ein wichtiger Indikator, der oft verwendet wird, aber auf der MT4-Plattform nicht verfügbar ist. Dieser Indikator kann für al
FREE
Der Double Top and Bottom-Indikator ist ein Muster-Scan-Indikator, der die Tops und Bottoms anhand von Zickzack-Mustern abtastet. Wenn er feststellt, dass der Preis nach einem langen Trend zweimal vom gleichen Punkt abprallt, erzeugt er Pfeilsignale, wenn der letzte Widerstandspunkt für einen doppelten Boden und der letzte Unterstützungspreis für ein doppeltes Top gebrochen wird. Im Gegensatz zu anderen Top-Bottom-Scannern gibt es nicht nur ein Signal. Es warnt den Benutzer, wenn die letzte Unte
FREE

Dieser Indikator berechnet das Volumenprofil und platziert Etiketten, die den VAH-, VAL- und POC-Niveaus entsprechen, für jede einzelne Kerze.
Funktionsmerkmale des Indikators Der Indikator funktioniert auf den Zeitrahmen von M5 bis MN, aber er verwendet die historischen Daten kleinerer Perioden: M1 - für Zeiträume von M5 bis H1, M5 - für den Zeitraum H4, M30 - für den Zeitraum D1, H4 - für den Zeitraum W1, D1 - für den Zeitraum MN. Die Farbe und die Position der Etiketten VAL, VAH und POC auf
FREE

Im Demomodus wird das Datum verwendet, um zu arbeiten. In Version 13 wurde die Welle hinzugefügt.13.1 Histogramm und Triggerlinie können geändert werden. Welle kann 200-500 eingestellt werden. kann verschiedene Signale auf Welle 200 haben in der Version 14 wird das EMA verwendet, so dass man auch die Signale des Mountly-Charts sehen kann. Up-Down-Indikator ist kein repaint und arbeitet alle Paare und alle Zeitrahmen Charts. Es ist auch geeignet 1 m Charts für alle Paare. und halten lange Weg zu

Price Action Sniper wurde entwickelt, um die Price Action auf dem gewünschten Chart-Zeitrahmen zu handeln. - Trendumkehrungen. - Trendfortsetzung. - Brekaouts. - Gutes Werkzeug für Binäre Optionen
Die Price Action bildet die Grundlage für jede technische Analyse eines Währungspaars, eines Rohstoffs oder eines anderen Anlagecharts. Viele kurzfristige Trader verlassen sich bei ihren Handelsentscheidungen ausschließlich auf die Preisentwicklung und die daraus abgeleiteten Formationen und Trends. D

Sichern Sie sich Ihre Kopie zum aktuellen Preis — dieser kann jederzeit steigen. Das Ziel des "Black Horse"-Indikators besteht darin, Abweichungen zwischen der Preisentwicklung und dem VWAP-Indikator zu identifizieren. Er verwendet Filter, um potenziell falsche Abweichungen herauszufiltern und hochwertige, genaue Warnungen zu generieren.
Bearish-Abweichungen werden durch rote Punkte über der Kerze dargestellt, während Bullish-Abweichungen durch grüne Punkte unter der Kerze repräsentiert werden
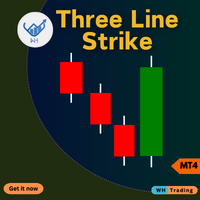
Dreizeiliger Strike-Indikator für MetaTrader 4 (MT4). Dieses fortschrittliche Tool soll Ihnen helfen, potenzielle Umkehrungen auf dem Markt präzise und einfach zu erkennen.
Egal, ob Sie Anfänger oder erfahrener Händler sind, dieser Indikator kann Ihre Handelsentscheidungen verbessern und Ihre Gewinne maximieren. Contact me after purchase for guidance Hauptmerkmale: Präzise Umkehrsignale : Erkennen Sie potenzielle Trendumkehrungen anhand des Dreilinien-Strike-Musters, einer bewährten Can

Ein äußerst praktischer Indikator, der das Geldverdienen an der Börse wirklich einfach macht. Er basiert auf der wissenschaftlich strengen Theorie des Marktes, die der Autor entwickelt hat und deren Anfang hier vorgestellt wird. Der vollständige Algorithmus dieses Indikators Betrieb wird in dem Artikel vorgestellt. Der Indikator berechnet den wahrscheinlichsten Kursverlauf und zeigt ihn auf dem Chart an. Auf der Grundlage der vorhergesagten Preisbewegungsbahn berechnet der Indikator die Richtung

Dieser Indikator ist ein herkömmliches Analyseinstrument für Tick-Volumenänderungen. Er berechnet die Tick-Volumina für Käufe und Verkäufe getrennt sowie deren Delta für jeden Balken und zeigt die Volumina nach Preisclustern (Zellen) innerhalb eines bestimmten Balkens (in der Regel der letzte) an. Der intern verwendete Algorithmus ist derselbe wie beim Indikator VolumeDelta , aber die Ergebnisse werden als kumulative Volumen-Delta-Balken (Candlesticks) angezeigt. Für MetaTrader 5 existiert ein a

Der MACD-Signalkerzen-Indikator ändert seine Farbe entsprechend den MACD-Trends. Farbige Kerzen, basierend auf dem MACD.
WIE ES FUNKTIONIERT
Für einen Kauf: -Wenn der Indikator über Null liegt, ist der Markt optimistisch. -Wenn der Markt zinsbullisch ist, können Sie mit grünen Kerzensignalen eine Position einnehmen. Bei einem Verkauf: -Wenn der Indikator unter Null liegt, ist der Markt rückläufig. -Wenn der Markt bärisch ist, können Sie sich mit den roten Kerzen positionieren.
FREE

DONCHIAN CHANNEL DC Es ist ein von “ Richard Donchian” entwickelter Trendindikator, der aus 3 Schichten besteht, dem oberen Kanal, dem unteren Kanal und dem mittleren Kanal. Es wird auf dem Donchian- Kanal erstellt, indem die höchsten und niedrigsten Preise, die in der vergangenen Periode erreicht wurden, auf dem Preisdiagramm aufgetragen werden. Es wird auch verwendet, um die Volatilität des Marktes zu messen, da es sich um einen expandierenden/kontrahierenden Kanal entsprechend der Zunahme/Abn
FREE

CyberZingFx Trend Reversal Indicator - Ihre Lösung für präzise und zuverlässige Trendumkehrsignale. Mit seiner einzigartigen Handelsstrategie bietet Ihnen der Indikator Kauf- und Verkaufspfeil-Signale, die sich nicht wiederholen, was ihn zu einem zuverlässigen Werkzeug für das Erfassen von Swing-Hochs und Swing-Tiefs macht.
SCROLLEN SIE NACH UNTEN, UM SCREENSHOTS UND EIN VIDEO ZU SEHEN ________________________________________________________________ Der Handel mit CyberZingFx Trend Reversal ist
FREE
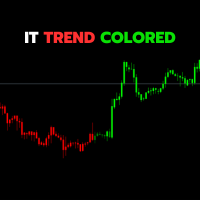
Der IT Trend Colored Indikator ist ein leistungsfähiges Werkzeug, das von IT Trading (InfiniteTrades Software Corp) entwickelt wurde, um Händler bei der visuellen und effektiven Identifizierung von Markttrends zu unterstützen. Diese Version ist ein benutzerdefinierter Indikator für die Handelsplattform MetaTrader 4.
Hauptmerkmale :
- Trend-Identifikation: Der Indikator verwendet eine Kombination aus einfachen gleitenden Durchschnitten (SMA), um die Richtung des Markttrends zu bestimmen.
- In
FREE

BeST_Gann Hi-Lo Strategy ist ein MT4-Indikator, der auf dem Gann Hi-Lo Activator basiert, dem berühmten Trendfolge-Indikator, der es uns ermöglicht, recht früh in einen Handel einzusteigen und gleichzeitig so lange wie möglich in einem Handel zu bleiben, um Gewinne mitzunehmen.
Dieser Indikator ist in der Tat ein einfacher gleitender Durchschnitt der Höchst- und Tiefstwerte der vorherigen Periode. Er folgt den Trends auf dem Markt, spiegelt die Richtung der Preisbewegung wider, erzeugt Einstiegs
FREE
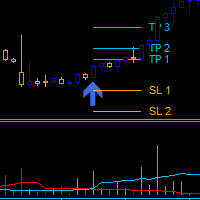
Dark Power ist ein Indikator für den Intraday-Handel. Dieser Indikator basiert auf der Trendfolgestrategie und verwendet ein Histogramm, um die richtige Leistung zu bestimmen. Mit diesem Indikator kann man bei guten Preisen einsteigen, um dem starken Trend des aktuellen Instruments zu folgen. Das Histogramm wird auf der Grundlage der Größe der Balken berechnet und zwei gleitende Durchschnitte, die auf dem Histogramm berechnet werden, bestimmen die Richtung des Signals.
Wichtigste Vorteile
Leich

FARBIGE TRENDBEWEGENDE MITTELWERTE KERZEN Zeichnen Sie Kerzen über/unter dem gleitenden Durchschnitt in einer einzigen Farbe zeichne MA als führende Linie wie einen Supertrend MA als Kanal zeichnen => MA High und Low Zeichnen Sie MACD-Kerzen über und unter 0 und die Signallinie
Ihr Vorteil: ein einfacher Blick über die Trendrichtung ein einfacher Blick auf die höhere Trendrichtung ein ruhigeres Diagramm für das Auge klare Regeln können definiert werden Einstellungen: Zu verarbeitende Bars :
FREE

Platzieren Sie Preiswarnungen auf erweiterten Rechtecken und Trendlinien - Risiko-Lohn-Indikator MT4 Erweitern Sie Rectangles & Trendlines bis zum rechten Rand Markieren Sie Ihre Angebots-Nachfrage-Zonen mit erweiterten Rechtecken und zeichnen Sie Unterstützungs-Widerstandslinien mit erweiterten Trendlinien. Ausführliche Anleitungen finden Sie hier . Kontakte finden Sie auf meinem Profil . Der MT4 Rectangle Extender Indikator vereinfacht und erleichtert es Ihnen, die Märkte zu analysieren und üb

Turbo-Trend-Indikator für die technische Analyse, der die Richtung und Stärke des Trends bestimmt und auch einen Trendwechsel signalisiert. Der Indikator zeigt potenzielle Marktumkehrpunkte an. Der intelligente Algorithmus des Indikators bestimmt den Trend genau. Es wird nur ein Parameter für die Einstellungen verwendet. Der Indikator ist für eine einfache und effektive visuelle Trenderkennung mit einem zusätzlichen Glättungsfilter konzipiert. Der Indikator wird nicht neu gezeichnet und hinkt ni

Der Extrempunkt-Indikator hilft bei der Bestimmung der wahrscheinlichen Kursumkehrpunkte auf dem Diagramm. Der Indikator erleichtert die Suche nach Einstiegspunkten in den Markt mit größerer Genauigkeit. Der Indikator zeigt bestimmte Impulse an, nach denen der Kurs mit hoher Wahrscheinlichkeit seine Bewegung in dieselbe Richtung fortsetzen wird. Der Indikator kann in Verbindung mit anderen Indikatoren verwendet werden, um die Einstiegspunkte für Positionen genauer zu erkennen. Der Indikator kann

Der Währungsindex-Indikator ermöglicht es Händlern, einen beliebigen Index der acht wichtigsten Währungen anzuzeigen. Er verwendet eine spezielle Berechnung, die bestimmte Währungspaare und deren Gewichte berücksichtigt.
Die Standardgewichte basieren auf den Ergebnissen der dreijährlichen Zentralbankumfrage der BIZ. Dank dieses Vorteils kann der Händler die wahre Stärke und Schwäche jeder Währung erkennen.
Hinweis: Wenn der Indikator im Strategy Tester (Demoversion) verwendet wird, beachten S
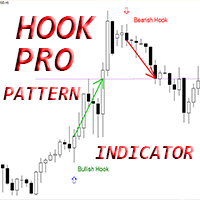
Crypto_Forex-Indikator „Hook Pro Pattern“ für MT4 – kein Repainting, keine Verzögerung.
– Der Indikator „Hook Pro Pattern“ ist ein sehr leistungsstarker Indikator für Price Action Trading. – Der Indikator erkennt bullische und bärische Hook-Muster im Chart: – Bullischer Hook – Blauer Pfeil im Chart (siehe Bilder). – Bärischer Hook – Roter Pfeil im Chart (siehe Bilder). – Mit PC-, Mobil- und E-Mail-Benachrichtigungen. – Der Indikator „Hook Pro Pattern“ lässt sich gut mit Unterstützungs-/Widerst

Smarter Trendkanal Indikator Beschreibung:
Der Smarter Trendkanal Indikator ist ein leistungsstarkes und anpassungsfähiges Werkzeug, das entwickelt wurde, um den Händlern zu helfen, die Haupttrends des Marktes visuell zu identifizieren, indem er dynamisch Unterstützungs- und Widerstandslinien im Preischart erstellt. Durch die Verwendung fortschrittlicher Fraktalberechnungen zeichnet der Indikator automatisch Trendlinien, die sich an die Marktbedingungen anpassen und den Händlern helfen, Durchbr
FREE

Tipu Trend ist ein intelligenter Indikator ohne Verzögerung, der den Trend ausgewählter Zeitrahmen anzeigt.
Merkmale Anpassbare Kauf-/Verkaufswarnungen, Push-Warnungen, E-Mail-Warnungen oder visuelle Warnungen auf dem Bildschirm. Ein einfach zu handhabender Indikator, der das Rauschen im Kursgeschehen glättet. Hebt die verschiedenen Märkte hervor. Fügen Sie Tipu Panel hinzu ( hier zu finden) und schalten Sie die folgenden zusätzlichen Funktionen frei. Ein einfach zu bedienendes Panel, das den T
FREE

UR VolumenTrend
UR VolumeTrend ist der deutlichste Volumenindikator, der den anhaltenden Trend in Bezug auf das Volumen anzeigt. Funktioniert perfekt mit anderen Indikatoren wie UR TrendExhaustion, um lokale Hochs und Tiefs zu signalisieren.
Begrenzt auf nur 2 Parameter – je höher die Werte, desto länger werden die Trends angezeigt. Gradientenextreme zeigen mögliche Volumenerschöpfungen an, um eine potenzielle Trendwende abzufangen. Zwei Linien – Der Volumentrend und der Durchschnitt. Der b
Sniper Flip Zones – Präzises Kauf-/Verkaufssignalsystem
Ich habe Sniper Flip Zones entwickelt, um äußerst präzise KAUF- und VERKAUF-Signale zu generieren, indem Momente identifiziert werden, in denen sich der Impuls in trendstarken oder seitwärts gerichteten Märkten stark verändert. Es funktioniert hervorragend auf XAUUSD M1/M5, kann aber auf jedes Währungspaar und jeden Zeitrahmen angepasst werden, dank konfigurierbarer Parameter.
Join the channel to stay updated: https://www.mql5.com/en/chan
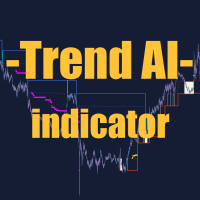
Trend AI Indicator Beschreibung:
Der Trend AI Indicator ist ein leistungsstarkes Marktanalysetool, das künstliche Intelligenz verwendet, um Trends und Schlüssellevels zu identifizieren. Der Indikator passt sich automatisch an sich ändernde Marktbedingungen an und liefert präzise Daten für die Entscheidungsfindung. Hauptfunktionen: Trendidentifikation: Der Indikator verwendet Algorithmen des maschinellen Lernens, um die Trendrichtung (Aufwärts-, Abwärts-, Seitwärtstrend) genau zu bestimmen. Sc
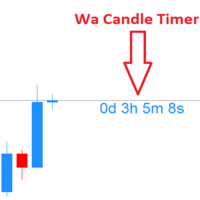
Wa Candle Timer MT4 ist ein leistungsstarker und benutzerfreundlicher Indikator, der die verbleibende Zeit bis zur nächsten Kerze auf deinem MT4-Chart anzeigt. Er unterstützt Trader bei der besseren Überwachung von Kerzenschlusszeiten für präzisere Entscheidungen. Hauptfunktionen :
Countdown-Anzeige für die aktuelle Kerze
Farbwechsel, wenn die verbleibende Zeit unter einen definierten Prozentsatz fällt
Neu in Version 3.00: Anpassbarer Alarm bei Erreichen eines bestimmten Prozentsatzes
FREE
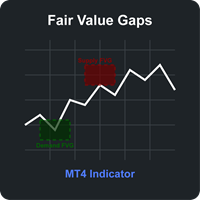
Fair Value Gaps (FVG) Indikator für MT4 Der Fair Value Gaps (FVG) Indikator ist ein leistungsstarkes Werkzeug der technischen Analyse zur Identifizierung und Visualisierung signifikanter Preisungleichgewichte im Markt. Diese Lücken entstehen, wenn der Preis eine starke Richtungsbewegung macht und stellen Bereiche dar, in denen der Preis so schnell gestiegen oder gefallen ist, dass keine Handelsaktivität stattfand – ein mögliches Zeichen für institutionelles Interesse und starken Marktimpuls. Hau
FREE
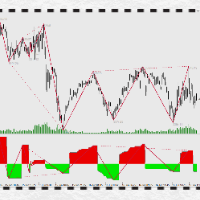
Einführung in PowerTrapezoid:
Die Anwendung des Markt-Power-Abweichungssystems ist kein Geheimnis, wie z.B. die Volumen-Preis-Abweichung, MACD-Abweichung, Chanlun-Abweichung und so weiter. Jedoch, wie man richtig verstehen und berechnen, und genau beurteilen, die Zunahme oder Abnahme der POWER ist eine Schwelle in der Anwendung, die schwierig ist, mit dem herkömmlichen System zu überschreiten. Wie kann man das Aufzählen vermeiden? Wie implementiert man mehrstufiges paralleles Rechnen mit Rückf
FREE

SuperTrend ist einer der besten Trendindikatoren in Metatrader 4 (MT4). Triple SuperTrend-Indikator ist ein Indikator, der aus drei Super-Trend-Indikator, die angeordnet werden können, bestehen. Dieser Indikator ist von mql4 Sprache gebaut und nicht von MT4-Plattform zur Verfügung gestellt. Wir empfehlen Ihnen, den EMA SuperTrend Strategy Indicator zu verwenden, wenn Sie ein besseres Ergebnis erzielen wollen :
https://www.mql5.com/en/market/product/91664
Dieser Indikator ist einfach zu bediene
FREE

Flag Pattern Indicator - Ihr Leitfaden zum Erkennen profitabler Handels-Setups Willkommen in der Welt des Präzisionshandels mit dem "Flag Pattern Indicator". Dieses leistungsstarke Tool wurde für den MetaTrader entwickelt und ist Ihre erste Wahl, um eines der zuverlässigsten und vielseitigsten Chartmuster der technischen Analyse zu erkennen: das Flaggenmuster. Egal, ob Sie ein erfahrener Trader sind oder gerade erst anfangen, dieser Indikator vereinfacht das Erkennen von Flaggenmustern und versc
FREE
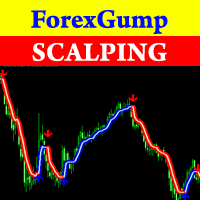
Achtung! Freunde, da es in letzter Zeit viele Betrüger im Internet gibt, die Indikatoren namens ForexGump verkaufen, haben wir uns entschlossen, Sie zu warnen, dass nur auf unserer Seite die LIZENZ-AUTORENVERSION des Indikators verkauft wird! Wir verkaufen diesen Indikator nicht auf anderen Websites zu einem niedrigeren Preis als dieser! Alle Indikatoren sind billiger verkauft - Fälschungen! Und noch häufiger werden Demoversionen verkauft, die nach einer Woche nicht mehr funktionieren! Deshalb,
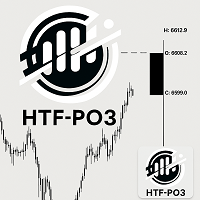
HTF Power of Three (ICT) - MT4 Indikator - Version 1.1 Überblick Der HTF Power of Three-Indikator ist eine professionelle Umsetzung des Power of Three-Konzepts des Inner Circle Trader (ICT), das von Larry Williams inspiriert wurde. Dieser Indikator visualisiert die Entwicklung von HTF-Kerzen in Echtzeit auf jedem Chart mit niedrigerem Zeitrahmen und ist damit ein unverzichtbares Werkzeug für ICT-Händler, die institutionelle Kursbewegungsmuster studieren. Was ist Power of Three (PO3)? Power of Th
CIS ist für den Handel mit einem Korb von korrelierenden Währungen sowie für den Handel mit einzelnen Instrumenten konzipiert: Indikatoren
VSA-Indikator , der Pfeile zeichnet (nicht neu gezeichnet). Seine Signale zeigen die Preisumkehr auf einem ruhigen Markt oder die Verringerung des Anstiegs oder Rückgangs bei starken Bewegungen an. Funktioniert gut in den Flats. Da der Indikator die Volumina in seine Berechnungen einbezieht, ist abends und nachts Vorsicht geboten, wenn die Volumina sehr ger
Ist Ihnen bekannt, warum der MetaTrader Market die beste Plattform für den Verkauf von Handelsstrategien und technischer Indikatoren ist? Der Entwickler braucht sich nicht mit Werbung, Programmschutz und Abrechnung mit Kunden zu beschäftigen. Alles ist bereits erledigt.
Sie verpassen Handelsmöglichkeiten:
- Freie Handelsapplikationen
- Über 8.000 Signale zum Kopieren
- Wirtschaftsnachrichten für die Lage an den Finanzmärkte
Registrierung
Einloggen
Wenn Sie kein Benutzerkonto haben, registrieren Sie sich
Erlauben Sie die Verwendung von Cookies, um sich auf der Website MQL5.com anzumelden.
Bitte aktivieren Sie die notwendige Einstellung in Ihrem Browser, da Sie sich sonst nicht einloggen können.