Technische Indikatoren für den MetaTrader 4 - 35

Basierend auf der Aktiensoftware Gold Line Indikator angepasst. Die Parameterwerte können nach Bedarf angepasst werden. Spezifische Regeln für die Verwendung finden Sie in der Anleitung der jeweiligen Aktiensoftware. ////////////////////////////////////////////////////////////////////////////////////////// // Der Quellcode der Aktienformel lautet wie folgt:
VAR1:=(HIGH+LOW+OPEN+CLOSE)/4;
Gold Line:EMA(3*VAR1-2*SMA(VAR1,2,1),13); ////////////////////////////////////////////////////////////////
FREE

TurnPoint Indicator - Werkzeug für Marktumkehr und Trendsignale Der TurnPoint Indicator wurde entwickelt, um Händlern zu helfen, potenzielle Wendepunkte und Schlüsselniveaus auf dem Markt zu erkennen. Durch die Analyse des Kursgeschehens werden Bereiche hervorgehoben, in denen Umkehrungen oder Fortsetzungen wahrscheinlich sind, so dass Händler Trendänderungen effektiver vorhersehen können. Dieses Tool enthält eine fortschrittliche Logik zum Filtern von Signalen, um Rauschen und Fehlalarme zu re
FREE

Der Zweck dieser neuen Version des MT4-Standardindikators, der in Ihrer Plattform enthalten ist, besteht darin, in einem Unterfenster mehrere Zeitrahmen desselben Indikators anzuzeigen. Siehe das Beispiel im Bild unten. Aber die Anzeige ist nicht wie bei einem einfachen MTF-Indikator. Dies ist die tatsächliche Anzeige des Indikators in seinem Zeitrahmen. Hier sehen Sie die verfügbaren Optionen des FFx-Indikators: Wählen Sie die anzuzeigenden Zeitrahmen (M1 bis Monthly) Definieren Sie die Breite
FREE

Lampropeltis ist ein Trendindikator. Der Berechnungsalgorithmus basiert auf den Daten der im MT4-Paket enthaltenen Standardindikatoren und der Interpretation der von diesen Indikatoren gebildeten Muster. Die Einstellungen umfassen einen minimalen Satz von Parametern: Slow MA - langsame MA-Periode; Slow MA Methode - langsame MA Glättungsmethode; Fast MA - schnelle MA-Periode; Schnelle MA-Methode - schnelle MA-Glättungsmethode. Die Änderung der Signalfarbe auf rot zeigt die Möglichkeit der Eröffnu
FREE

TREND MATE ist ein nützlicher Indikator, der Sie bei Ihrer Entscheidung unterstützt, entsprechend dem aktuellen Trend zu handeln . Es ist möglich, einen Alarm und eine Push-Benachrichtigung zu konfigurieren, die Sie beim Eintritt in die erste Kerze eines Bullen-/Bärentrends erhalten. Wenn Sie diesen Indikator für einen EA verwenden möchten, benutzen Sie die Funktion iCustom wie folgt:
DOWNTREND : iCustom(NULL,0,"Trend_Mate",0,0) . Bei einem Abwärtstrend ist das Ergebnis "1", sonst "0".
UPTREN
FREE

Der Indikator misst die Volumina auf verschiedenen Charts und Instrumenten. Sein Hauptvorteil ist die Fähigkeit, verschiedene Broker zu vergleichen. Je weniger Middle Volume und Tick / Second , desto zuverlässiger ist der Broker. In der oberen linken Ecke befindet sich ein Kommentar Kommentar Daten: Tick/Sekunde - Anzahl der Ticks pro Sekunde für ein ausgewähltes Instrument Mittleres Volumen - durchschnittliches Volumen im vorletzten Balken Mit diesem Indikator lässt sich die relative Marktaktiv
FREE
Spread Sekanas: Die wahren Kosten für Ihren Handel Hören Sie auf, mit Pips und Punkten zu spekulieren. Mit dem Spread Sekanas-Indikator sehen Sie die tatsächlichen , proportionalen Kosten des Spreads. Der traditionelle Spread, der in Pips gemessen wird, ist irreführend. Ein Spread von 2 Pips auf EUR/USD ist etwas völlig anderes als ein Spread von 2 Pips auf GBP/JPY oder ein Spread von 2 $ auf Gold. Dies macht es unmöglich, Ihre tatsächlichen Handelskosten für verschiedene Instrumente konsistent
FREE

Was ist ein Tool? Dieser Indikator dient zum Vergleich von 8 Hauptwährungen aus 28 Paaren und mehreren Zeitrahmen und berechnet eine Stärkebewertung von 0-100. Wie zu verwenden Setzen Sie den Indikator auf ein beliebiges Paar und einen beliebigen Zeitrahmen, und geben Sie nur den Wert der X-Y-Position ein, der im Diagramm angezeigt werden soll. Pair : Any Timeframe : Any Input Parameter Start X Position : Value of X on chart Start Y Position : Value of Y on chart Visit my products Target
FREE
Der Quad-Filter Pro: Erschließen Sie den Präzisionshandel und filtern Sie das Rauschen heraus Haben Sie genug von komplexen Charts und dem Verpassen profitabler Gelegenheiten? In den volatilen Märkten von heute ist es riskant, sich auf einen einzigen Indikator zu verlassen. Sie brauchen eine felsenfeste Bestätigung , um hochwahrscheinliche Trades vom Marktrauschen zu trennen. Wir stellen Ihnen den Quad-Filter Pro vor - Ihren ultimativen MetaTrader 4-Indikator, der für unvergleichliche Handelspr
FREE

Der Sessions Partition Indicator zeichnet klare, präzise Trennlinien für die Handelssitzungen in Sydney, Tokio, London und New York .
Er passt sich automatisch an die Serverzeit Ihres Brokers an und ermöglicht eine vollständige Anpassung der GMT. Dieser Indikator wurde speziell für IC-Märkte (Winter - GMT+2) entwickelt und bietet Händlern eine klare visuelle Struktur der Intraday-Phasen des Marktes, wodurch sitzungsbasierte Strategien viel einfacher zu verfolgen sind. Hauptmerkmale 4 wichtig
FREE

Der Indikator basiert auf der Erkennung von Engulfing-Candlestick-Mustern innerhalb des aktuellen Zeitrahmens. Wenn solche Muster gefunden werden, erzeugt er Kauf- und Verkaufssignale, die durch Aufwärts- bzw. Abwärtspfeile dargestellt werden. Der Benutzer ist jedoch für die Bestimmung des vorherrschenden Trends verantwortlich. Sobald der Trend identifiziert ist, sollte er entsprechend dem entsprechenden Signal handeln, das mit der Trendrichtung übereinstimmt.
FREE
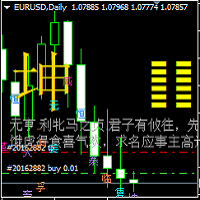
Zhouyi Yijing 64 Hexagramme Hexagrammwechselanzeige
1. Beschreibung des Hexagramm-Indikators: (1) Dieser Indikator mit 64 Hexagrammen basiert auf dem Yin-Yang-Transformationsgedanken der "Buch der Wandlungen"-Philosophie der alten chinesischen Kultur und integriert die Ergebnisse des Long- und Short-Spiels jeder Kerzen-K-Linien-Periode des K-Linien-Charts für den Finanzhandel unter Verwendung der ältesten Vorhersage-Codierungsmethode Chinas, in Form der 64 Hexagramme des Buches der Wandlungen,
FREE

...................................................................................................................... ............rsi................ ...........................................rsi für die Zeiten M30 und D1............................................. ...............................fast jeder verwendet rsi bei 1 Zeitrahmen aber.............................. ..................................wenn wir 2mal rsi haben, was man sehen kann ................................... Ich schre
FREE
Klassischer Keltner-Kanalindikator, erweiterte Version. Funktioniert auf allen Instrumenten. Er zeigt die Keltner-Bänder unter diesen Parametern an: * periodMa - Periode des gleitenden Durchschnitts * periodAtr - Zeitraum des ATR (Average True Range) * atrMultiplier - ATR-Multiplikator, multipliziert den Bereich, berechnet durch den Parameter PeriodATR * modeMA - Modi der Berechnungen des gleitenden Durchschnitts (MA) (einfach, exponentiell, geglättet, linear gewichtet) * modePrice - Modi der Pr
FREE

Der Indikator errechnet die wahrscheinlichsten Niveaus der Preisrückkehr. Kann zur Festlegung des Take-Profit-Niveaus verwendet werden. Der empfohlene Zeitrahmen ist ein beliebiger, mit entsprechender Einstellung. Einstellungen.
Zeitraum - Anzahl der Kerzen für die Analyse. Genauigkeit - Genauigkeit der Pegelberechnung in Punkten. Breite - Größe der Kursmarkierung. In der Regel braucht man nicht viel Zeit, um die Niveaus auszuarbeiten, die Niveaus sind ziemlich genau, wenn sie berührt werden, u
FREE

Beschreibung Ich denke, fast alle Trader träumen von einem nicht nacheilenden MA. Ich habe diesen Traum in meinem Indikator verwirklicht. Er ermöglicht die Vorhersage zukünftiger MA-Werte! Der Indikator kann auf vier verschiedene Arten verwendet werden: Die erste - Vorhersage für die gewünschte Anzahl von Balken. So können Sie das zukünftige Kursverhalten beurteilen. Die zweite - die Erzeugung von nicht nachlaufenden "Durchschnitten". Dies wird erreicht, indem man den MA um die Hälfte des Mittel
FREE

TH3ENG CURRENCY STRENGTH SCANNER Der beste Währungsstärkenleser, der auf mehr als 4 exzellenten Modi basiert, basierend auf Preisaktion und Volumen mit verschiedenen Algorithmen. Dieser Indikator liest alle Paare Daten zu messen und finden Sie die besten Ergebnisse aller Währungen und ordnen sie in einem separaten Dashboard-Panel.
Sie können die stärkste Währung und die schwächste Währung finden und dann mit diesen Paaren handeln. NICHT KOPLIZIERT NICHT WIEDERGEBEN NICHT LAGIEREN
Eingabeparame
FREE
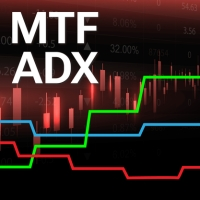
Die Verwendung mehrerer Zeitrahmen für die Analyse mit dem Multi Timeframe Average Directional Index kann Händlern mehrere bedeutende Vorteile bieten: Umfassende Marktsicht: Durch die Anwendung des Mtf ADX Standard über verschiedene Zeitrahmen hinweg erhalten Händler eine breitere Perspektive auf die Marktdynamik. Dies ermöglicht es ihnen, Trends, Muster und potenzielle Umkehrpunkte zu erkennen, die in verschiedenen Zeitskalen deutlicher oder konsistenter sein könnten. Verbesserte Mustererkennun
FREE

Der Master Trend Analyzer ist ein leistungsstarker und flexibler MetaTrader 4 (MT4) Indikator, der Händlern hilft, Trends über mehrere Zeitrahmen gleichzeitig zu analysieren. Durch die Kombination mehrerer gleitender Durchschnitte (MAs) aus verschiedenen Zeitrahmen in einem Diagramm bietet dieses Tool einen klaren und umfassenden Überblick über die Markttrends, wodurch es einfacher wird, wichtige Unterstützungs-/Widerstandsniveaus zu identifizieren, Trends zu bestätigen und fundierte Handelsents
FREE
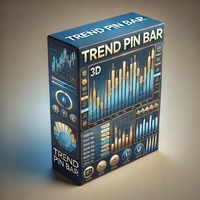
Der Trendumkehr-Indikator ist ein technisches Hilfsmittel zur Erkennung potenzieller Trendumkehrungen auf dem Markt, die auf der Bildung von Pin-Bars basieren. Er ist besonders effektiv auf Zeitrahmen wie H1 (stündlich) , wo Umkehrmuster tendenziell zuverlässiger sind. Der Indikator signalisiert Trendumkehrungen, indem er einen roten Punkt für einen potenziellen Abwärtstrend und einen grünen Punkt für einen potenziellen Aufwärtstrend zeichnet. Wie der Indikator funktioniert Der Indikator analysi
FREE

Der Indikator zeichnet zwei einfache gleitende Durchschnitte anhand von Höchst- und Tiefstkursen. Die Linie MA_High wird angezeigt, wenn der gleitende Durchschnitt nach unten gerichtet ist. Sie kann verwendet werden, um eine Stop-Order für eine Verkaufsposition zu setzen. Die MA_Low-Linie wird angezeigt, wenn der gleitende Durchschnitt nach oben gerichtet ist. Sie kann verwendet werden, um eine Stop-Order für eine Kaufposition zu setzen. Der Indikator wird im TrailingStop Expert Advisor verwende
FREE
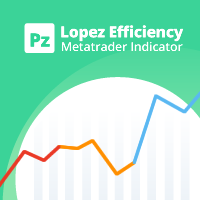
Dieser Indikator analysiert, wie effizient die aktuelle Marktbewegung ist, basierend auf dem tatsächlichen High-Low-Verhältnis einer bestimmten Anzahl von Balken. [ Installationsanleitung | Update-Anleitung | Fehlerbehebung | FAQ | Alle Produkte ] Das Verhältnis ist die Effektivität der Marktbewegung Ein Verhältnis unter 1 bedeutet, dass der Markt nirgendwo hinführt Ein Verhältnis über 1 bedeutet, dass der Markt beginnt, Direktionalität zu zeigen Ein Verhältnis über 2 bedeutet, dass der Markt e
FREE

Der Indikator markiert die Punkte auf dem Chart, an denen der Standard-ZigZag-Indikator seine Ober- oder Unterseite eingezeichnet hat. Mit diesem Indikator können Sie leicht nachvollziehen, wo sich die Ober- oder Untergrenze gebildet hat und wo sie neu gezeichnet wurde. Der Indikator gibt eine Warnung aus, wenn ein neuer Punkt erscheint. Achtung! Der Parameter Angewandter Kurs - erweitert die Möglichkeiten der Erstellung des Indikators. Es ist möglich, den Indikator auf der Basis von OPEN-, CLOS
FREE

Tester Periods ist ein nützlicher Indikator für visuelle Strategietester, der die Chartperioden verlängert. Er wurde für das Handelsprogramm Trade Shell (einschließlich Trade Shell SMC ) entwickelt .
Starten Sie die Trade Shell auf dem visuellen Tester. Setzen Sie dann den Indikator Tester Periods auf den Chart. Wenn Sie z.B. die Zeitrahmen M1, M5, M10, M15 sehen wollen , müssen Sie den visuellen Tester auf M1 laufen lassen und Multiplikatoren wie diese definieren: TimeFrame_Periods_Multiplier
FREE

Der Indikator zeigt die maximale Abweichung vom gleitenden Durchschnitt in einem bestimmten Zeitraum an. Die Begrenzungen des Kanals können als eine Art überkaufte/überverkaufte Zonen dienen, von denen aus ein Preisrückzug zur Mitte des Kanals erfolgen kann. Hinter diesen Niveaus sollten Sie nach zusätzlichen Signalen für den Einstieg in ein Geschäft Ausschau halten. In den Einstellungen des Indikators gibt es nur 2 Parameter - den Zeitraum, für den der Indikator berechnet wird, und die Methode
FREE

Überblick über die Indikatoren Trendindikator Verwendung gleitender Durchschnitte. Alarme von höchster Qualität, die keiner Einführung bedürfen. Der Indikator bleibt dem ursprünglichen Algorithmus vollständig treu und nutzt weitere nützliche Funktionen.
Einfach zu handeln Führen Sie alle Arten von Benachrichtigungen aus Es ist keine neue Farbe und es ist keine Rückfarbe. Einstellung Indikator WMA50 im Zeitrahmen H1 für jedes Währungspaar und Gold Spot. EMA200 im Zeitrahmen H1 für jedes Währung
FREE

ADR 20 zeigt die durchschnittliche Pips-Spanne eines Forex-Paares an, gemessen über eine Anzahl von 20 Tagen. Händler können damit potenzielle Kursbewegungen außerhalb der durchschnittlichen täglichen Bewegung visualisieren.
Wenn die ADR über dem Durchschnitt liegt, bedeutet dies, dass die tägliche Volatilität höher als normal ist, was bedeutet, dass das Währungspaar über seine Norm hinausgehen könnte.
Die ADR ist auch für den Handel mit Intraday-Umkehrungen nützlich. Erreicht ein Währungspaar
FREE
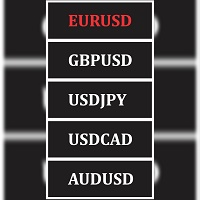
Wechseln Sie nahtlos von einem Fenster aus zwischen verschiedenen Paaren, während Sie Ihre aktuelle Chartvorlage für alle Paare beibehalten. Dieses Tool holt sich einfach alle Paare in Ihrem Marktbeobachtungsfenster und ermöglicht es Ihnen, von einem Fenster aus zwischen ihnen zu wechseln, während Ihre aktuelle Chart-Einstellung und alle geladenen Indikatoren und Chart-Objekte für alle in Ihrem Marktbeobachtungsfenster verfügbaren Paare beibehalten werden.
FREE

Es ist ein einfaches, aber nützliches Werkzeug zur Erstellung eines Rasters auf der Basis von Hüllkurven.
Es können nur 2 Parameter eingestellt werden: 1) "Periode" - die Periode aller sichtbaren Hüllkurven (d.h. 4) und 1 gleitender Durchschnitt (Achse der Hüllkurven), 2) "Deviations Distance" - der Abstand zwischen den Hüllkurven.
Natürlich können die Farben aller 9 Linien nach Belieben geändert werden. Es funktioniert mit allem, was in Ihrem Market Watch verfügbar ist.
Viel Erfolg!
FREE
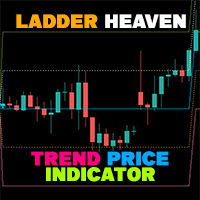
Wenn Sie Schwierigkeiten haben, den Trend sowie Einstiegspunkte, Stop-Loss-Punkte und Take-Profit-Punkte zu bestimmen, wird Ihnen "Ladder Heaven" dabei helfen. Der "Ladder Heaven"-Algorithmus wird auf den Preis in Abhängigkeit von den von Ihnen eingegebenen Parametern angewendet und liefert Ihnen Signale, Trends, Einstiegspunkte, Stop-Loss-Punkte, Take-Profit-Punkte, Unterstützung und Widerstand in der jeweiligen Trendrichtung.
Hilft Ihnen, Trends, Stop Losses und Take Profits in Ihrer Strate
FREE

Unterstützende Datei (1 von 2) für T3 Cloud MA
Trendindikator, abgeleitet aus gleitenden T3-Durchschnitten. Die Wolke wird durch eine schnelle T3- und eine langsame T3-Linie begrenzt. Kauf-/Verkaufsmöglichkeiten oberhalb/unterhalb der Wolke. Die schnellen und langsamen T3 MA-Linien können auch als dynamische Unterstützung/Widerstand für aggressivere Einstiege verwendet werden. Verwenden Sie die Standardwerte für die besten Einstellungen. Die Anzahl der Rückblick-Balken ist benutzerdefiniert. Di
FREE

White Crow Indikator
von VArmadA Ein einfacher, aber leistungsstarker Indikator, der auf der Kerzenanalyse basiert und die White Soldiers & Crow-Muster verwendet.
Funktioniert mit Zeitrahmen von 1H und höher und wurde für alle wichtigen Paare getestet. Achten Sie auf das Signal: Ein Pfeil, der einen Long- oder Short-Einstieg anzeigt.
Wie es funktioniert:
Pfeile zeigen einen laufenden Trend an. Nach mehreren bullischen oder bearischen Kerzen in Folge ist die Chance auf eine weitere Kerze in R
FREE
Der BestTF-Indikator hilft Ihnen, schnell den besten Zeitrahmen für den Handel mit einem Währungspaar oder einer Kryptowährung zu wählen. Der BestTF-Indikator berechnet und zeigt in der Tabelle die Chart-Steilheit (Volatilität) für alle bestehenden Zeitrahmen des aktuellen Handelsinstruments an. Warum es wichtig ist, den richtigen Zeitrahmen zu wählen
Die Wahl des Zeitrahmens ist aus mehreren Gründen ein wichtiger Aspekt beim Handel auf dem Währungsmarkt:
Handelsstrategien: Verschiedene Handel
FREE

Der Zweck dieser neuen Version des MT4-Standardindikators, der in Ihrer Plattform enthalten ist, besteht darin, in einem Unterfenster mehrere Zeitrahmen desselben Indikators anzuzeigen. Siehe das Beispiel im Bild unten. Aber die Anzeige ist nicht wie bei einem einfachen MTF-Indikator. Dies ist die tatsächliche Anzeige des Indikators in seinem Zeitrahmen. Hier sehen Sie die verfügbaren Optionen des FFx-Indikators: Wählen Sie die anzuzeigenden Zeitrahmen (M1 bis Monthly) Definieren Sie die Breite
FREE
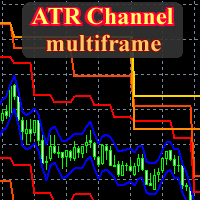
Dies ist eine vollständige Multitimeframe-Version des Standardindikators ATR Channel , die für jede Kombination von Zeitrahmen funktioniert. Der Indikator ermöglicht die Anzeige von Preiskanälen aus verschiedenen Zeitrahmen in einem Fenster, und sie werden immer in einer korrekten Zeitskala angezeigt. Sie können eine Reihe von Intervallen erstellen und frei zu einem höheren oder niedrigeren Intervall wechseln. Bitte beachten Sie: Im Anzeigemodus "Vom Medianpreis " ist es einfach, Umkehrpunkte an
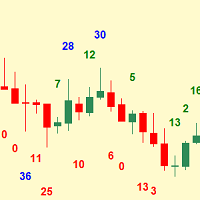
Einfachster Indikator für Balkenschatten. Sehr nützlich für die Känguru-Schwanz-Strategie.
"Schatten" - das ist der Abstand zwischen Hoch und Schluss des Bullen-Balkens und Tief und Schluss des Bären-Balkens. Der Zweck des Schattens ist es, Ihnen zu zeigen, ob der Balken stark ist oder nicht, ob er innerhalb oder außerhalb des Trends liegt. Er hilft sogar festzustellen, ob ein Trend beginnt. Eingabe-Argumente: Wie viele Prevoius-Balken berechnet werden sollen Wert, der übergeben werden soll, um
FREE

RSI-Indikator mit Signallinien, bei deren Schnittpunkt eine entsprechende Benachrichtigung ausgegeben wird, die in Form eines normalen Alarms oder in Form einer Benutzer-Sounddatei erfolgen kann.
Der Indikator hat auch die Funktion, Push-Benachrichtigungen und E-Mail-Benachrichtigungen beim Schnittpunkt dieser Niveaus zu senden.
Die Werte der Stufen können unabhängig voneinander in den Einstellungen des Indikators festgelegt werden, und, falls gewünscht, können sie direkt im Indikatorfenster
Beschreibung:
Dieser kostenlose Indikator ermöglicht es Ihnen, den Max/Min-Spread in einem Bar/Candle zu überwachen. Indem Sie ihn 24h/24h laufen lassen, können Sie erkennen, in welchem Zeitraum der Spread am höchsten ist. Auf dieser Grundlage können Sie den Markt besser verstehen und eine bessere Handelsstrategie entwickeln/verbessern.
Parameter: Limit: <Grenze des Spreads, oberhalb derer der Indikator den Preis markiert, bei dem ein hoher Spread auftritt>
Anmerkung: Neben dem Preis, der au
FREE

Dynamischer Preisvolatilitätsindikator (DPVI)
Der Dynamische Preisvolatilitätsindikator (DPVI) wurde entwickelt, um Händlern wertvolle Einblicke in die Marktvolatilität und potenzielle Preisbewegungen zu geben. Er kombiniert Elemente der Volatilitätsanalyse und der Trenderkennung, um Händlern zu helfen, fundierte Handelsentscheidungen zu treffen.
Merkmale: Dynamische Volatilitätsbänder: Verwendet einen proprietären Algorithmus zur Berechnung dynamischer Volatilitätsbänder, die sich in Echtzeit
FREE

Der Choppy Market Index (CMI) ist ein Indikator für die Marktvolatilität. Je kleiner der Wert des Indikators ist, desto instabiler ist der Markt. Er berechnet die Differenz zwischen dem Schlussstand des letzten Balkens und einem Balken vor n Perioden und teilt diesen Wert dann durch die Differenz zwischen dem höchsten Hoch und dem niedrigsten Tief dieser Balken.
Merkmale Einfaches Trennen von Trends vom Marktrauschen Der Indikator ist nicht nachbildend. Gibt CMI-Werte über einen Puffer zurück.
FREE

Dieser Indikator verwendet zwei gleitende Durchschnitte, einen langsameren und einen schnelleren gleitenden Durchschnitt. Ein Crossover tritt auf, wenn ein schneller gleitender Durchschnitt (d.h. ein gleitender Durchschnitt mit kürzerer Periode) einen langsameren gleitenden Durchschnitt (d.h. einen gleitenden Durchschnitt mit längerer Periode) kreuzt. Signalanzeige mit Pop-up- und Push-Benachrichtigung. Variables Setup für jeden Gleitenden Durchschnitt, 3 Arten von Signalpfeilen, Pop-up-Alarm un

Der Indikator "Average Bar Chart " wurde entwickelt, um die traditionelle Heiken Ashi-Berechnung als exotischen Chartstil zu präsentieren. Dieser Indikator ist dafür bekannt, dass er das Chartrauschen reduziert und so für eine ruhigere Preisbewegung sorgt. Zusätzliche Indikatoren werden empfohlen
Wichtigste Merkmale Candlesticks für OHLC werden aus dem Chart entfernt. Durchschnittsbalken können als vollständige Balken ohne Schwänze angezeigt werden. Alle Funktionen und Merkmale dieses exotische
FREE
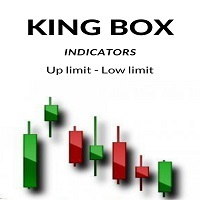
Das Produkt hilft, den Höchststand und den Tiefststand zu finden. Helfen Sie Anlegern, ihre Gewinne zu optimieren. Mit einer Gewinnrate von bis zu 80%. Sie brauchen keine Parameter zu verändern. Wir haben das beste Produkt optimiert. Ihre Aufgabe ist es nur noch zu sehen und zu handeln. Produkte mit technologischen Durchbrüchen. Kontaktieren Sie andere Produkte: https://www.mql5.com/en/users/hncnguyen/news.
FREE

Mit dieser Anzeige können Sie die Sichtbarkeit des Diagramms in Echtzeit ändern.
Die rechte Seite ist dem Benutzer verborgen. Die virtuelle Zeitleiste kann an eine beliebige Stelle im Diagramm verschoben werden.
Der Indikator funktioniert auch auf einem geschlossenen Markt.
Wenn Sie visuelle Analysen für den Handel verwenden, ist dieser Indikator ein großartiges Werkzeug, um Ihre Strategie zu testen.
Es wird Ihnen erlauben, nicht in die Geschichte zu gucken und ehrlich mit sich selbst in de
FREE
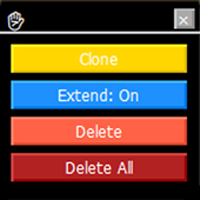
Trendlinien-Werkzeugkasten (MT4) Trendline Toolbox ist ein Hilfsindikator für MetaTrader 4, der bei der Verwaltung von Trendlinien und allgemeinen Chart-Objekten hilft. Er liefert keine Handelssignale und garantiert keine Gewinne. Wichtigste Funktionen Klonen der ausgewählten Trendlinie (Stil, Winkel und Kursniveau bleiben erhalten). Schalten Sie die Eigenschaft "Erweitern" für die ausgewählte Trendlinie ein. Löschen Sie die ausgewählte Trendlinie. Alle Objekte im aktuellen Diagramm löschen. Do
FREE

Lesen Sie das Elliott-Wellen-Prinzip automatisch. Mit dem Swing Reader können Sie das Elliott-Wellen-Prinzip ganz einfach durch ein automatisches System lesen. Mit Swing meinen wir einen ZigZag-Markt, der durch einen Ausbruch aus seiner Standardabweichung entsteht. Sie können die Abweichung manuell einstellen oder den Indikator dies automatisch tun lassen (indem Sie die Abweichung auf Null setzen).
Die Vorteile sind Keine Neueinfärbung. Punkte, die eine horizontale Linie anzeigen, in der stati

Der iRSI in iMA ist ein Indikator, der die Farbe des iMA ändert, wenn der iRSI das Niveau nach oben (Aufwärtstrend) oder das Niveau nach unten (Abwärtstrend) kreuzt. Es ist ein nützliches Werkzeug, um zu verfolgen, wenn die Aufwärts- und die Abwärts-iRSI auf iMA.
Sie können den Quellcode von hier erhalten .
Parameter MA_Periods - Zeitraum für iMA. MA_Methode - Methode für iMA. RSI_Periods - Zeitraum für den iRSI. RSI_ApliedPrice - Für den iRSI verwendeter Preis. RSI_LevelsUp - Level iRSI für A
FREE
Clock GMT Live hat alles, was Sie brauchen, um mehr über unseren Broker zu erfahren. Sie werden sich oft gefragt haben, in welcher GMT ich mich befinde oder an welcher GMT mein Broker arbeitet. Nun, mit diesem Tool können Sie sowohl die GMT in Echtzeit kennen Zeitversatz des Brokers und Ihrer Ortszeit kennen Sie auch ständig den Ping des Brokers Indem Sie es einfach zu einer Tageszeit platzieren, können Sie die Informationen erhalten
Der Preis steigt für jede Akquisition, damit werden wir schü
FREE

Binäre Optionen Tester Trading-Panel, um Ihre Strategien nach den Regeln der binären Optionen zu testen. Umfang: Legen Sie den Prozentsatz der Gewinn aus der Transaktion. Legen Sie die Ablaufzeit in Sekunden. Legen Sie die Wette GrößeSetzen Sie den Einzahlungsbetrag. Machen Sie mehrere Geschäfte in einer Reihe. Behalten Sie den Überblick über die Zeit vor Ablauf. Die Tick-Chart mit Handel Ebenen wird auf ein zusätzliches Fenster für die Genauigkeit dupliziert. Es ermöglicht Ihnen, sowohl in der
FREE

Der R Alligator Indikator wurde von Bill Williams eingeführt, er folgt dem Trend mit Hilfe von 3 geglätteten gleitenden Durchschnitten.
Standardmäßig werden die folgenden Werte verwendet: Der geglättete gleitende Durchschnitt über 13 Perioden (bekannt als Jaw) Der geglättete gleitende Durchschnitt über 8 Perioden (bekannt als die Zähne) Der geglättete gleitende Durchschnitt über 5 Perioden (bekannt als Lips)
Der R Alligator Indikator reduziert die Anzahl der falschen Trend Trades durch die Ve
FREE

Signale und Warnungen für den Indikator AMA (Adaptive Moving Average) basierend auf diesen MQL5-Beiträgen: Adaptive Moving Average (AMA) und Signale des Indikators Adaptive Moving Average . Hinweis : Dieses Tool basiert auf dem Code des AMA-Indikators, der von MetaQuotes Software Corp. entwickelt wurde.
Merkmale Die Signale werden beim Schließen des letzten Balkens/beim Öffnen eines neuen Balkens ausgelöst; Jede Art von Warnungen kann aktiviert werden: Dialogfeld, E-Mail-Nachricht, SMS-Benachri
FREE

Zeichnet tägliche, wöchentliche und monatliche Pivots und die entsprechenden Unterstützungs- und Widerstandsniveaus (S1, S2, S3, R1, R2, R3). Ideal für die Platzierung von Stop-Losses und/oder die Verwendung als Break-Out-Strategie. Merkmale Im Gegensatz zu anderen Pivot-Indikatoren auf dem Markt erhalten Sie sehr saubere Charts. Die Pivot-Levels werden unabhängig vom Zeitrahmen, auf dem Sie handeln, dargestellt, d.h. M1, M5, M15, M30, H1, H4 oder Daily-Zeitrahmen. Die Pivot-Levels ändern sich
FREE
Trendfinder MA Pro basiert auf farbigen Kerzen, die den Trend auf der Grundlage von zwei gleitenden Durchschnitten als Signal und zwei gleitenden Durchschnitten als Kauf- und Verkaufszone, der Steigung des langsamen gleitenden Signal-Durchschnitts und der ATR und des steigenden Volumens anzeigen. Dieser Indikator zeigt Ihnen den Farbwechsel auf dem nächsten Balken auf der Bestätigungskerze an und warnt Sie bei Kauf- und Verkaufssignalen, wenn er in die Kauf- und Verkaufszone eintritt und wenn d
FREE

Dies ist eine Erweiterung des zuvor veröffentlichten DollarIndex mit der Hinzufügung der Funktion zur Berechnung des EURO Index unter ICE Formula. Beachten Sie, dass der Broker die folgenden Daten bereitstellen sollte:
Für die Dollar-Index-Formel werden EURUSD, USDJPY, GBPUSD, USDCAD, USDSEK und USDCHF benötigt. Für die Euro-Index-Formel werden EURUSD, EURGBP, EURSEK und EURCHF benötigt. Wenn in dieser Version der SEK (der ungewöhnlichste Wert) nicht angegeben ist, funktioniert die Formel trotzd
FREE
Dieser Indikator zeigt die höchsten und niedrigsten Werte der von Ihnen gewählten Währung und des von Ihnen gewählten Tages an. Er zeigt auch den Durchschnitt an. Auf diese Weise können Sie die Gewinn-/Verlustwahrscheinlichkeit Ihrer Transaktionen für dieselben Tage herausfinden. Berichtet: Durchschnittliche Punkte pro Woche Durchschnittliche Punkte pro Jahr Durchschnittliche Punkte auf Lebenszeit Hinweis: Diese Funktion liefert Ihnen keine Kauf-/Verkaufssignale. Zeigt nur Durchschnittspunkte
FREE

Engulfing-Candlestick-Muster bestehen aus zwei Balken in einem Preisdiagramm. Sie werden verwendet, um eine Marktumkehr anzuzeigen. Die zweite Kerze ist viel größer als die erste, so dass sie die Länge des vorherigen Balkens vollständig abdeckt oder "verschlingt".
Durch die Kombination mit der Möglichkeit, die Trendrichtung zu berücksichtigen, eliminiert dieser Indikator viele falsche Signale, die normalerweise erzeugt werden, wenn der Gesamttrend nicht berücksichtigt wird.
FREE

Einführung in den Profi-Indikator ARKA - Candle Close Time
Möchten Sie immer die genaue verbleibende Zeit bis zum Schließen der aktuellen Kerze wissen? Oder wollen Sie den Broker-Spread in Echtzeit direkt auf Ihrem Chart sehen, ohne zusätzliche Berechnungen?
Der ARKA - Candle Close Time Indikator ist genau für diesen Zweck entwickelt worden : Ein einfaches, aber extrem leistungsfähiges Tool für Trader, die beim Handel Wert auf Klarheit, Präzision und Geschwindigkeit legen.
Hauptmerkm
FREE

Wenn es Ihnen langweilig ist, immer wieder das Handelssymbol in jedem Diagramm zu ändern, wenn Sie mehrere Diagramme zur Analyse von Preisen oder zum Handel verwenden. Dieser Indikator kann Ihnen helfen. Er ändert das Symbol jedes anderen Charts im Terminal in das gleiche wie in dem Chart, dem Sie diesen Indikator zugewiesen haben, sobald Sie ein neues Symbol zum Chart hinzufügen oder auf die Schaltfläche klicken. Nach Beendigung der Arbeit schläft er ruhig und wartet auf eine neue Gelegenheit,
FREE

Trend easy ist ein einfacher Trendindikator in Form eines Histogramms. Das Fenster des Indikators ist in zwei Teile unterteilt das obere Histogramm steht für eine Kaufbewegung, das untere Histogramm für eine Verkaufsbewegung. Zusätzlich zum Histogramm wird das Indikatorsignal durch Pfeile auf dem Chart vervielfältigt. Das Menü des Indikators enthält Anzahl der Balken in der Indikatorhistorie
Periodenwerte für die Trenderkennung die Erlaubnis, Pfeile auf dem Chart zu zeichnen Pfeilcode und Farben
FREE
Hallo zusammen. Nochmals, ich, Vadim Sergeyevich Lepeho, Händler (privat) Erfahrung 20 Jahre über. Hauptsächlich Forex. Ich empfehle Ihnen, den Indikator zu bewerten, zu testen, auszuprobieren. Und geben Sie Ihre Bewertung, Schlussfolgerung, SUMMARY....)))). Also, wie es funktioniert. Es ist sehr einfach zu verstehen. Der Algorithmus ist wie folgt. Der Indikator zeichnet auf dem Chart Kreise in verschiedenen Farben von unten nach oben. Wir warten darauf, dass 1, 2, na ja, höchstens 3 Kreise in g
FREE
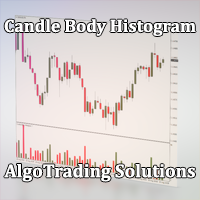
Indikator Kerze Körper Histogramm wird in einem separaten Fenster angezeigt und zeigt die Größe des Körpers jeder Kerze in Form eines Histogramms an. Je nachdem, ob die Kerze im Chart steigt oder fällt, ändert das Histogramm seine Farbe. Unregelmäßige Kerzen, die den gleichen Eröffnungs- und Schlusskurs haben, werden im Histogramm ebenfalls in einer anderen Farbe angezeigt. Da der Indikator auf dem Nullwert aufbaut, können Sie die Kerzenkörper visuell miteinander vergleichen. Sie können Ebenen a
FREE

Der Indikator SR levels true ist in kleinen Zeitrahmen sehr nützlich für Scalping, während er in größeren Zeitrahmen gut für Day- oder Positionshandel geeignet ist.
SR levels true kann 4 Unterstützungs-/Widerstandsniveaus basierend auf definierten maximalen Rücksprüngen vom Preisniveau zeichnen. Der Indikator scannt eine bestimmte Anzahl von Balken in der Zeitachse und eine bestimmte Anzahl von Pips in der Preisachse (beide Seiten - aufwärts und abwärts) und berechnet, wie oft der Preis von den
FREE

Entwickelt, um einen bestimmten Preis und Zeitpunkt auf einem MT4-Chart mit einem einzigen Mausklick zu markieren und diese Daten über alle Zeitrahmen für dasselbe Symbol zu synchronisieren. Sein Hauptzweck besteht darin, Händlern zu helfen, kritische Niveaus oder Ereignisse (z. B. Unterstützungs-/Widerstands- oder Einstiegspunkte) mit dauerhaften visuellen Markierungen zu lokalisieren und zu verfolgen. Der Indikator verwendet gestrichelte Linien für Preis- und Zeitfadenkreuze, die von Beschrift
FREE

Dieser Indikator ist für binäre Optionen konzipiert. Er basiert auf einer proprietären Divergenz des CCI-Indikators. Ein Verkaufssignal: Ein Abwärtspfeil erscheint auf dem Chart. Ein Kaufsignal: Ein Aufwärtspfeil erscheint auf dem Chart.
Eingabeparameter Historie - die Anzahl der Balken in der Historie für die Berechnung Periode CCI - Periode des technischen Indikators CCI Grenze nach oben - überkaufte Grenze für die Berechnung der Divergenz Grenze nach unten - überverkaufte Grenze für die Bere
FREE
Der MAS-Indikator kann für alle Währungspaare und jeden Zeitrahmen verwendet werden, er eignet sich für jede Handelsgeschwindigkeit. Darüber hinaus ist es relativ einfach, mit dem MAS-Indikator zu handeln. Dieser Indikator erzeugt zwei Signale: KAUF-Signal: Pfeil tief himmelblau VERKAUFSSIGNAL: roter Pfeil
Parameter des Indikators MA-Methode - Typ des gleitenden Durchschnitts MA Shift - Verschiebung des gleitenden Durchschnitts Schnell - gleitender Durchschnitt mit schneller Periode Langsam - g
FREE

MTF Heiken Ashi MA ist ein Heiken Ashi & Moving Average Indikator für mehrere Zeitrahmen. Vollständig anpassbar für fortgeschrittene & einzigartige Heiken Ashi & Moving Average Berechnungen.
Wichtigste Merkmale Geändertes Erscheinungsbild und Attraktivität gegenüber dem traditionellen Heiken Ashi MA , der nur Körper verwendet . MTF Höhere oder niedrigere Zeitrahmen sind verfügbar, was diesen Indikator ideal für Trends und Scalping macht. Es gibt viele Einstellungen, die für Signale bei einem ne
FREE

Übersicht über den Aroon Classic Indikator Der Aroon Classic Indikator ist ein technisches Tool, das das Auftreten und die Fortdauer von Trends auf einem Chart quantitativ erfasst. Er verwendet zwei Linien – „Aroon Up“ und „Aroon Down“ – um Trendstärke und Wendepunkte im Bereich von 0 bis 100 darzustellen. Ein hoher Aroon Up-Wert weist auf einen starken Aufwärtstrend hin, während ein hoher Aroon Down-Wert auf einen starken Abwärtstrend hinweist. Hauptmerkmale Visuelle Unterscheidung von Trendbeg
FREE

Preisvorhersage-Indikator ist ein Indikator, der präzise Preisumkehrungen unter Berücksichtigung eines höheren Zeitrahmens und eines niedrigeren Zeitrahmens Kerzenmuster Berechnungen zeigt Er eignet sich hervorragend für Scalping und Swing Trading. Kauf- und Verkaufspfeile werden auf dem Chart als Einstiegssignale angezeigt. GROSSE Pfeile zeigen den Trend an - KLEINE Pfeile signalisieren einen Handel (KAUF/VERKAUF) - Ein grüner GROSSER AUFWÄRTSPFEIL mit einer grünen Unterstützungslinie zeigt ei

Dieser Indikator wurde entwickelt, um die Differenz zwischen dem MOMENTUM-Kurs und dem Indikator zu ermitteln. Dieser Indikator zeigt die Differenz zwischen Kurs und Indikator auf dem Bildschirm an. Der Benutzer wird mit der Funktion zum Senden eines Alarms benachrichtigt. Unsere beliebten Produkte Super-Oszillator HC Kreuzsignal Super Cross Trend Starker Trend Super Signal Parameter divergenceDepth - Tiefe der Suche des 2. Referenzpunktes Momentum_Period - Zweiter Berechnungszeitraum indApplied
FREE
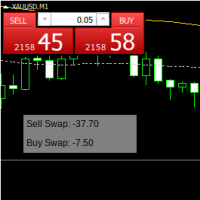
howSwap ist ein einfacher Indikator. zeigt SWAP auf der Instrumentenkarte für dieses Instrument an. Sie können die Magic angeben, wenn 0, dann alle. sowie die Koordinaten des Indikatorfelds auf der Grafik. Beim Devisenhandel können SWAPs je nach Zinsdifferenz zwischen den beiden am Handel beteiligten Währungen entweder positiv oder negativ sein. Händler können SWAPs entweder erhalten oder bezahlen, je nachdem, ob sie eine Position über einen bestimmten Zeitpunkt hinaus (normalerweise am Ende des
FREE
Ist Ihnen bekannt, warum der MetaTrader Market die beste Plattform für den Verkauf von Handelsstrategien und technischer Indikatoren ist? Der Entwickler braucht sich nicht mit Werbung, Programmschutz und Abrechnung mit Kunden zu beschäftigen. Alles ist bereits erledigt.
Sie verpassen Handelsmöglichkeiten:
- Freie Handelsapplikationen
- Über 8.000 Signale zum Kopieren
- Wirtschaftsnachrichten für die Lage an den Finanzmärkte
Registrierung
Einloggen
Wenn Sie kein Benutzerkonto haben, registrieren Sie sich
Erlauben Sie die Verwendung von Cookies, um sich auf der Website MQL5.com anzumelden.
Bitte aktivieren Sie die notwendige Einstellung in Ihrem Browser, da Sie sich sonst nicht einloggen können.