PZ Harmonacci Patterns
- Indikatoren
- Version: 12.0
- Aktualisiert: 16 Juli 2024
- Aktivierungen: 20

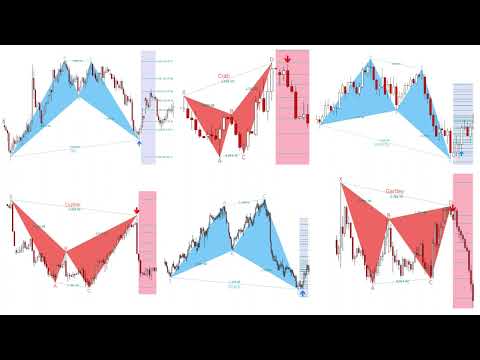
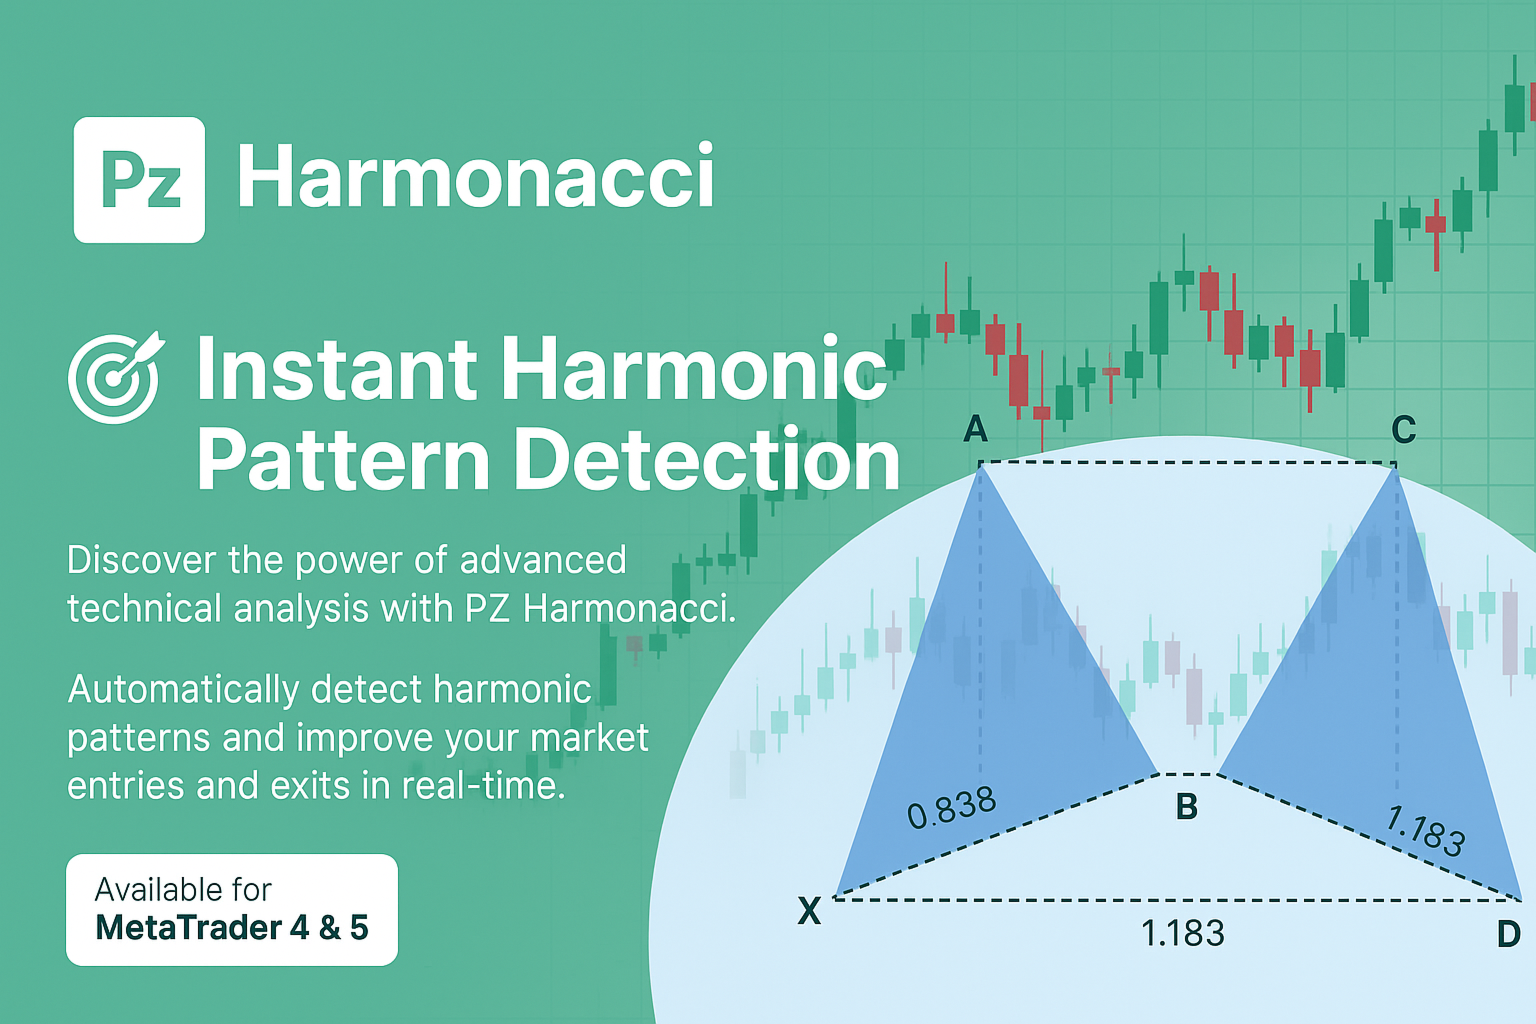
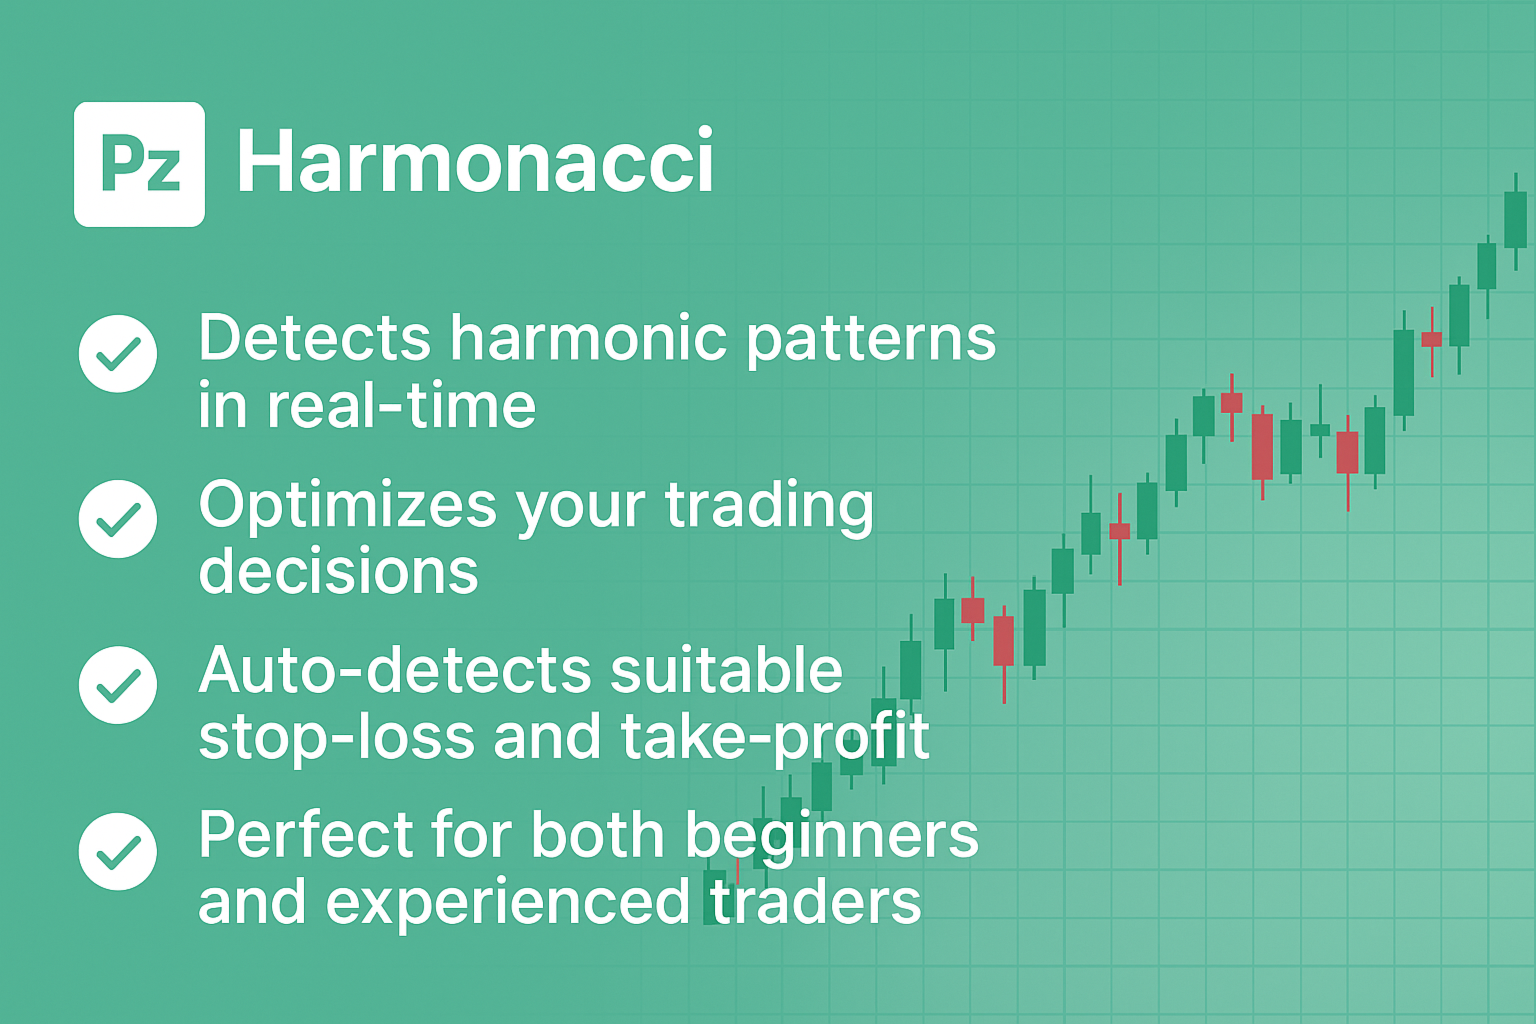
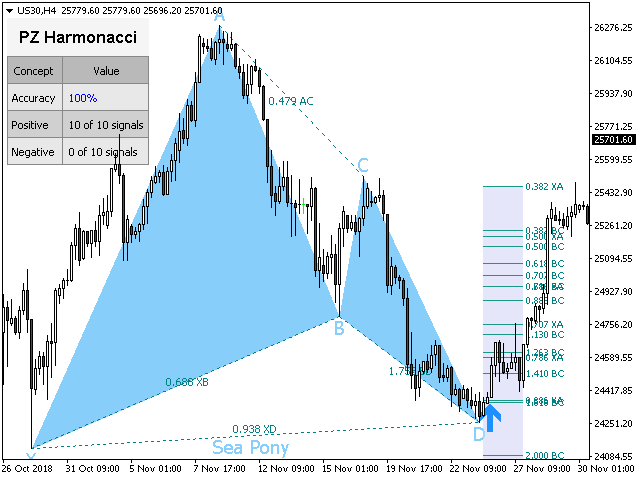
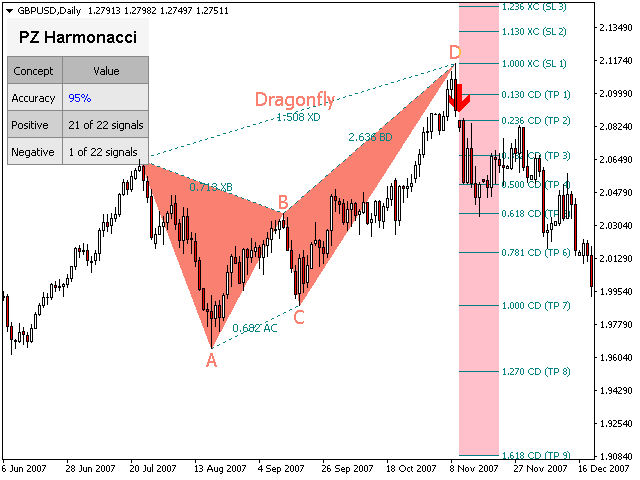
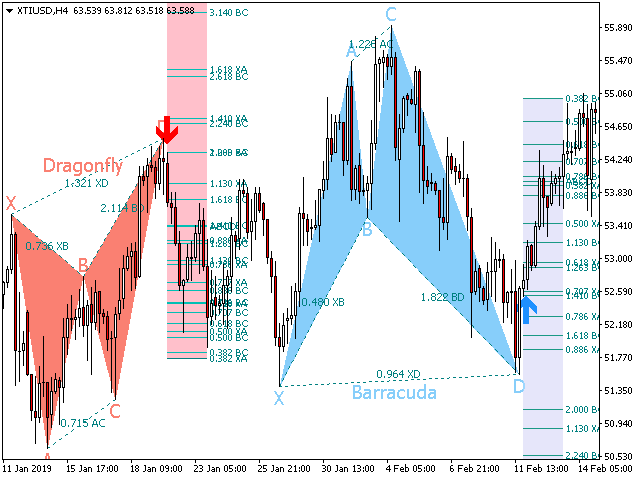
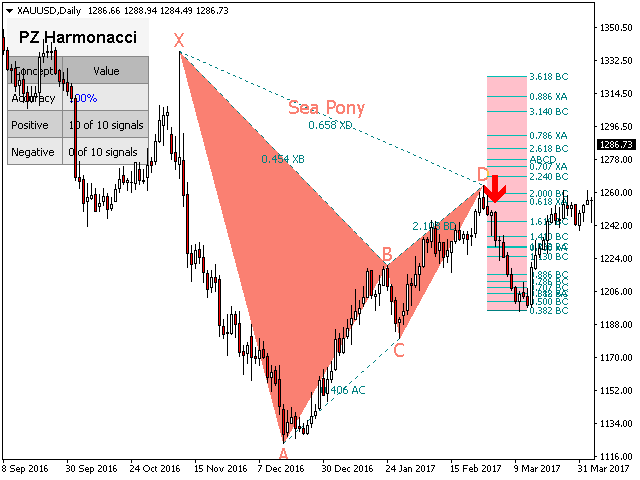
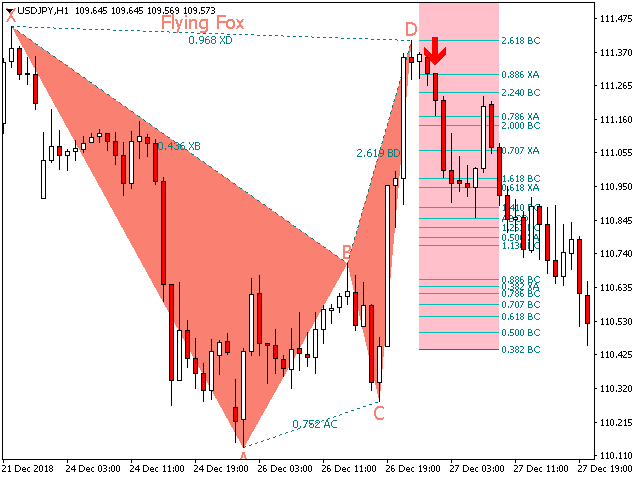
Dies ist wahrscheinlich der vollständigste Indikator für die automatische Erkennung der harmonischen Preisbildung, den Sie für die MetaTrader-Plattform finden können. Es erkennt 19 verschiedene Muster, nimmt Fibonacci-Projektionen genauso ernst wie Sie, zeigt die potenzielle Umkehrzone (PRZ) an und findet geeignete Stop-Loss- und Take-Profit-Werte.
[ Installationsanleitung | Update-Anleitung | Fehlerbehebung | FAQ | Alle Produkte ]
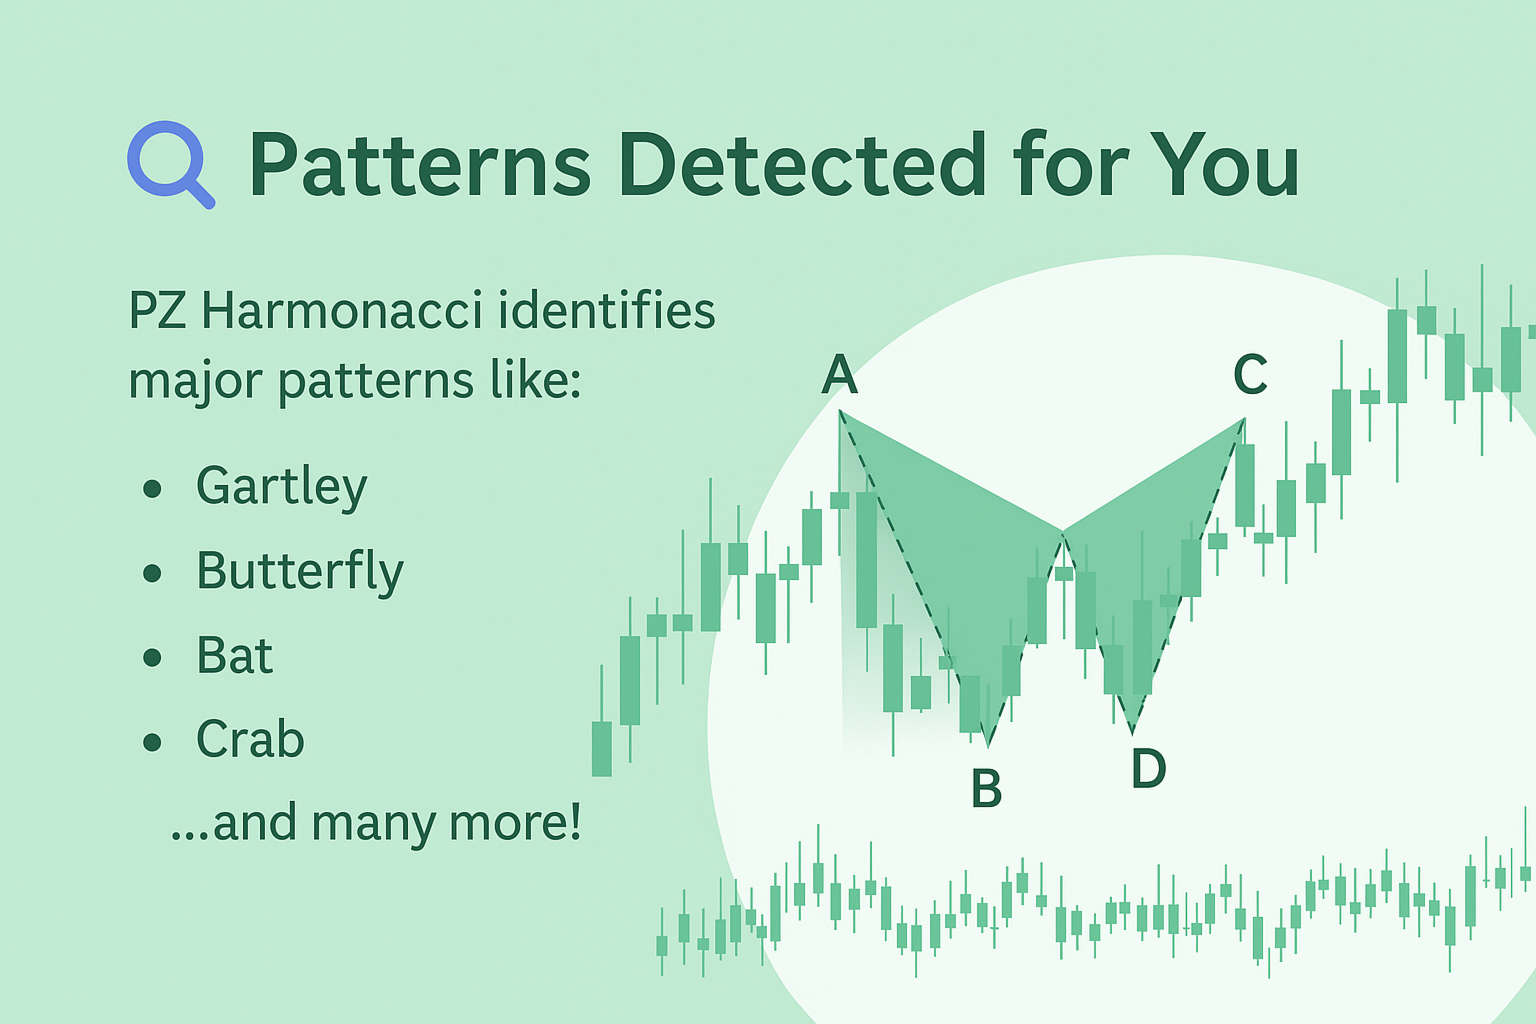
- Es erkennt 19 verschiedene harmonische Preisbildungen
- Dargestellt werden primäre, abgeleitete und komplementäre Fibonacci-Projektionen (PRZ)
- Es wertet vergangene Kursbewegungen aus und zeigt jedes vergangene Muster an
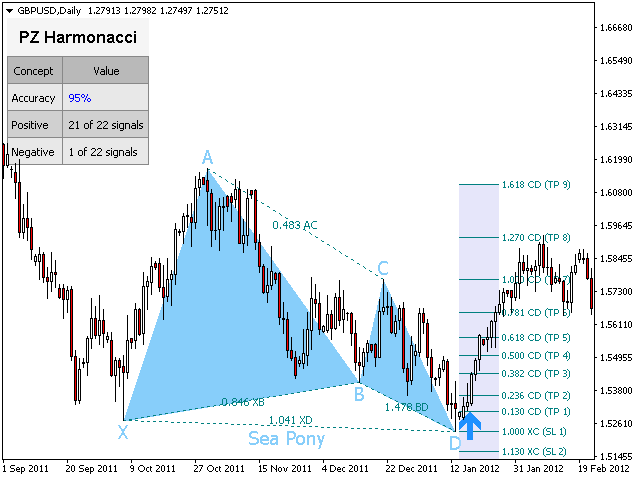
- Der Indikator analysiert seine eigene Qualität und Leistung
- Es zeigt geeignete Stop-Loss- und Take-Profit-Werte an
- Es verwendet Ausbrüche, um geeignete Trades zu signalisieren
- Es werden alle Musterverhältnisse in der Grafik dargestellt
- Es implementiert E-Mail / Sound / visuelle Warnungen
Inspiriert von Scott M. Carneys Buch, wurde dieser Indikator entwickelt, um die Bedürfnisse der puristischsten und anspruchsvollsten Händler zu erfüllen. Es implementiert jedoch eine Wendung, um den Handel zu vereinfachen: Es wartet auf einen Ausbruch der Donchianer in die richtige Richtung, bevor es den Handel signalisiert, was seine Signale sehr zuverlässig macht.
Unterstützte harmonische Preisbildungen
| Name | Min XB | Max XB | Min AC | Max AC | Min DB | Max BD | Min XD | Max XD |
|---|---|---|---|---|---|---|---|---|
| Fliegender Fuchs | 0,382 | 0,5 | 0,382 | 0,886 | 1,618 | 2,618 | 0,886 | 0,886 |
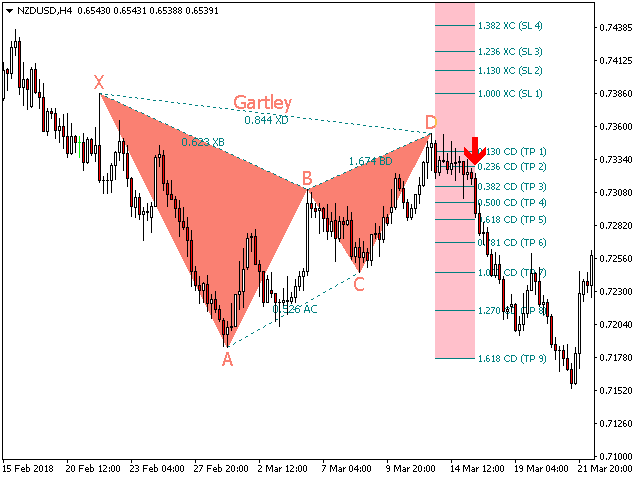
| Gartley | 0,618 | 0,618 | 0,382 | 0,886 | 1,272 | 1,618 | 0,786 | 0,786 |
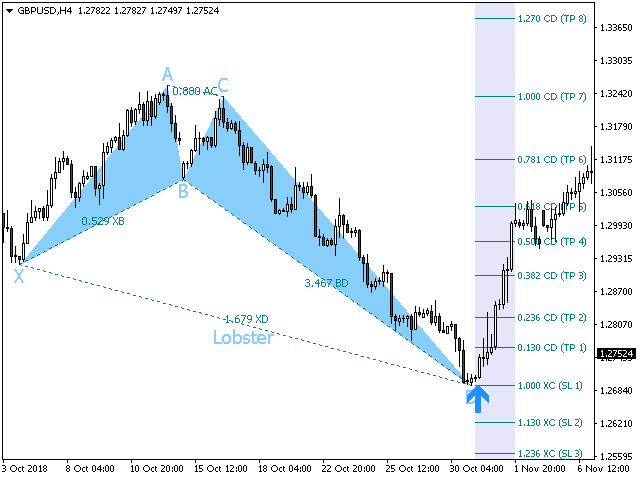
| Hummer | 0,382 | 0,618 | 0,382 | 0,886 | 2.24 | 3,618 | 1,618 | 1,618 |
| Libelle | 0,718 | 0,718 | 0,382 | 0,886 | 1,618 | 2,618 | 1,272 | 1,618 |
| Chiffre | 0,382 | 0,618 | 1.13 | 1,414 | 1,272 | 2,0 | 0,786 | 0,786 |
| Barrakuda | - | - | 1.13 | 1,618 | 1,618 | 2.24 | 0,886 | 1.13 |
| Alt Flughund | 0,382 | 0,382 | 0,382 | 0,886 | 2,0 | 3,618 | 1.13 | 1.13 |
| Tiefer Hummer | 0,886 | 0,886 | 0,382 | 0,886 | 2,618 | 3,618 | 1,618 | 1,618 |
| weißer Schwan | 1,382 | 2,618 | 0,236 | 0,5 | 1,128 | 2,0 | 1,126 | 2,618 |
| Schwarzer Schwan | 0,382 | 0,724 | 2,0 | 4,237 | 0,5 | 0,886 | 0,382 | 0,886 |
| Max Bat | 0,382 | 0,618 | 0,382 | 0,886 | 1,272 | 2,618 | 0,886 | 0,886 |
| Max Gartley | 0,382 | 0,618 | 0,382 | 0,886 | 1,128 | 2,236 | 0,618 | 0,786 |
| Max Libelle | 0,618 | 0,886 | 0,382 | 0,886 | 1,272 | 2,618 | 1,272 | 1,618 |
| Alt Barracuda | 0,446 | 0,618 | 0,618 | 0,886 | 1,618 | 2,618 | 1,128 | 1,128 |
| Ein Hummer | 0,276 | 0,446 | 1,128 | 2,618 | 1,618 | 2,618 | 0,618 | 0,618 |
| Eine Libelle | 0,382 | 0,618 | 1,128 | 2,618 | 1,272 | 1,272 | 0,618 | 0,786 |
| Ein Flughund | 0,382 | 0,618 | 1,128 | 2,618 | 2 | 2,618 | 1,128 | 1,128 |
| Ein Gartley | 0,618 | 0,786 | 1,128 | 2,618 | 1,618 | 1,618 | 1,272 | 1,272 |
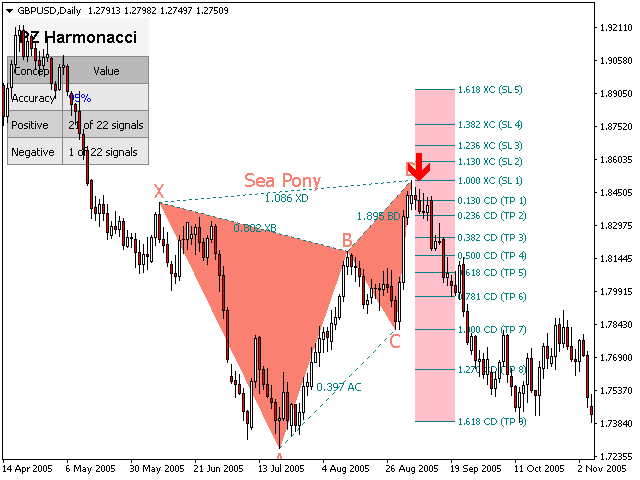
| Seepony | 0,128 | 3,618 | 0,382 | 0,5 | 1,618 | 2,618 | 0,618 | 3,618 |
Eingabeparameter
- Amplitude - Dieser Parameter steuert die Größe der Muster im Diagramm.
- Abweichung - Algorithmischer Spielraum für die Mustererkennung. Erhöhen Sie den Wert, um weitere Muster zu finden.
- Breakout-Periode - Donchianische Breakout-Periode für die Handelssignale.
- Max. Verlaufsleisten - Anzahl der Verlaufsleisten, die ausgewertet werden sollen, wenn der Indikator geladen wird.
- Anzeigestatistik - Aktiviert oder deaktiviert die Bildschirmstatistik für die Leistung.
- Anzeigepunkte - Preispunktbeschriftungen anzeigen (Beschriftungen X, A, B, C, D).
- Anzeigeverhältnisse - Zeigt Musterverhältnisse an.
- Projektionen anzeigen - Anzeige der potenziellen Umkehrzone (PRZ)
- SL / TP-Level anzeigen - Anzeige geeigneter Stop-Loss- und Take-Profit-Levels.
- Mustereinstellungen - Wählen Sie aus, nach welchen Mustern gescannt werden soll: Deaktivieren Sie alle nicht verwendeten Muster.
- Zeichnungseinstellungen - Konfigurieren Sie die Farben von bullischen und bärischen Mustern sowie die Schriftgrößen.
- Verhältnisse - Aktivieren oder deaktivieren Sie die Verhältnisse und wählen Sie Ihre eigenen Verhältnisfarben.
- Projektionen - Zeigen Sie die Fibonacci-Projektionen auf dem Diagramm an oder blenden Sie sie aus.
- Ausbrüche - Aktivieren oder deaktivieren Sie Ausbrüche und stellen Sie die gewünschten Pfeilgrößen und -farben ein.
- Warnungen - Aktivieren Sie Anzeige- / E-Mail- / Push- / Tonwarnungen für Ausbrüche, Muster oder beides.
Autor
Arturo López Pérez, privater Investor und Spekulant, Softwareentwickler und Gründer von PZ Trading .


I just bought this indicator last night, harmonics looks very promising. I put two trades in and checked them the morning after, won both by 40 pips. I will be writing a review further on detailing my progress, I know 299 credits is a lot to spend for people but so far so good.