Technische Indikatoren für den MetaTrader 4 - 4

Multi Anchor VWAP Pro MT4 - Rein verankerter VWAP | Adaptive σ-Bänder | Smart Alerts Präzise VWAP-Verankerung, speziell für MetaTrader 4 entwickelt. Ein-Klick-Anker, dynamische σ-Bänder oder %-Bänder und sofortige Multi-Channel-Warnungen - ideal für Scalper, Intraday- und Swing-Trader, die ein institutionelles Fair-Value-Mapping benötigen. Öffentlicher Kanal: HIER KLICKEN
Vollständiges Benutzerhandbuch - Brauchen Sie MT5? Klicken Sie hier WARUM SICH PROFESSIONELLE HÄNDLER FÜR MULTI ANCHOR VWAP
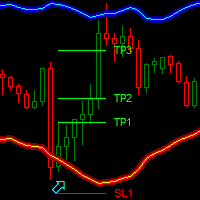
Dark Bands ist ein Indikator für den Intraday-Handel. Dieser Indikator basiert auf der Counter Trend Strategie, nutzt aber auch die Volatilität. Mit diesem Indikator können wir bei guten Preisen einsteigen, um die Umkehrungen des aktuellen Instruments zu verfolgen.
Wichtigste Vorteile
Leicht sichtbare Take-Profit/Stop-Loss-Linien Zuverlässige Bandlinien mit futuristischen Farben und intuitiven Richtungspfeilen Nützliche Statistiken , die die Gewinnrate der Signale anzeigen Plus-Paket verfügb
FREE

Apollo Secret Trend ist ein professioneller Trendindikator, der verwendet werden kann, um Trends für jedes Paar und jeden Zeitrahmen zu finden. Der Indikator kann leicht zu Ihrem primären Handelsindikator werden, mit dem Sie Markttrends erkennen können, unabhängig davon, welches Paar oder welchen Zeitrahmen Sie bevorzugen. Durch die Verwendung eines speziellen Parameters im Indikator können Sie die Signale an Ihren persönlichen Handelsstil anpassen. Der Indikator bietet alle Arten von Warnungen,

Slayer Binary ist ein binärer Options-Ein-Kerzen-Strike-Pfeilindikator. Dieser Indikator ist nicht für diejenigen, die den Heiligen Gral suchen, da es ein unrealistischer Ansatz für den Handel im Allgemeinen ist. Der Indikator zeigt eine stabile Trefferquote an, und wenn er mit Geldmanagement und einem Tagesziel verwendet wird, ist er noch zuverlässiger. Der Indikator enthält viele Funktionen, die unten aufgeführt sind:
FEATURES KEIN UMLACKIEREN: Der Indikator lackiert seine Pfeile nicht live

Keltner-Kanal-Indikator Der Keltner-Kanal ist ein Oszillator wie die Bollinger-Bänder.
Der Keltner-Kanal ist ein sehr gutes Werkzeug, um den Einstieg in Ihre Strategie zu timen.
Der Keltner-Kanal zeigt einen Kanal an, in dem der Preis verbleiben sollte, solange wir uns nicht in einer überkauften oder überverkauften Situation befinden.
Verschiedene Strategien verwenden den Keltner-Kanal-Indikator erfolgreich, um überkaufte/überverkaufte Situationen zu erkennen und nach Umkehrungen zu suchen.
Der
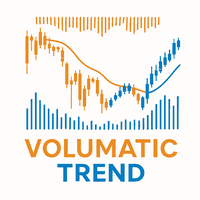
Volumatic Trend ist ein leistungsfähiger, trendfolgender Indikator, der Richtungsanalysen mit Echtzeit-Volumenverhalten verbindet. Durch die Kombination von adaptiver Trendlogik und Volumen-Overlays bietet er Händlern eine detaillierte Momentaufnahme der Marktüberzeugung und potenzieller Wendepunkte. Von der sofortigen Erkennung von Trendwechseln bis hin zu volumengewichteten Kerzendarstellungen bietet dieses Tool einen tieferen Kontext für die Preisbewegung. MT5-Version - https://www.mql5.com/e
FREE
Riesiger 70% Halloween Sale nur für 24 Stunden!
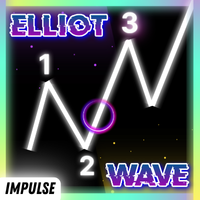
Anleitung: Hier klicken Dieser Indikator ist nicht zu stoppen, wenn er mit unserem anderen Indikator namens Katana kombiniert wird. Schicken Sie uns nach dem Kauf eine Nachricht und Sie könnten ihn GRATIS als BONUS erhalten ! Der Elliot-Wellen-Impuls ist ein Muster , das in der Elliott-Wellen-Theorie identifiziert wurde, einer Form der technischen Analyse, die zur Analyse von Finanzmarktzyklen verwendet wird. Die Impulswelle gilt als der stärkst

Signale zum Ein- und Ausstieg aus Trades für Währungen, Gold, Öl, Krypto – alles in MT4 ohne Neuzeichnen und mit Trendprognose. Sogar ein Anfänger kann problemlos in jedem Zeitrahmen handeln. Flexibler und genauer Algorithmus zur automatischen Abstimmung von Signalen, die auf dem Bildschirm angezeigt, auf Englisch gehört und auf einem Smartphone empfangen werden können.
Der Indikator verfügt über ein System von Hinweisen zur Schulung des Benutzers. Bewegen Sie den Mauszeiger über ein beliebi

Gold Buster M1 System ist ein professionelles Handelssystem für M1-Charts auf dem XAUUSD-Paar. Aber trotz der Tatsache, dass das System ursprünglich ausschließlich für den Handel mit Gold entwickelt wurde, kann das System auch mit einigen anderen Währungspaaren verwendet werden. Nach dem Kauf gebe ich Ihnen eine Liste von Handelspaaren, die zusätzlich zu XAUUSD mit dem System verwendet werden können, was Ihre Möglichkeiten zur Verwendung dieses Systems erweitert. ALLE ANZEIGEN IM SYSTEM WIEDERHO

Das Forex Breath System ist ein trendbasiertes Handelssystem, das auf jedem Markt eingesetzt werden kann. Sie können dieses System mit Währungen, Metallen, Rohstoffen, Indizes, Krypto und sogar Aktien verwenden. Es kann auch mit jedem Zeitrahmen verwendet werden. Das System ist universell. Es zeigt den Trend an und liefert Pfeilsignale mit dem Trend. Der Indikator kann Ihnen auch eine spezielle Art von Warnungen liefern, wenn die Signale in Trendrichtung erscheinen, was den Trendhandel zu einer

Hydra Trend Rider ist ein nicht nachzeichnender Trendindikator für mehrere Zeitrahmen, der präzise Kauf-/Verkaufssignale und Echtzeitwarnungen für Handels-Setups mit hoher Wahrscheinlichkeit liefert. Mit seiner farbkodierten Trendlinie, dem anpassbaren Dashboard und den mobilen Benachrichtigungen ist er perfekt für Händler, die Klarheit, Vertrauen und Konsistenz im Trendhandel suchen. Einrichtung & Anleitung: MT5-Version hier herunterladen . Um zu lernen, wie man den Indikator benutzt: Indikator

BEHOLD!!!
Einer der besten Breakout-Indikatoren aller Zeiten ist da. Multi Breakout Pattern betrachtet die vorangegangenen Kerzen und Zeitrahmen, um Ihnen zu helfen, die Ausbrüche in Echtzeit zu erkennen.
Die eingebaute Funktion von Angebot und Nachfrage kann Ihnen helfen, Ihre Take-Profits und Stop-Losses zu bewerten
SIEHEN SIE DIE SCREENSHOTS, UM EINIGE DER BESTEN BREAKOUTS ZU ERLEBEN
INPUTS
MaxBarsback: Die maximale Anzahl der Bars, die zurückgeblickt werden
Slow length 1: Period lookba

Fortgeschrittener SMC-Indikator MT4 - Smart Money Concepts Analyse-Tool Professioneller Smart Money Concepts Indikator für MT4 zur Erkennung von Order Blocks, FVG, BOS, CHOCH, Liquidität, Swing Points. Echtzeit-Dashboard, anpassbare Farben, Alarme. Vollständiges institutionelles Analysetool für MetaTrader 4. FORTGESCHRITTENER SMC-INDIKATOR MT4 - SMART MONEY CONCEPTS
FX Dynamic: Volatilität und Trends mit anpassbarer ATR-Analyse im Blick Übersicht
FX Dynamic ist ein leistungsstarkes Tool, das die Berechnungen des Average True Range (ATR) nutzt, um Tradern unübertroffene Einblicke in die tägliche und intraday-Volatilität zu geben. Durch das Festlegen klarer Volatilitätsschwellen — beispielsweise 80%, 100% und 130% — kannst du schnell potenzielle Gewinnchancen erkennen oder Warnungen erhalten, wenn der Markt seine üblichen Spannen überschreitet. FX Dynamic p

PPR und Engulfing ist ein einzigartiger technischer Indikator, der entwickelt wurde, um die "PPR"- und "Engulfing"-Muster in den Währungscharts der Handelsplattform MetaTrader 4 (MT4) zu identifizieren. Diese Muster können mögliche Trendwenden oder -fortsetzungen anzeigen und bieten den Händlern wertvolle Signale für den Markt. Hauptmerkmale: Automatische Mustererkennung : Der Indikator erkennt und markiert automatisch die PPR- und Engulfing-Muster mit Pfeilen im Chart. Visuelle Signale : Grüne
FREE

Dieser Indikator identifiziert die beliebtesten Harmonic Patterns , die Marktumkehrpunkte vorhersagen. Diese harmonischen Muster sind Kursformationen, die sich auf dem Devisenmarkt ständig wiederholen und auf mögliche zukünftige Kursbewegungen hindeuten / Free MT5 Version
Darüber hinaus verfügt dieser Indikator über ein eingebautes Markteintrittssignal sowie über verschiedene Gewinnmitnahmen und Stop-Losses. Es ist zu beachten, dass der Harmonische Muster-Indikator zwar eigenständig Kauf-/Verk
FREE

Wir stellen Ihnen den F-16 Plane Indicator vor, ein hochmodernes MT4-Tool, das Ihr Trading-Erlebnis revolutionieren wird. Inspiriert von der unvergleichlichen Geschwindigkeit und Präzision des F-16-Kampfflugzeugs kombiniert dieser Indikator fortschrittliche Algorithmen und modernste Technologie, um eine beispiellose Leistung auf den Finanzmärkten zu bieten. Mit dem F-16 Plane Indicator schweben Sie über der Konkurrenz, da er Echtzeit-Analysen liefert und äußerst präzise Trading-Signale generiert

Der Indikator zeigt das horizontale Volumenprofil im angegebenen Bereich (BOX) und das maximale Volumen (POC) an.
Produktmerkmale. 1. Sie können Ticks oder nur den Preis verwenden. 2. Adaptiver Rasterabstand (M1-MN). 3. Adaptiver Suchschritt für hohes Volumen (Median) abhängig von der Boxgröße. 4. Automatische Chamäleonfarbe für Rahmenlinien und Schaltflächen. 5. Mehrere Boxen, einfach zu erstellen und zu löschen. 6. 70 % Volumenbereich (in den Einstellungen aktivieren). 7. Es gibt eine Warnung

Die bahnbrechende Lösung für Trend Trading und Filtering mit allen wichtigen Funktionen in einem einzigen Tool! Der intelligente Algorithmus von Trend PRO erkennt den Trend, filtert Marktgeräusche heraus und gibt Einstiegssignale mit Ausstiegslevels. Die neuen Funktionen mit verbesserten Regeln für die statistische Berechnung haben die Gesamtleistung dieses Indikators verbessert.
Wichtige Informationen aufgedeckt Um das Potenzial von Trend Pro zu maximieren, besuchen Sie bitte www.mql5.com/en

VeMAs ist ein innovatives Handelsinstrument, das Ihre Handelsstrategie durch die Analyse der Volumendynamik und der Marktstruktur verbessert. Ob Sie Anfänger oder erfahrener Trader sind, VeMAs verschafft Ihnen einen Vorteil. Der VeMAs -Indikator ist für nur $50 erhältlich. Der ursprüngliche Preis des Indikators beträgt $299
ZEITLICH BEGRENZTES ANGEBOT. Version MT5
Here are some blogs on the VeMAs indicator
Das Marktvolumen und die Marktstruktur sind einige der wenigen wichtigen Dinge, die man
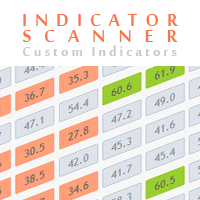
Advanced Indicator Scanner ist ein Multi-Symbol-Multi-Timeframe-Scanner, der mit Hunderten von benutzerdefinierten Indikatoren arbeitet, die im Internet verfügbar sind, einschließlich mql5-Website-Markt- und Codebase-Indikatoren.
Advanced Indicator Scanner Funktionen:
Scannt Ihren Indikator in 28 anpassbaren Instrumenten und 9 Timeframes. Überwacht bis zu 2 Zeilen (Puffer) eines Indikators. Anzeige des Indikatorwertes auf Schaltflächen. Sie können zwischen 3 Alarmmodi wählen: Einzelnes Symbol

Crystal Smart Volume Übersicht Crystal Smart Volume für MT4 ist ein fortschrittlicher Indikator für Volumen- und Delta-Analyse, der entwickelt wurde, um die verborgene Aktivität institutioneller Händler hinter gewöhnlichen Kursbewegungen sichtbar zu machen.
Er kombiniert Smart Money Concepts (SMC) , Volume Spread Analysis (VSA) und Delta-Logik , um sowohl das Preis- als auch das Volumenverhalten zu analysieren.
Der Indikator erkennt Ereignisse wie Buying Climax (Kaufklimax) , Selling Climax (Ver
FREE

Der ultimative Marktscanner. Kein Repaint. Keine Verzögerung. Forex + Krypto Hybrid Modus. Die meisten Währungsstärkemesser sind hässlich, frieren Ihr Terminal ein und zeigen ihre Historie neu an. Vantage FX Matrix ändert das Spiel. Es ist ein Dashboard der nächsten Generation, das für professionelle Trader entwickelt wurde, die Klarheit, Geschwindigkeit und Genauigkeit benötigen. Es kombiniert eine klassische Korrelationsmatrix für 8 Hauptwährungen mit einer benutzerdefinierten Watchlist für W

Trend Reversal Zone and Alert Multi-Timeframe Supply & Demand Zonen + Präzise Trendwendesignale Trend Reversal Zone and Alert ist ein professioneller, nicht nachzeichnender (Non-Repainting) Marktstruktur-Indikator, entwickelt für Trader, die hochwahrscheinliche Trendwenden an institutionellen Schlüsselbereichen erkennen möchten. Der Indikator kombiniert intelligent Supply- und Demand-Zonen auf höheren Zeitrahmen (H4 & D1) mit präzisen Ablehnungssignalen an Tageshochs und -tiefs , sodass exakte

RSI Divergence Full +10 andere Divergenz-Indikatoren
Kontaktieren Sie mich nach der Bezahlung , damit ich Ihnen das Benutzerhandbuch als PDF-Datei zusenden kann. Die MT5 Version können Sie hier herunterladen. Sie können auch den >>> Hybrid Trading EA <<< herunterladen, der auf Basis des RSI Divergence Indikators entwickelt und implementiert wurde . Der RSI ist an sich schon ein sehr nützlicher Indikator, aber er ist noch effektiver, wenn man mit ihm Divergenzmuster handelt. Denn das Divergenzsi

Horizont ist ein Handelssystem, das ein vollständiges Trading-Setup bereitstellt: Einstiegspunkt, Ziel 1, Ziel 2 und Stop-Loss – alles wird automatisch berechnet. Das System erkennt automatisch Markthochs und -tiefs und verbindet sie, um den aktuellen Trend zu definieren. Sie wählen, welchen Trend Sie handeln möchten, und Horizont erzeugt die entsprechenden Einstiegs-, Ziel- und Stop-Level. Das System beinhaltet ein automatisches Risikomanagement. Es prüft Ihren Kontostand, berechnet das Risiko
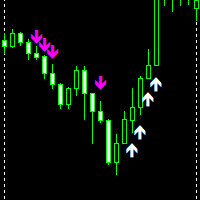
Up down Non-repaint ist ein MT4-Indikator, der genaue Signale gibt, ohne zu verschwinden. Der magentafarbene/rosa Pfeil ist Ihr Verkaufssignal. Der weiße Pfeil ist Ihr Kaufsignal. Der Indikator funktioniert auf allen Paaren und Zeitrahmen von 1 Minute bis zum monatlichen Zeitrahmen. Der Indikator ist für Scalping gedacht, halten Sie Ihre Trades nicht zu lange. Sobald die Pfeile in die gleiche Richtung zeigen, können Sie weitere Einträge hinzufügen. Alles Gute!!!
FREE
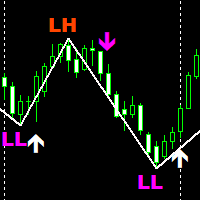
SMC Traders ist ein nicht-malerischer Indikator, der auf Price Action basiert. Der Indikator nutzt die aktuelle Marktstruktur, um zukünftige Umkehrungen vorherzusagen. Der Indikator kann mit unserem kostenlosen Marktstruktur Zickzack verwendet werden, den Sie hier finden: https: // www.mql5.com/en/market/product/91579 Bitte beachten Sie, dass Sie den HH- und HL-LINK ÜBER DEN LINK OBEN finden Timeframes: 15 Minuten für Scalping 1 Stunde für Swing Trading Lila Pfeil sucht nach Verkäufen in Verbind
FREE
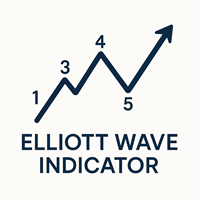
Elliott-Wellen-Theorie-Indikator für Meta Trader 4 Der Elliott-Wellen-Theorie-Indikator wurde basierend auf einem der professionellen Forex-Konzepte entwickelt. Dieser Indikator kann die Marktstruktur als Wellen darstellen und Spitzen als Aufwärts- und Abwärtswellen von 1 bis 5 zählen. Dadurch kann der Nutzer die Elliott-Wellen erkennen und bei neuen Nummerierungen Benachrichtigungen erhalten. Der Indikator enthält zwei Wellentypen: Hauptwelle und Nebenwelle, die jeweils in unterschiedlichen Far
FREE

Oder M Oving A verage S upport R eständigkeit Bands.
Der MASR-Bänder-Indikator ist ein gleitender Durchschnitt, der von zwei Bändern umgeben ist, die als Unterstützungs- und Widerstandsniveaus zusammenarbeiten. Statistisch enthalten MASR-Bänder in 93% der Fälle Preiskerzen. So wird es in Schritten berechnet: 1. Der erste Schritt besteht darin, das höchste Hoch (HHV) und das niedrigste Tief (LLV) für einen Zeitraum von X zu berechnen.
2. Der zweite Schritt besteht darin, HHV durch LLV zu teil

EINFÜHRUNGSANGEBOT: 65% RABATT! Aktueller Preis: $30 (Nächste Woche wird der Preis $69 sein). Greifen Sie jetzt zu, bevor der Preis wieder steigt.
HÖR AUF ZU ZOCKEN. BEGINNEN SIE ZU RECHNEN.
Sind Sie müde von unübersichtlichen Charts, Indikatoren, die sich wiederholen, und falschen Signalen, die Sie in Seitwärtsmärkten feststecken lassen? Andy Universal Sniper Pro ist nicht der übliche "magische" Indikator. Es ist ein komplettes algorithmisches Handelssystem , das für manuelles Scalping
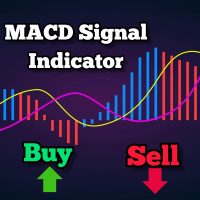
Dies ist ein Trendfolgeindikator basierend auf MACD, der Kaufsignale liefert, wenn über dem 200 MA und Verkaufssignale, wenn darunter. Das Signal wird generiert, wenn der MACD die Nulllinie kreuzt. Der Indikator zeigt auch ein Support- und Resistance-Level an, das als Stop-Loss verwendet werden kann. Einstellbare Parameter umfassen MA-Periode, MACD Fast EMA, Slow EMA und das Support-Resistance-Intervall. Es wird auf den niedrigsten und höchsten Punkten der aktuellen Kerzen dargestellt. Standardm
FREE

Der Indikator findet die Niveaus des maximalen und minimalen Preisvolumens (Marktprofil) auf dem Arbeitsbalkendiagramm für die angegebene Anzahl von Balken. Verbundprofil. Die Höhe des Histogramms ist vollautomatisch und passt sich an jedes Werkzeug und jeden Zeitrahmen an. Der Algorithmus des Autors wird verwendet und wiederholt bekannte Analoga nicht. Die Höhe der beiden Histogramme ist ungefähr gleich der durchschnittlichen Höhe der Kerze. Smart Alert (Smart alert) hilft Ihnen, den Preis i

Crypto_Forex Indikator SCALPING SNIPER PRO für MT4, Handelssystem ohne Repainting. Scalping Sniper Pro – ein fortschrittliches System (Indikator) zur präzisen Anzeige des Kursmomentums!
– Verbessern Sie Ihre Handelsmethoden mit dem professionellen Scalping Sniper Pro Indikator für MT4. PC and Mobile alerts. – Dieses System liefert sehr präzise, aber seltene Signale mit einer Gewinnrate von bis zu 90 %. – Das System sucht nach Signalen mithilfe vieler Paare, um eine geringe Anzahl von Signal
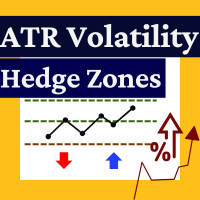
Dieser Indikator warnt den Nutzer, wenn der ATR einen benutzerdefinierten Wert überschreitet oder prozentuale Schwankungen aufweist, und erkennt so Volatilitätsspitzen. Besonders geeignet für: Volatilitätsbasierte Handelssysteme, Recovery Zone oder Grid Hedge Systeme. Da Volatilität für diese Systeme entscheidend ist, zeichnet der Indikator direkt auf dem Chart:
Einstiegszonen
Nachkaufpunkte
Take-Profit-Levels
Schnelles Backtesting und Parameteroptimierung werden so ermöglicht. Hauptvorteile
Vol

Der Crypto_Forex-Indikator „Auto FIBO Pro“ ist ein großartiges Hilfsmittel beim Handel!
- Der Indikator berechnet automatisch Fibo-Level und lokale Trendlinien (rote Farbe) und platziert sie im Diagramm. - Fibonacci-Level zeigen Schlüsselbereiche an, in denen der Preis umkehren kann. - Die wichtigsten Level sind 23,6 %, 38,2 %, 50 % und 61,8 %. - Sie können ihn für Reversal Scalping oder für Zone Grid Trading verwenden. - Es gibt auch viele Möglichkeiten, Ihr aktuelles System mit dem Auto FIBO

Unser Indikator Basic Candlestick Patterns macht das Erkennen der wichtigsten Candlestick-Muster so einfach wie nie zuvor. Entdecken Sie Muster wie den Hammer, den Abendstern, die drei weißen Soldaten und viele mehr mit einem Blick auf Ihren Chart. Mit einer intuitiven Benutzeroberfläche und klaren visuellen Hinweisen hilft Ihnen unser Indikator, Handelsmöglichkeiten schnell und präzise zu erkennen / MT5-Version
Dashboard Scanner für diesen Indikator: ( Basic Candlestick Patterns Dashboard )
FREE

Special offer : ALL TOOLS , just $35 each! New tools will be $30 for the first week or the first 3 purchases ! Trading Tools Channel on MQL5 : Join my MQL5 channel to update the latest news from me Der Supertrend Fakeout -Indikator ist eine verbesserte Version des klassischen Supertrend -Indikators, der entwickelt wurde, um zuverlässigere Trendsignale zu liefern. Durch die Integration fortschrittlicher Funktionen wie Fakeout Index Limit und Fakeout ATR Mult hilft dieser Indikator,
FREE

Version 1.6 ! Volume Strength 28 ist besser, einfacher zu bedienen und genialer! Basierend auf den Beschwerden, die wir aus den Rezensionen erhalten haben, haben wir verstanden, dass viele nicht wissen, wie sie die Zeitrahmen-Einstellung im Eingabemenü wirklich nutzen können und sich daher über die Volatilität beschweren, daher haben wir ein automatisches Zeitrahmen-Auswahlsystem entwickelt, das für unerfahrene Händler geeignet ist. Aufgrund der Beschwerden über die hohe Volatilität, die wir er

Indikator zur Bestimmung von Flat und Trend. Wenn der Preis unter einem der beiden Histogramme und zwei Linien (rot und blau) liegt, ist dies eine Verkaufszone. Beim Kauf dieser Version des Indikators, MT4-Version für ein echtes und ein Demo-Konto - als Geschenk (zum Erhalten, schreiben Sie mir eine private Nachricht)! Wenn der Preis über einem der beiden Histogramme und zwei Linien (rot und blau) liegt, ist dies eine Kaufzone. MT4-Version: https://www.mql5.com/en/market/product/3793 Wenn der

Entdecken Sie das Geheimnis des erfolgreichen Forex -Handels mit unserem benutzerdefinierten MT4 -Indikator!
Strategy with RangeBars https://youtu.be/jBaDCAPTtHc
Haben Sie sich jemals gefragt, wie Sie Erfolg auf dem Forex -Markt erzielen können und gleichzeitig Gewinne erzielen und gleichzeitig das Risiko minimieren können? Hier ist die Antwort, nach der Sie gesucht haben! Erlauben Sie uns, unseren proprietären MT4 -Indikator vorzustellen, der Ihren Handelsansatz revolutionieren wird.
Einzigart
Pipfinite entwickelt einzigartige, qualitativ hochwertige und erschwingliche Trading-Tools. Unsere Tools können für Sie funktionieren oder auch nicht, daher empfehlen wir Ihnen dringend, zuerst die Demo-Version für MT4 auszuprobieren. Bitte testen Sie den Indikator vor dem Kauf, um festzustellen, ob er für Sie funktioniert. Wir wollen Ihre guten Bewertungen, also beeilen Sie sich und testen Sie ihn kostenlos...wir hoffen, dass Sie ihn nützlich finden.
Achtung Dieses Trading-Tool wurde speziell

Impulse Zone Hunter – Präzisions-Trading-Tool Impulse Zone Hunter ist ein leistungsstarker MT4-Indikator , der Tradern einen klaren visuellen Vorteil bei der Erkennung hochwahrscheinlicher Marktbewegungen verschafft. Der Fokus liegt auf Angebots- und Nachfragezonen , Orderblöcken sowie ChoCH (Change of Character) und liefert klare Signale direkt im Chart . Hauptfunktionen: Dual-Modus-Trading Anzeige wahlweise von Supply- & Demand-Zonen oder Orderblöcken mit ChoCH-Linien . Einfaches Umschalten de

Forex Market Profile (kurz FMP) Was das nicht ist:
FMP ist nicht die klassische buchstabencodierte TPO-Anzeige , zeigt nicht die Berechnung des gesamten Diagrammdatenprofils an und segmentiert das Diagramm nicht in Perioden und berechnet diese nicht.
Was es macht :
Am wichtigsten ist, dass der FMP-Indikator Daten verarbeitet, die sich zwischen dem linken Rand des benutzerdefinierten Spektrums und dem rechten Rand des benutzerdefinierten Spektrums befinden. Der Benutzer kann das Spektrum defi
FREE

Derzeit 40% reduziert!
Dieses Dashboard ist eine sehr leistungsfähige Software, die mit mehreren Symbolen und bis zu 9 Zeitrahmen arbeitet. Es basiert auf unserem Hauptindikator (Beste Bewertungen: Advanced Supply Demand ).
Das Dashboard gibt einen guten Überblick. Es zeigt: Gefilterte Angebots- und Nachfragewerte einschließlich der Zonenstärkebewertung, Pips-Abstände zu/und innerhalb von Zonen, Es hebt verschachtelte Zonen hervor, Es gibt 4 Arten von Alarmen für die gewählten Symbole in al
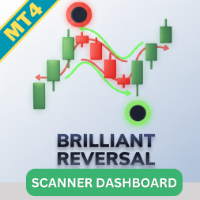
Der Brilliant Reversal Multicurrency Scanner MT4 ist ein leistungsstarkes Tool, das entwickelt wurde, um Tradern beim Überwachen mehrerer Währungspaare und Zeitrahmen mit dem Brilliant Reversal Indikator zu helfen. Dieser Scanner vereinfacht die Identifizierung potenzieller Marktumbrüche, indem er Echtzeit-Scans und Benachrichtigungen direkt von einem zentralen Dashboard bereitstellt. Egal, ob Sie mit Major-, Minor- oder exotischen Paaren handeln, dieses Tool bietet umfassende Marktüberwachung u

DTFX Algo Zones sind automatisch generierte Fibonacci-Retracements, die auf Marktstrukturverschiebungen basieren.
Diese Retracement-Levels sollen als Unterstützungs- und Widerstandslevels verwendet werden, an denen der Preis abprallen kann, um die Richtung zu bestätigen.
ANWENDUNG Abbildung 1 Da die Retracement-Levels nur aus identifizierten Marktstrukturverschiebungen generiert werden, sind die Retracements darauf beschränkt, nur aus Bereichen zu ziehen, die aufgrund des technischen Brea

Der vorgestellte Indikator analysiert die Richtung des kurzfristigen und langfristigen Trends für bestimmte Zeiträume, wobei die Volatilität des Marktes berücksichtigt wird. Dieser Ansatz ermöglicht es, eine hohe Empfindlichkeit des Indikators mit einer hohen Wahrscheinlichkeit der Ausführung seiner Signale zu kombinieren. Das Prinzip der Anwendung ist sehr einfach: das Histogramm des Indikators ist größer als 0 - ein Kaufsignal / das Histogramm des Indikators ist kleiner als 0 - ein Verkaufssig

Ein Trendindikator auf der Grundlage des Hull Moving Average (HMA) mit zwei Perioden. Der Hull Moving Average ist eine verbesserte Variante des gleitenden Durchschnitts, die den Zeitpunkt der Trendumkehr recht genau anzeigt. Er wird häufig als Signalfilter verwendet. Durch die Kombination von zwei Arten von gleitenden Hull-Durchschnitten können diese Vorteile besser genutzt werden: Der HMA mit einer langsamen Periode identifiziert den Trend, während der HMA mit einer schnellen Periode die kurzfr
FREE
Dieser Indikator analysiert parallel Kurs-Charts für mehrere Währungspaare auf allen Zeitskalen und benachrichtigt Sie, sobald ein Double Tops oder Double Bottoms Muster identifiziert wurde.
Definition Double Top / Double Bottom Muster Double Top ist ein Trendumkehrmuster, das aus zwei aufeinanderfolgenden Spitzenwerten besteht, die mehr oder weniger gleich sind, mit einem dazwischen liegenden Tiefpunkt. Dieses Muster ist eine klare Illustration eines Kampfes zwischen Käufern und Verkäufern. Di

Swing Trading ist der erste Indikator, der Schwankungen in Trendrichtung und mögliche Umkehrschwankungen erkennt. Es wird der in der Handelsliteratur weit verbreitete Baseline-Swing-Trading-Ansatz verwendet. Der Indikator untersucht mehrere Preis- und Zeitvektoren, um die aggregierte Trendrichtung zu verfolgen und erkennt Situationen, in denen der Markt überverkauft oder überkauft ist und zur Korrektur bereit ist. [ Installationsanleitung | Update-Anleitung | Fehlerbehebung | FAQ | Alle Produkte

Williams Precision Prime – Die Evolution der Legende Williams Precision Prime ist ein hochpräziser Trendfolge-Indikator, der die bewährte Handelslogik von Larry Williams mit modernster algorithmischer Filterung und dem exklusiven Peak Precision Design kombiniert. Dieser Indikator wurde für Trader entwickelt, die Wert auf Klarheit, Stabilität und mathematisch fundierte Einstiege legen. Durch die Kombination von drei dynamischen gleitenden Durchschnittsebenen (EMA 100, 50 & 21) identifiziert das S
FREE
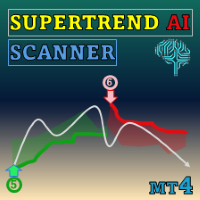
Special offer : ALL TOOLS , just $35 each! New tools will be $30 for the first week or the first 3 purchases ! Trading Tools Channel on MQL5 : Join my MQL5 channel to update the latest news from me Entdecken Sie die Kraft der KI mit dem SuperTrend AI Clustering mit Scanner , einem revolutionären Handelstool für MetaTrader4 (MT4). Dieser Indikator definiert die Marktanalyse neu, indem er K-Means-Clusterbildung mit dem weit verbreiteten SuperTrend-Indikator kombiniert und Händlern ei

Beschreibung (MT4)
Dieser Indikator erkennt Reentry-Momente des Preises, nachdem eine Kerze außerhalb der Bollinger-Bänder gedrungen ist, und kombiniert dieses Signal optional mit einer RSI-Bestätigung, um Fehlalarme zu reduzieren.
Ein Buy ReEntry -Signal wird erzeugt, wenn der Preis unter das untere Band gefallen und dann wieder innerhalb zurückgekehrt ist, idealerweise bestätigt durch einen RSI, der gerade aus einer überverkauften Bedingung herausgekommen ist.
Ein Sell ReEntry -Signal entsteh
FREE

Maximiere dein trendbasiertes Trading mit H4 & M30 Turning Point PRO! Sag dem Raten und unübersichtlichen Charts Lebewohl. Dieser Premium-Indikator kombiniert die Trend-Erkennung höherer Zeitrahmen mit präzisen kurzfristigen Wendepunkt-Signalen und bietet dir kristallklare Kauf- und Verkaufschancen. Warum Trader ihn lieben: H4 EMA200 Trend-Bias: Erkenne den dominanten Trend auf einen Blick. Handle nur in Trendrichtung. M30 Ausführungs-Pfeile: Warte auf hochwahrscheinliche Wendepunkte, bestätigt

Apollo Pips ist ein hochpräziser Trendumkehrindikator für den Handel mit beliebigen Währungspaaren. Er wurde ursprünglich für den Handel mit XAUUSD entwickelt, aber die Praxis hat gezeigt, dass der Indikator erfolgreich für andere Paare verwendet werden kann. Empfohlener Zeitraum H1. Der Indikator gibt nur dann einen Alarm aus, wenn das Signal bestätigt wird. Wenn Sie also eine Warnung gesehen haben, können Sie das empfangene Signal sicher verwenden. Der Indikator zeichnet seine Signale NICHT NE

Der Indikator Market Sessions ist bei Devisen- und Aktienhändlern ein beliebtes Instrument zur visuellen Darstellung globaler Handelssitzungen in einem Kursdiagramm. Er hebt die Zeiträume für die wichtigsten Handelssitzungen - wie die asiatische (Tokio) , europäische (London) und amerikanische (New York) Sitzung - direkt im Diagramm hervor. Dies hilft Händlern zu erkennen, wann die Märkte öffnen und schließen, und ermöglicht eine bessere Entscheidungsfindung auf der Grundlage des sitzungsspezifi
FREE

Titel: SMC-Struktur für EURUSD Beschreibung: Dieser Indikator dient der Abbildung von Marktstrukturen auf Basis von Smart Money Concepts (SMC). Er identifiziert Swing Structure, Internal Structure, Order Blocks und Fair Value Gaps (FVG). Das Tool ist auf Leistung optimiert, um Ressourcen auf der MetaTrader-Plattform effizient zu verwalten. Hauptmerkmale: 1. Marktstruktur-Mapping Identifiziert Major Swing Structure mit BOS (Break of Structure) und CHoCH (Change of Character). Zeigt die interne S
FREE
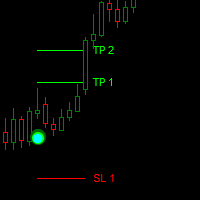
Dark Point ist ein Indikator für den Intraday-Handel. Dieser Indikator basiert auf einer Trendfolgestrategie , die auch die Verwendung des atr zur Bestimmung der richtigen Volatilität vorsieht. Mit diesem Indikator können wir bei guten Preisen einsteigen, um dem starken Trend des aktuellen Instruments zu folgen. If you love Dark Point, consider adding some power: Dark Power
Wichtigste Vorteile
Leicht sichtbare Gewinnmitnahme-/Stop-Loss-Linien Intuitive Richtungspunkte/Pfeile durch Farben Nützli
FREE

Suchen Sie nach einem leistungsstarken und dennoch leichten Swing-Detektor, der Wendepunkte in der Marktstruktur genau identifiziert?
Sie wollen klare, zuverlässige Kauf- und Verkaufssignale, die in jedem Zeitrahmen und für jedes Instrument funktionieren?
Buy Sell Arrow MT Swing ist genau dafür entwickelt worden - präzise Swing-Erkennung einfach und effektiv gemacht. Dieser Indikator identifiziert höhere Hochs (HH) , höhere Tiefs (HL) , niedrigere Hochs (LH) und niedrigere Tiefs (LL) mit bemerk

Wir stellen Ihnen unseren aufregenden neuen Price Retest-Indikator vor! Erhalten Sie sofortige Warnungen, wenn der Kurs einen Retest durchführt, und verschaffen Sie sich so einen entscheidenden Vorteil in Ihrer Handelsstrategie. Denken Sie daran, Ihre eigene Analyse durchzuführen, bevor Sie irgendwelche Bewegungen auf dem Markt machen. MT5-Version - https://www.mql5.com/en/market/product/118159/ Melden Sie sich an, um Markttiefe zu lernen - h ttps:// www.mql5.com/en/channels/suvashishfx
Hier f
FREE
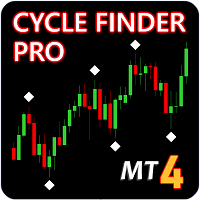
Update - Version 4.0 enthält jetzt ein Trendwechsel-Signal. Der Indikator zeigt Ihnen den aktuellen Trend auf allen Charts an. Update - Version 5.0 enthält jetzt Alarme für mt4, Push- und E-Mail-Benachrichtigungen.
Cycle Finder Pro ist ein Indikator zum Lesen von Charts und wurde für Trend- und Muster-Trader entwickelt. Das Lesen von Charts ist zeitaufwendig und komplex und erfordert Kenntnisse über Preisbewegungen , Zyklizität und die Korrelation von Zeitrahmen . Cycle Finder Pro fasst all die

Special offer : ALL TOOLS , just $35 each! New tools will be $30 for the first week or the first 3 purchases ! Trading Tools Channel on MQL5 : Join my MQL5 channel to update the latest news from me Entfesseln Sie die Kraft des Inversion Fair Value Gap (IFVG) -Konzepts von ICT mit dem Inversion Fair Value Gaps Indicator ! Dieses hochmoderne Tool hebt Fair Value Gaps (FVGs) auf die nächste Ebene, indem es umgekehrte FVG-Zonen identifiziert und anzeigt – wichtige Unterstützungs- und W
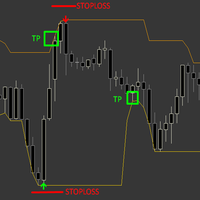
Der Sure Reverse Channel ist ein dynamischer Trendindikator ohne Wiederholung mit Einstiegspfeilen. Der Indikator konzentriert sich auf das Erkennen von Umkehrschwüngen auf dem Markt, indem er die Kanal- und Preisaktionsformel verwendet, der Indikator verfügt über ein eingebautes Geldmanagement. WIE GEHANDELT WIRD : Eröffnen Sie einen Kaufhandel, wenn der Kaufpfeil auftaucht, und setzen Sie Ihren SL unter den Pfeil, für den TP haben Sie einen TP, der dem Band gegenüber liegt. Eröffnen Sie einen
FREE
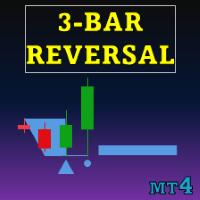
Special offer : ALL TOOLS , just $35 each! New tools will be $30 for the first week or the first 3 purchases ! Trading Tools Channel on MQL5 : Join my MQL5 channel to update the latest news from me Das Drei-Balken-Umkehrmuster-Indikator bietet ein leistungsstarkes Tool für Trader, das automatisch Drei-Balken-Umkehrmuster direkt im Preisdiagramm identifiziert und hervorhebt. Dieser Indikator ist eine wertvolle Ressource zur Erkennung potenzieller Trendumkehrungen und ermöglicht es N

Noch 2 Exemplare zu 65 $, nächster Preis 120 $
Scalper System ist ein benutzerfreundlicher Indikator, der Marktkonsolidierungszonen erkennt und Ausbruchsbewegungen vorwegnimmt. Er ist für den M1- oder M15-Zeitrahmen optimiert und eignet sich am besten für sehr volatile Werte wie Gold (XAUUSD). Obwohl dieses System ursprünglich für den M1- oder M15-Zeitrahmen entwickelt wurde, funktioniert es dank seiner robusten, preisaktionsbasierten Strategie in allen Zeitrahmen gut.
Sie können den Indikator

Das einzige 100% universelle Werkzeug! Hören Sie auf, gegen die Natur zu handeln! Dies ist Ihre Chance, sich den einzigen Indikator zu sichern, der auf den absoluten Gesetzen beruht, die das gesamte Universum regieren. Die meisten Werkzeuge raten - dieses enthüllt die Wahrheit. Kaufen Sie ein anderes Spielzeug oder kaufen Sie die Wahrheit. Sie haben die Wahl...
Basierend auf universellen Gesetzen - NICHT auf dem Algorithmus irgendeines Typen: Lassen Sie den Markt sich an die verborgene Geometr

Der Basic Renko-Indikator ist ein leistungsstarkes Werkzeug für Händler, die eine klare und präzise Marktperspektive suchen. Unser Indikator vereinfacht nicht nur die Visualisierung von Trends, sondern bietet auch genaue Warnungen für Umkehrungen, die Ihnen einen strategischen Vorteil bei Ihrem Handel verschaffen / Kostenlose MT5-Version
Merkmale Vollständig anpassbar: Passen Sie den Indikator mit fortschrittlichen Anpassungsoptionen an Ihre Geschäftsvorlieben an. Von den Farben bis hin zu de
FREE
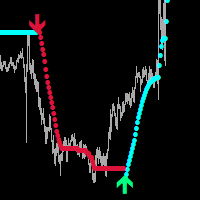
Globale Parabolika MT4
Indikator für Scalping auf M1-M5.
Ein sehr guter Indikator für Ihr Handelssystem, er kann als eigenständiges System verwendet werden.
Handelssystem verwendet werden, ich empfehle die Verwendung zusammen mit - System Trend Pro Der Indikator wird nicht neu gezeichnet und ändert seine Daten nicht.
Einstellungen:
Ändern Sie den FILTER-Parameter für genaue Markteintritte.
Haben Sie Fragen? Brauchen Sie Hilfe?, Ich bin immer glücklich zu helfen, schreiben Sie mir in private
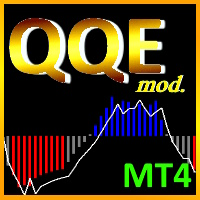
Der Indikator Quantitative Qualitative Estimation ( QQE) ist von Wilders berühmtem Relative Strength Index (RSI) abgeleitet. Im Wesentlichen ist der QQE ein stark geglätteter RSI.
Modifikation dieser Version: ( konvertiert von tradingview script von Mihkell00, Original von Glaz, 100% identische Ausgabe)
Es gibt also zwei QQEs. Eine, die auf dem Chart als Säulen angezeigt wird, und die andere "versteckt" im Hintergrund, die auch ein 50 MA-Bollingerband hat , das als Nulllinie fungiert.
Wenn b
MetaTrader Market bietet jedem Entwickler eine einfache und bequeme Plattform für den Verkauf von Programmen.
Wir unterstützen Sie bei der Veröffentlichung des Produkts und beraten Sie gerne, wie man eine Beschreibung für den Market vorbereitet. Alle Produkte, die im Market verkauft werden, sind durch eine zusätzliche Verschlüsselung geschützt und können nur auf dem Rechner des Kunden gestartet werden. Illegales Kopieren ist ausgeschlossen.
Sie verpassen Handelsmöglichkeiten:
- Freie Handelsapplikationen
- Über 8.000 Signale zum Kopieren
- Wirtschaftsnachrichten für die Lage an den Finanzmärkte
Registrierung
Einloggen
Wenn Sie kein Benutzerkonto haben, registrieren Sie sich
Erlauben Sie die Verwendung von Cookies, um sich auf der Website MQL5.com anzumelden.
Bitte aktivieren Sie die notwendige Einstellung in Ihrem Browser, da Sie sich sonst nicht einloggen können.