Technische Indikatoren für den MetaTrader 4 - 43

Nicht jeder kann einen Indikator schreiben. Aber jeder kann eine Idee haben. Der Indikator Universal Main Window Free , der als Eingabeparameter die Formel benötigt, nach der die Indikatorlinie gezeichnet werden soll, wird Ihnen bei der Umsetzung helfen. Dieser Indikator ist für die Verwendung im Hauptfenster des Charts vorgesehen.
Alle Indikatoren der Serie Universal :
Hauptfenster Separates Fenster Kostenlos MT4 Universal Hauptfenster Frei MT5 Universelles Hauptfenster Free MT5 MT4 Universal
FREE
MAs COMBO – Entdecken Sie einen einfachen, aber leistungsstarken Indikator für gleitende Durchschnitte in MT4!
Dieser benutzerdefinierte Indikator basiert auf einer intelligenten Kombination einfacher gleitender Durchschnitte – ideal, um mit minimalem Aufwand Trading-Setups mit hoher Erfolgswahrscheinlichkeit zu identifizieren.
Selbst Trading-Neulinge erkennen dank der einfachen Logik dieses Indikators schnell klare und profitable Handelssignale. Die Mustererkennung ist so intuitiv, dass sowo
FREE

Dieser Indikator mildert den Wert des RSI (Relative Strength Index) ab und reduziert seine Volatilität. Sie können diesen Indikator in Ihren Expert Advisors, Indikatoren und Strategien verwenden. Mit diesem Indikator müssen Sie nicht zwei Indikatoren gleichzeitig auf dem Chart haben. Zum Beispiel einen RSI-Indikator und einen Indikator für den gleitenden Durchschnitt. Wenn Sie Fragen oder Bedenken haben, kontaktieren Sie mich.
FREE
Der Pappye-Indikator verwendet das Bolinger-Band, um sein Signal auszulösen, und enthält eine Pappye-Animation für die Warnung vor Handelssignalen. dieser Alarm ist nicht fortlaufend für den gleichen Pfeil, sondern wird nur 2 mal abgespielt und kann für jedes Paar und jeden Zeitrahmen verwendet werden Ich persönlich ziehe es vor, einen Handel zu eröffnen, wenn sich der Pfeil nach einem Kursausbruch auf horizontaler Ebene befindet. aber Sie können Ihren Weg wählen, nachdem Sie die Demokopie auf I
FREE

RSI-Scanner, mehrere Symbole und Zeitrahmen, grafische Benutzeroberfläche Ein Indikator, der mehrere von der Marktbeobachtung hinzugefügte Symbole und Zeitrahmen scannt und das Ergebnis in einem grafischen Panel anzeigt. Merkmale: Mehrere Symbole Mehrere Zeitrahmen Alarme und Benachrichtigungen Live-Überwachung Sortier-Modi Ein Klick zum Wechseln von Symbol und Zeitrahmen Eingaben für RSI und Scanner-Einstellungen
FREE
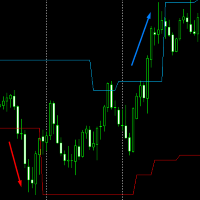
Volatility Channel von JagzFX hilft Ihnen, Ausbrüche zu finden , indem ein Kanal auf dem Preisdiagramm angezeigt wird. Volatility Channel ist einfach zu bedienen - es gibt keine Parameter - und funktioniert auf jedem Zeitrahmen. GRUNDLEGENDE VERWENDUNG von Volatilitätskanälen Der Kanal kann als "No Trade Zone" verwendet werden: Sie handeln nicht, wenn sich der Kurs innerhalb des Kanals befindet. Allerdings:
Wenn der Kurs über den Kanal ausbricht: Gehen Sie Long. Wenn der Kurs unter den Kanal bri
FREE

Geglätteter DeMarker-Oszillator (xDeM) Indikator
Eingabeparameter: Periode - Mittelungszeitraum Arbeitsweise
Der Indikator berechnet den technischen Standardindikator DeMarker Oscillator neu (mittelt die erhaltenen Werte zweimal). Die Mittelungsperiode des Indikators entspricht der doppelten Periode des Standard DeMarker Oscillators . Zum Beispiel : xDeM mit Mittelungsperiode 7 entspricht DeM mit Periode 14. Der Indikatorpuffer wird nicht neu gezeichnet.
FREE

ReviewCandleChart ist ein einzigartiges Produkt, das vergangene Kursschwankungen anhand von Candlestick-Charts nachweisen kann. Dieser Indikator reproduziert genau die Marktpreisschwankungen in der Vergangenheit und kann Handelsentscheidungen (Einstiege, Gewinne, Verlustschnitte) viele Male treffen, so dass Sie den Handel schneller lernen können. ReviewCandleCahrt ist der beste Indikator zur Verbesserung der Handelsfähigkeiten. ReviewCandleCahrt richtet sich sowohl an Anfänger als auch an fortge
FREE

Denken umfasst einen Fluss von Ideen und Assoziationen , der zu logischen Schlussfolgerungen führen kann. Obwohl Denken eine Tätigkeit von existenziellem Wert für den Menschen ist, besteht noch immer kein Konsens darüber, wie es angemessen definiert oder verstanden wird. Das Denken ermöglicht es dem Menschen, die Welt, die er erlebt, zu verstehen, zu interpretieren, darzustellen oder zu modellieren und Vorhersagen über diese Welt zu treffen. Es ist daher für einen Organismus mit Bedürfnissen, Zi
FREE

Mein Konto Maklerdetails Dieser Indikator zeigt die Kontodaten und die Bedingungen des Brokers in Bezug auf seinen Betrieb an. Zum Beispiel den Namen des Brokers, die Kontonummer, den finanziellen Hebel, die Kontowährung, die automatische Handelsgenehmigung, das minimale Lot, den Lotschritt, die maximale Anzahl der Lots, den Margin Call, den Stop Out und viele andere wichtige Daten. Es ist einfacher, solche Daten mit einem Mausklick auf dem Chart anzuzeigen, als sie im Vertrag zu suchen oder den
FREE

Der Kerzengrößen-Oszillator ist ein einfach zu bedienendes Werkzeug, um die Kerzengröße vom höchsten bis zum niedrigsten Preis jeder Kerze zu ermitteln. Es ist ein leistungsstarkes Tool für Preisaktionsanalysten, insbesondere für diejenigen, die mit Intraday-Charts arbeiten, und auch ein perfektes Tool für kurzfristige Swing-Trader. Bitte beachten Sie, dass Sie die Bullish- und Bearish-Kerzen auch mit verschiedenen Farben bearbeiten können.
#Tags: Kerzengröße, Oszillator, Preisaktion, Preisspann
FREE
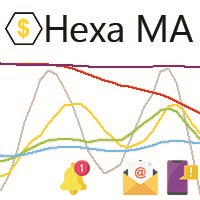
"Der Trend ist dein Freund, bis zum Ende, wenn er sich biegt". Der benutzerdefinierte Indikator "Hexa MA" ist ein Trendfolgeindikator. Er verwendet 6 gleitende Durchschnitte, um den Trend zu erkennen und ihm zu folgen, und auch um die schlechten Signale für die schnellen gleitenden Durchschnitte zu filtern. Das Grundprinzip ist einfach, die Strategie jedoch sehr wirkungsvoll.
Empfohlene Einstellungen für den Indikator: - Gleitende Durchschnittsperioden: SMA 5, SMA 10, SMA 20, SMA 50, SMA 100, S
FREE
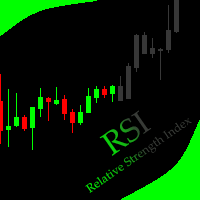
Dieser Indikator ermöglicht es, den RSI (auf allen MT4-Zeitfenstern) ab einem vom Benutzer definierten Datum mit einer vertikalen Linie (Alone) oder einem Panel (mit dem Dienstprogramm "Hidden Candles") auszublenden. Eingaben des Indikators: Zeitraum Anwenden auf Informationen zum Indikator "Relative Strength Index" finden Sie hier: https: //www.metatrader4.com/en/trading-platform/help/analytics/tech_indicators/relative_strength_index *************************************************************
FREE

Heutiges Hoch und Tief
Dieser Indikator zeichnet Linien am höchsten Preis des Tages und am niedrigsten Preis des Tages. Beide Linien werden mit Etiketten abgeschlossen, auf denen der Höchst- und der Tiefstkurs angegeben sind. Linien und Beschriftungen werden entsprechend dem Chartverlauf in Echtzeit verschoben. Der Indikator funktioniert in allen Zeitintervallen des Charts. Sie können die Farben ändern und einstellen und das Diagramm verschieben. Der Indikator ermöglicht es Ihnen, die Kursbewe
FREE
Dynamic Trading Dashboard für MT4 Dieses leistungsstarke MT4-Handels-Dashboard bietet Händlern einen umfassenden Überblick über die aktuelle und historische Handelsperformance in einem intuitiven und visuell organisierten Format. Mit seinem präzisen Design bietet das Dashboard eine nahtlose Mischung aus Echtzeit-Einblicken und historischen Analysen. Das Dashboard eignet sich perfekt für sorgfältige Händler, die ein präzises, umfassendes Tool suchen, um offene und geschlossene Positionen zu verwa
FREE

OCTO TACK TREND INDICATOR
Zusammenfassung/Beschreibung: Trendindikator, der Signale für die Ausführung von Aufträgen zu Gunsten des aktuellen Trends anzeigt Machen Sie sich bereit für den besten Trendindikator, den Sie je ausprobiert haben. Er wird garantiert nicht nachgemalt. Er generiert klare Signale und immer zu Gunsten des Trends (siehe Screenshots) Sie müssen nur auf den Alarm warten, um ihn anzuzeigen und Pip zu verdienen Haben Sie genug von Indikatoren, die nie funktionieren? Hier habe
FREE

Höchst-, Tiefst-, Eröffnungs- und Schlusskurse - ist das nicht zu viel? Manchmal braucht man eine eindeutige Preisentwicklung. Aber wenn man sich für eine Sache entscheidet, geht der Rest verloren. Die Glättung führt auch zu Datenverlusten. Oft geht eines der wichtigsten Marktdetails verloren: Informationen über Extremwerte. Um die Informationen über die Höchst- und Tiefststände zu erhalten, ist die richtige "Glättung" für die Preisentwicklung ein Zickzackkurs. Aber Zickzacks haben auch Nachteil
FREE

Einfacher Indikator, der externe (äußere) Balken anzeigt. In bestimmten Fällen können externe Balken als starke Trendbalken anstelle von Range-Balken gesehen werden. Dies kann beobachtet werden, wenn ein externer Balken mit Trend bei einer Umkehrung eines starken Trends auftritt. Es wird Ihnen helfen, verschiedene Muster wie Innen-Außen-Innen, Innen-Innen-Innen, Außen-Innen-Außen usw. leichter zu erkennen. Funktioniert perfekt mit meinen anderen kostenlosen Indikatoren Internal bar und Shadows
FREE

Der Indikator berechnet den Winkel zwischen den Hochs, Tiefs und Schlusskursen benachbarter Bars. Der Winkel kann in Grad oder Radiant gemessen werden. Ein lineares Diagramm oder ein Histogramm wird in einem Unterfenster gezeichnet. Sie können die Skala für die Berechnung festlegen - gleitend oder fest. Für die Verwendung im EA müssen Sie eine feste Skala angeben.
Parameter Winkelmaß - Grad oder Bogenmaß. Maßstabsmodus für die Berechnung - Skalierungsmodus. Freier Maßstab - freie Transformation
FREE

Malteserkreuz GBP Ein universelles Werkzeug zur Erkennung von Trends, Flatness und zum Handel mit Chartmustern. Es kombiniert die Techniken von Gan, Elliott und Murray.
Platzieren Sie es einfach auf dem Chart und es zeigt Ihnen die Richtung und die Geschwindigkeit der Kursbewegung an und hebt Umkehrmomente hervor. Das Malteserkreuz wird Ihnen helfen, Knotenpunkte in der Geschichte genau zu identifizieren, Handelsaktionen zu planen und offene Trades zu begleiten. Diese kostenlose Demoversion von
FREE

Der FxSProWPR-Oszillator generiert Signale zur Trendbestätigung, die auch zur Bestätigung der Entstehung neuer Trends verwendet werden können.
Parameter des Indikators NumberBars - die Anzahl der Balken, die der Indikator anzeigen soll. Zu viele Balken können den Betrieb des Handelsterminals erheblich verlangsamen. SignalAlert - ein Alarm, der auf einen Trend hinweist. SignalSound - Tonalarm, der auf einen Trend hinweist. Der Ton wird abgespielt, sobald das Histogramm den Wert von 15 überschrei
FREE

Zeigt die Höchst- und Tiefststände der vergangenen Monate an. Sie können die Anzahl der Monate einstellen, für die die Niveaus angezeigt werden sollen, sowie den Linienstil, die Farbe und die Breite. Dies ist sehr nützlich für Trader, die den BTMM und andere Methoden wie ICT verwenden. Ich werde ähnliche Indikatoren für MT5 für den BTMM erstellen. Senden Sie mir Ihre Vorschläge an mein Telegram: https://t.me/JDelgadoCR Werfen Sie einen Blick auf meine anderen Produkte unter: https://www.mql5.
FREE

Risklimiter
Begrenzen Sie Ihr Risiko mit diesem dynamischen Stop-Loss-Indikator. Er zeigt Ihnen genau an, wo Sie Ihren ersten Stopp und die nachfolgenden Stopps platzieren sollten, wenn sich der Kurs zu Ihren Gunsten entwickelt. Funktioniert auf jedem Zeitrahmen und jedem Symbol. Er ist in keiner Weise eingeschränkt und muss nicht optimiert werden. Ziehen Sie es einfach auf ein Diagramm, um einen Stop-Loss anzuzeigen. Es kann vorkommen, dass es einen Stop Loss auf der anderen Seite Ihres Handel
FREE
Der Slope-Indikator ist ein MT4-Indikator, der die Neigung des Preises berechnet und ein Histogramm zeichnet, damit Sie sehen können, ob sie positiv, negativ oder schwankend ist.
Hauptmerkmale: Berechnet die Steigung des Liniendiagramms Zeigt die Zahlen als Histogramm unterhalb des Charts an Wählen Sie verschiedene Zeiträume für die Berechnung der Steigung. Sendet Warnungen und Push-Benachrichtigungen , wenn die Steigung ihre Richtung ändert Einstellungen:
CalculationPeriod: Die Anzahl der Balk
FREE
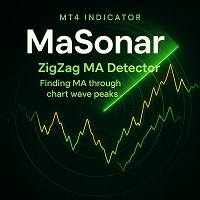
MaSonar ist ein leistungsstarker Indikator, der automatisch die relevanten gleitenden Durchschnitte (MA) erkennt und anzeigt, die mit den Spitzen eines ZigZag übereinstimmen. Er sucht schnell nach dem am besten geeigneten MA an jedem ZigZag-Peak und hilft Ihnen, den Markttrend und sein Momentum mit Leichtigkeit zu analysieren. Hauptmerkmale: ZigZag Peak Matching: Identifiziert und zeigt automatisch die MAs an, die mit den ZigZag Peaks übereinstimmen. Quick Button-Suche: Drücken Sie einfach eine
FREE

Panelux - Informationstafel mit wichtigen Informationen für den Händler, wie z. B.: Handelskontonummer und Leverage; Symbol, Zeitraum, letzter Preis, Zeit bis zum Schließen des Balkens und Spread; Ein separater Block für das Mani-Management; Instrumenten-Tauschdaten; Block mit Informationen über Einlage, Saldo, Gewinn, Positionen, Eigenkapital und Marge; Gewinn- und Verlustblock für das Jahr, das Quartal, den Monat, die Woche und für die letzten fünf Tage. Es besteht die Möglichkeit, die Anzeige
FREE

Rung Trendanzeige. Der Indikator identifiziert und markiert in verschiedenen Farben die Haupttrends der Preisbewegung, während er Rauschen und kurzfristige Preisbewegungen gegen den Haupttrend eliminiert und nicht darauf reagiert. Der Indikator ist ein Werkzeug, das den aktuellen Trend auf dem Markt bestimmt. Mit den Standardeinstellungen markiert der Indikator einen Aufwärtstrend ("bullish") mit einer grünen Linie, einen Abwärtstrend ("bearish") - mit einer roten Linie auf seitwärts gerichtet
FREE

CoralDash ist ein einfaches Symbol-Shortcut-Dashboard. Die Symbolliste hat viele Voreinstellungen zur Auswahl: Marktbeobachtung Offene Orders Aktueller Chart Majors Eine benutzerdefinierte Liste Wenn Sie auf das Symbol klicken, stehen Ihnen zwei Aktionen zur Verfügung Einstellen des aktuellen Chart-Symbols Die Liste der im Dashboard angezeigten Symbole nach einer Währung filtern (z. B. alle EUR-Paare anzeigen) Klicken Sie auf die Zelle "PAIR" in der Kopfzeile, um zwischen den beiden verfügbaren
FREE

Cross MA Optimiser - Feinabstimmung Ihrer gleitenden Durchschnittsstrategien in MT4! In der schnelllebigen Welt des Handels sind Kreuzungen gleitender Durchschnitte eine bewährte Methode zur Identifizierung von Trends und Einstiegspunkten. Die Verwendung der falschen Einstellungen kann jedoch zu verpassten Chancen und ineffizienten Strategien führen. Cross MA Optimiser nimmt Ihnen das Rätselraten bei der Optimierung gleitender Durchschnitte ab, indem es Ihre Crossover-Parameter automatisiert
FREE
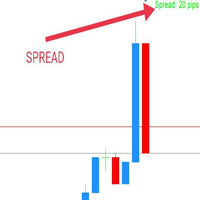
WaSpread MT4 Indicator zeigt den aktuellen Spread in Pips mit Farbe an.
* Stellen Sie den Spread Threshold und die Farbe ein, um zu erkennen, wann der aktuelle Spread unter oder über dem Spread Threshold liegt.
* Legen Sie die X- und Y-Achse fest und wählen Sie die Ecke und den Anker, um das Spread-Label auf dem Chart zu positionieren.
* Schreiben Sie die Schriftart und die Schriftgröße für mehr Komfort.
* Aktivieren Sie eine Warnung, wenn der aktuelle Spread über dem Spread-Schwellenwert l
FREE

***WICHTIG: Dieser kostenlose Indikator funktioniert mit dem kostenpflichtigen Strong Weak Forex Expert Advisor. Der EA hängt auch von den folgenden benutzerdefinierten Indikatoren ab: Starker Schwacher Heiken Ashi Stark Schwach Parabolisch Starke Schwache Symbole Starke Schwache Indikator Laden Sie sie kostenlos auf dem Markt herunter. Der EA wird ohne sie nicht funktionieren. Dies sind alles benutzerdefinierte Indikatoren, auf die sich der Strong Weak Forex Expert Advisor stützt, um Handelssig
FREE
"Visual Range - Spread Indikator". Dieser Indikator ist ein unverzichtbares Instrument für den manuellen Handel. Er hilft, "off price" und "schlechte" Einstiege zu vermeiden, die durch abnormal hohe Spreads verursacht werden. ...................................................................................................................... Bei der Markteröffnung und bei Nachrichtenmeldungen kann die Größe des Spreads vorübergehend sehr hoch werden. Der Indikator zeigt die aktuelle Größe des
FREE

Nützlicher Indikator, der drei gleitende Durchschnitte enthält, für Ihre bevorzugte Handelsstrategie. Die gleitenden Durchschnitte sind vollständig konfigurierbar: Zeitraum, Methode, Farbe, etc. Setzen Sie ihn einfach auf Ihren bevorzugten Zeitrahmen.
Die Vorteile, die Sie erhalten : Kein Redesign, kein Rückzug, keine Neuberechnung. Funktioniert auf Forex und CFD, Zeitrahmen von M1 bis Monthly. Einfach zu benutzen. Bequemlichkeit für Ihren Handel.
FREE

MQLTA Instrument Details zeigt Ihnen in einer einfach zu lesenden Tabelle die Details über das Instrument/Symbol, einschließlich: Bezeichnung Handelsmodus Standard-Kontraktgröße Minimale Größe Maximale Größe Größe Schritt Verwendete Ziffern Tick-Größe Tick-Wert Stop-Level Gebot Brief Spanne
Parameter Name des Indikators zur Erstellung der Objekte Standardfenster beim Öffnen des Indikators Horizontaler Versatz Vertikaler Versatz Wenn Ihnen dieses Tool gefällt, nehmen Sie sich bitte eine Minute Z
FREE

CUSTOM Währungsstärke-Indikator
WÄHLEN SIE IRGENDEINE WÄHRUNG, für die Sie die Stärke berechnen möchten . Der Indikator vergleicht automatisch alle Symbole/Paare von 8 ausgewählten Währungen auf der Grundlage von KU-Chart Berechnungen.
-8 Die wichtigsten Währungen werden standardmäßig verwendet
-Hinzufügen des Indikators zu einem beliebigen Diagramm
-Gemacht für 15min Zeitrahmen= letzte 1-Tages-Änderung berechnet, 30min = letzte 2 Tage und so weiter
-Klare Unterscheidung der Währungen durch Fa
FREE

Dies ist ein unverzichtbares Tool für jeden Trader, denn dieser Indikator versorgt das Scoreboard mit den wichtigsten Basisinformationen für den Handel. Er zeigt die aktuelle Serverzeit, die verbleibende Zeit des aktuellen Balkens, ein berechnetes Lot für das angegebene Risiko und die freie Marge, charakteristische Balkengrößen und Spreads an. Wenn der Indikator auf einem Chart platziert wird, erzeugt er ein Textlabel in der oberen rechten Ecke mit den folgenden Informationen: -17:50 [70%] 11:42
FREE
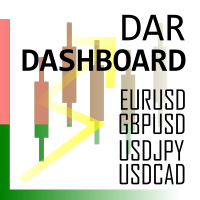
Daily Average Retracement Dashboard ist ein Indikator, mit dem Sie mehrere Währungspaare gleichzeitig überwachen können. Dieser Indikator ist vor allem für Strategien geeignet, die auf der Grundlage von 3/4-Widerstand oder 3/4-Unterstützung mit Preisrückführungen handeln. Nachdem Sie diesen Indikator auf das Chart-Fenster angewendet haben, blendet er das Chart aus und zeigt die Währungspaare in Tabellenform an. In der Tabelle werden verschiedene Daten angezeigt, die dem Händler dabei helfen, zu
FREE

Eigenschaft des vertikalen Kapitals Ausgabe: Gugol_Quants Über USA INDEXES QUANT_INDICATOR: Dies ist ein Indikator, der durch mathematische Modulation erstellt wurde, um als Handelswerkzeug verwendet zu werden, das in MQL entwickelt wurde. (MT4) Dieser Indikator ist nur für den Gebrauch mit US500(S&P500), NAS100(Nasdaq Composite) und US30(Dow Jones). Die Signale werden bei der "Open"-Kerze aktiviert. Es basiert auf Intraday/Swing Trades, deren Hauptzeitrahmen H1, H2, H3 und H4 ist. Sie können ih
FREE
Ein Indikator für die gleichzeitige Analyse verschiedener Währungspaare Der Devisenmarkt ist ein komplexer Markt, auf dem mehrere Währungspaare gleichzeitig analysiert werden müssen. Bestimmen Sie die Anzahl der Währungspaare selbst Bestimmen Sie das Währungspaar, das Sie analysieren möchten, um 4 der wichtigsten und ähnlichsten Währungspaare gleichzeitig zu analysieren. Für eine direkte und einfache Analyse haben sich einige Währungspaare geändert (EURUSD>>>USDEUR) Zweifeln Sie nicht daran, das
FREE
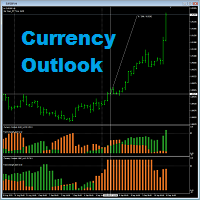
Currency Outlook ist ein Indikator, der uns helfen kann, "das richtige Paar in der richtigen Richtung und zum richtigen Zeitpunkt zu handeln". Dieser Indikator analysiert die Preise aller Cross-Währungspaare der ausgewählten Währung und meldet uns das Ergebnis in Form eines zweifarbigen Histogramms. Die maximale Höhe des Histogramms des Indikators beträgt 100. Der Indikator ist ausschließlich für AUD, CAD, CHF, EUR, GBP, JPY, NZD und USD programmiert. Der Indikator wurde um eine Funktion zur Ber
FREE

Einfach. Informativ. Sofort auf Ihrem Chart sichtbar. Alwinson Active Trades Info (MT4 Version) ist ein leichtgewichtiger, benutzerdefinierter Indikator, der eine Echtzeit-Zusammenfassung Ihrer aktuell offenen Trades anzeigt - direkt auf Ihrem Chart. Sie müssen nicht mehr zwischen verschiedenen Tabs wechseln, um zu sehen, welche Paare aktiv sind und wie viel Lotgröße im Spiel ist.
Alwinson Active Trades Info ist auch für die MetaTrader 5 (MT5) Version verfügbar (bitte schauen Sie sich meine and
FREE

VisualOrders und InfoAccount - ein Indikator zur Analyse des eigenen Handels oder zur Analyse des Kontos eines anderen.
Zusätzlich gibt es die Möglichkeit, schnell Informationen über das Konto und das Terminal zu erhalten. Die Informationen werden sowohl auf dem Chart als auch auf der Registerkarte Experten angezeigt.
Alle angezeigten Informationen sind in den Einstellungen deaktiviert, so dass der Händler nur die notwendigen Informationen anzeigen lassen kann.
FREE

Hier ist alles sehr einfach. Ich habe noch nie Indikatoren ohne externe Parameter verstanden. Und der Awesome Oscillator ist da keine Ausnahme. Jetzt können Sie diesen Indikator an Ihre Bedürfnisse und Strategien anpassen.
Referenz: Der Awesome Oscillator Indikator zeigt den Abstand in Punkten zwischen zwei gleitenden Durchschnitten (schnell und langsam) an.
Der AO_Robex Indikator hat in seinen Parametern eine Änderung der Periode der gleitenden Durchschnitte. Die Standardparameter sind die g
FREE

Der MAtrio-Indikator zeigt drei gleitende Durchschnitte auf einem beliebigen Zeitrahmen mit einer Periode von 50 Tagen, 100 Tagen und 200 Tagen gleichzeitig an. Nach dem Anhängen an den Chart zeigt er sofort drei gleitende Durchschnitte mit den Parametern einfacher (SMA) gleitender Durchschnitt SmoothingType50 , einfacher (SMA) gleitender Durchschnitt SmoothingType100 , einfacher (SMA) gleitender Durchschnitt SmoothingType200 an. Dementsprechend ist bei den Preistypen ValuePrices50, ValuePrices
FREE

Dieser Indikator ist ein Dienstprogramm, mit dem Sie immer unter Kontrolle haben, wie viel Zeit am Ende des eingestellten Balkens noch übrig ist.
Das Dienstprogramm zeigt unten rechts im Diagramm den Countdown bis zum Ende an.
Wenn die verbleibenden Sekunden = die in der Eingabe eingestellten Sekunden sind, ändert sich die Farbe der verbleibenden Sekunden im Diagramm und es ertönt ein Warnton, um Sie zu warnen, dass der Balken bald zu Ende ist. Wenn die verbleibenden Sekunden < den eingegeben
FREE

Der Spin ist eine intrinsische Form des Drehimpulses, den Elementarteilchen, zusammengesetzte Teilchen (Hadronen) und Atomkerne tragen.
Der Spin ist eine von zwei Arten von Drehimpulsen in der Quantenmechanik, die andere ist der Bahndrehimpuls (Orbitaldrehimpuls). Der Bahndrehimpuls-Operator ist das quantenmechanische Gegenstück zum klassischen Bahndrehimpuls und tritt auf, wenn seine Wellenfunktion eine periodische Struktur aufweist, während der Winkel variiert. Für Photonen ist der Spin das
FREE

Wir stellen Ihnen RSI Jurik vor - einen innovativen Indikator, der Ihre Forex-Handelsstrategie revolutioniert, indem er benutzerdefinierte gleitende Durchschnitte auf der Grundlage des Relative Strength Index (RSI) mit dem MetaTrader 4-Indikator RSI kombiniert.
Die gleitenden Durchschnitte von Jurik sind für ihre Genauigkeit und Zuverlässigkeit bei der Analyse von Kursbewegungen auf dem Devisenmarkt bekannt. Sie bieten Händlern eine glattere Darstellung des Kursgeschehens, reduzieren das Rausc
FREE

Dieser Indikator funktioniert auf diese Weise: Trader sollte die n Periode "Number of Candle" angeben (die Standardperiode ist 6) Dann wird der Indikator die Anzahl der Pips in der letzten n Periode (nicht die aktuelle Kerze) berechnen Und das wird auf dem Chart angezeigt Damit sollte der Händler seine Aufwärts- oder Abwärtstrendanalyse entsprechend der Anzahl der Pips in den letzten n Kerzen (bullish oder bearish), die er angegeben hat, bestätigen.
FREE

Der Indikator ermöglicht Ihnen den Handel mit binären Optionen. Der empfohlene Zeitrahmen ist М1 und die Verfallszeit ist 1 Minute. Der Indikator ist für den automatischen und manuellen Handel geeignet. Ein mögliches Signal wird als ein Pfeil über/unter einer Kerze angegeben. Sie sollten warten, bis die Kerze geschlossen ist! Die Pfeile werden nicht neu gezeichnet Handelssitzungen: LONDON und NEWYORK Abschnitt Währungspaare: GRB/USD Arbeits-Zeitrahmen: M1 Verfallszeit: 1 Minute. Der Indikator ze
FREE
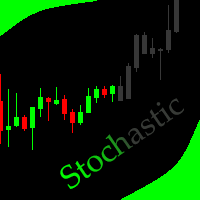
Dieser Indikator erlaubt es, den Stochastik-Oszillator (auf allen MT4-Zeitfenstern) ab einem vom Benutzer definierten Datum mit einer vertikalen Linie (Alone) oder einem Panel (mit "Hidden Candles") auszublenden. Indikator Eingaben: % K-Periode % D-Periode Verlangsamung Anwenden auf Methode Informationen zum Indikator "Stochastischer Oszillator" finden Sie hier: https: //www.metatrader4.com/en/trading-platform/help/analytics/tech_indicators/stochastic_oscillator *********************************
FREE
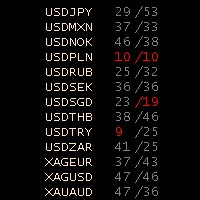
Stochastik-Oszillator-Panel Wir stellen Ihnen das Stochastik-Oszillator-Panel vor, eine umfassende Darstellung des Stochastik-Oszillators für alle Währungen (bis zu 75 Paare). Dieses leistungsstarke Tool arbeitet innerhalb des aktuellen Zeitrahmens, nutzt den einfachen gleitenden Durchschnitt und stützt sich auf die Tiefst-/Höchstkurse. Das Panel besteht aus drei Spalten: Name der Währung MODE_MAIN (Hauptlinie) MODE_SIGNAL (Signallinie) Das Stochastik-Oszillator-Panel bietet visuelle Anhaltspunk
FREE

Wir stellen Ihnen den Indikator "Symbol Cost Info MT4 " vor - Ihr ultimatives Werkzeug, um auf dem Devisenmarkt die Nase vorn zu haben! Dieser innovative Indikator wurde entwickelt, um Trader mit Echtzeit-Kosteninformationen direkt auf ihren Charts zu versorgen. Hier erfahren Sie, warum jeder Trader den "Symbol Cost Info MT4" in seinem Arsenal braucht: Spread-Überwachung in Echtzeit : Behalten Sie den Spread für jedes Währungspaar genau im Auge und stellen Sie sicher, dass Sie zum günstigsten Z
FREE

"Giant" ist ein flexibles System in Bezug auf Handelsstrategien. Es besteht aus zwei hochwertigen Indikatoren, die auf fünf verschiedenen Zeitrahmen desselben Währungspaares installiert sind (siehe Screenshot). Es überwacht den Trend und gibt Signale zum Öffnen. Das System hat eine Vielzahl von Prüfungen bestanden und eine hohe Genauigkeit gezeigt. Die Indikatoren werden separat verkauft. Das zweite Wort im Hauptnamen ist der Indikator selbst. In dieser Ausgabe wird der Indikator "Nicely" verkau
FREE

Preisänderungsindikator Einführung Der Preisveränderungsindikator ist ein leistungsfähiges Instrument, das Händlern hilft, signifikante Preisbewegungen über einen bestimmten Zeitraum zu erkennen. Durch die Berechnung und Visualisierung der prozentualen Veränderungen zwischen aktuellen und historischen Kursen können Händler schnell potenzielle Handelsmöglichkeiten erkennen, wenn Märkte eine ungewöhnliche Volatilität oder Dynamik aufweisen. Funktionen Echtzeit-Überwachung von Kursveränderungen Vis
FREE

Binary Options Assistant (BOA) ICE Signals Indicator liefert Signale, die auf der gkNextLevel Binary Options Strategy basieren. Indikatoren: 2 Bollinger Bänder & Stochastik
Hören Sie auf, Trades zu verpassen, hören Sie auf, von Chart zu Chart zu springen, um nach Handels-Setups zu suchen und erhalten Sie alle Signale auf 1 Chart! Verwenden Sie jeden der BOA Signals Indikator mit dem Binary Options Assistant (BOA) Multi Currency Dashboard .
Alle Einstellungen des BOA Signalindikators sind anp
FREE

Der Indikator markiert die Balken mit einer einfachen Trenddefinition" jedes nachfolgende Hoch über/unter dem vorherigen und jedes nachfolgende Tief über/unter dem vorherigen ". Charles Dow
Formel:
Max - Das aktuelle Maximum Min - Das aktuelle Minimum MaxK - Maximum pro Periode MinK - Minimum pro Periode Min>MinK & Max>=MaxK - Symbol oben Max<MaxK & Min<=MinK - Das Symbol am unteren Rand
Eingabeparameter:
Anzahl der Balken in der berechneten Historie Periode für den aktuellen Zeitrahmen Der
FREE
Vorlage Toggle-Indikator Allgemeine Beschreibung Der Template Toggle Indikator ist ein benutzerdefiniertes Tool für die MetaTrader 4 Plattform, das den Wechsel zwischen vordefinierten Chartvorlagen vereinfacht. Er zeigt interaktive Schaltflächen entweder im Hauptchart oder in einem Unterfenster an, so dass Händler schnell verschiedene Vorlagen anwenden können, ohne manuell auf das Vorlagenmenü zuzugreifen. Ideal für Händler, die häufig zwischen Chart-Setups für verschiedene Währungspaare oder Ha
FREE
Der ZoomChart-Indikator zeigt Daten aus anderen Zeitrahmen auf dem aktuellen Chart im Unterfenster an und fungiert als Vergrößerungsglas oder umgekehrt, indem er den Chart verkleinert, um größere Zeitrahmen anzuzeigen.
Der ZoomChar-Indikator verfolgt automatisch den aktuell äußersten Balken im Chart und bewegt sich mit dem Chart, wenn dieser sich verschiebt.
Der Indikator kann die Daten eines anderen Finanzinstruments anzeigen und ist nicht auf das Hauptinstrument des Charts beschränkt.
Der
FREE

Zeigt auf dem Chart ein Histogramm mit zwei gleitenden Durchschnitten. Es ermöglicht das Senden von Alarmen an die MetaTrader-Plattform, wenn die Kreuzungen auftreten. Sie können ihn auf jedem Zeitrahmen verwenden, die Einstellungen der gleitenden Durchschnitte können angepasst werden, ebenso wie das Aussehen und die Farben.
Die Parameter des Indikators sind Periode des schnellen gleitenden Durchschnitts Dauer des langsamen gleitenden Durchschnitts Modus des gleitenden Durchschnitts Gleitender
FREE
Dieser Indikator kann die verbleibende Zeit des aktuellen K-Linienabschlusses in Echtzeit anzeigen
Unterstützt jede Zeitspanne Folgt automatisch und dynamisch der aktuellen K-Linien-Position Berechnet automatisch Tage, Stunden, Minuten und Sekunden
Ich habe ein Schnellbedienfeld in der unteren linken Ecke hinzugefügt. Wenn mehrere verschiedene Bankreihen-Indikatoren gleichzeitig aktiviert sind, kann das Bedienfeld schnell zwischen dem Ein- und Ausblenden der einzelnen Indikatoren umschalten, s
FREE

***WICHTIG: Dieser kostenlose Indikator funktioniert mit dem kostenpflichtigen Strong Weak Forex Expert Advisor. Der EA hängt auch von den folgenden benutzerdefinierten Indikatoren ab: Stark Schwach Heiken Ashi Starke Schwache Symbole Starke Schwache Werte Starker Schwacher Indikator Laden Sie sie kostenlos auf dem Markt herunter. Der EA wird ohne sie nicht funktionieren. Dies sind alles benutzerdefinierte Indikatoren, auf die sich der Strong Weak Forex Expert Advisor stützt, um Handelssignale z
FREE

Mit dieser App können Sie das Stop-Out-Niveau live oder ohne Eröffnung einer Transaktion ermitteln.
Die Anwendung besteht aus 3 Feldern, Sie können den Geldbetrag auf Ihrem Balance-Box-Konto eingeben oder es wird automatisch der aktuelle Kontostand berechnet. Sie können die Größe der SELL-Lots und BUY-Lots eingeben, oder es werden automatisch die derzeit offenen Geschäfte berechnet. Hedge-Transaktionen werden automatisch berechnet.
Wenn Sie die Taste S auf der Tastatur drücken, können Sie die
FREE

Die Stunden der Bombay Stock Exchange Session
Mit diesem Indikator können Sie die Notierungen des Währungspaares während der folgenden Teile der Börsensitzung live verfolgen. Vor Beginn der Börsensitzung wird ein Rechteck auf dem Chart gezeichnet, das jedoch nicht mit Farbe gefüllt ist. Es bedeutet die Ausdehnung der Sitzungsdauer. Bevor der erste Balken in das Rechteck der Börsensitzung eintritt, werden wir durch ein akustisches Signal oder ein Pop-up-Fenster darauf hingewiesen, dass die Börs
FREE
Der ARR-Indikator ist dem ATR-Indikator ähnlich, gibt aber die prozentuale Spanne im Verhältnis zum Eröffnungskurs des jeweiligen Balkens an. Er ist vor allem für Kryptowährungssymbole nützlich, bei denen ATR-Bereiche von vor Jahren nicht direkt mit aktuellen Werten verglichen werden können. Der erste Puffer (rote gepunktete Linie) stellt die prozentuale Spanne eines einzelnen Balkens dar und der zweite Puffer (weiße durchgezogene Linie) stellt den einfachen Durchschnitt der festgelegten Anzahl
FREE

Der Indikator ist ein für MetaTrader entwickeltes Tool, das eine detaillierte Analyse des Kursverhaltens in Bezug auf einen bestimmten gleitenden Durchschnitt ermöglicht. Wenn er mit dem täglichen Zeitrahmen verbunden ist, führt er Berechnungen durch und überwacht auf kleineren Zeitrahmen, wie oft der Kurs im Laufe des Tages bestimmte Abstandsniveaus berührt und berechnet die durchschnittliche Anzahl der Berührungen.
MT5: https://www.mql5.com/pt/market/product/111710
FREE

Der Indikator berechnet die Volatilität relativ zu der in den Einstellungen festgelegten Kerze im angegebenen Bereich. Periode - Bereich für die Berechnung des Maximums und Minimums. Punkt - Nummer der Kerze, ab der die Berechnung durchgeführt wird (Null ist der aktuelle Preis). Für alle Fragen können Sie auf der Website durch das Feedback-Formular oder in den Kommentaren in youtube kontaktieren. Auch auf der Website gibt es andere Arbeiten Link in den Indikator auf der allgemeinen Registerkarte
FREE

Dieser Indikator zeigt die Preisveränderungen für die gleichen Tage in den vergangenen Jahren an. Der Zeitrahmen D1 ist erforderlich. Dieser Indikator findet D1-Balken für dieselben Tage in den letzten 8 Jahren und zeigt deren relative Preisänderungen im aktuellen Chart an. Parameter: LookForward - Anzahl der Tage (Balken), für die "zukünftige" Preisänderungen angezeigt werden sollen; Standardwert ist 5; Offset - Anzahl der Tage (Balken), um in der Historie zurück zu gehen; Standardwert ist 0; S
FREE
StrxInfoPanel ist ein unverzichtbares Werkzeug für jeden Trader Es gibt Ihnen einen sofortigen Überblick über Ihr Konto und Echtzeitinformationen über das aktuelle Symbol und den Zeitrahmen, den Sie analysieren Jede Informationszeile kann über Parameter ein- und ausgeblendet werden, auch die Position des Panels kann über Eingabeparameter verändert werden Liste der Parameter: Ecke : die Bildschirmecke, in der das Panel angezeigt werden soll Left, Top und Width : anpassbare Position und Abmessunge
FREE

Indikator geglätteter gleitender Durchschnitt (xMA)
Eingabeparameter: xMA Periode - Mittelungszeitraum xMA Methode - Mittelwertbildungsmethode ( 0-SMA | 1-EMA | 2-SMMA | 3 - LWMA) xMA Price - verwendeter Preis ( 0 - CLOSE | 1 - OPEN | 2 - HIGH | 3 - LOW | 4 - MEDIAN | 5 - TYPICAL | 6 - WEIGHTED) xMA Farbe - Farbe der Indikatorlinie xMA Breite - Dicke der Indikatorlinie
Funktionsweise
Der Indikator berechnet den technischen Standardindikator Gleitender Durchschnitt neu (er mittelt die erhalte
FREE
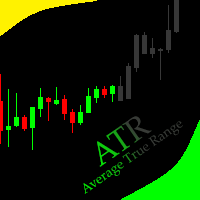
Dieser Indikator ermöglicht es, den ATR-Oszillator (auf allen MT4-Zeitrahmen) ab einem vom Benutzer definierten Datum mit einer vertikalen Linie (Alone) oder einem Panel (mit "Hidden Candles") auszublenden. Eingaben des Indikators: Zeitraum Informationen zum Indikator "Average True Range" finden Sie hier: https: //www.metatrader4.com/en/trading-platform/help/analytics/tech_indicators/average_true_range ************************************************************* Hey Trader!!! Gebt mir eure Feed
FREE
MetaTrader Market - Handelsroboter und technische Indikatoren stehen Ihnen direkt im Kundenterminal zur Verfügung.
Das MQL5.community Zahlungssystem wurde für die Services der MetaTrader Plattform entwickelt und steht allen registrierten Nutzern der MQL5.com Webseite zur Verfügung. Man kann Geldmittel durch WebMoney, PayPal und Bankkarten einzahlen und sich auszahlen lassen.
Sie verpassen Handelsmöglichkeiten:
- Freie Handelsapplikationen
- Über 8.000 Signale zum Kopieren
- Wirtschaftsnachrichten für die Lage an den Finanzmärkte
Registrierung
Einloggen
Wenn Sie kein Benutzerkonto haben, registrieren Sie sich
Erlauben Sie die Verwendung von Cookies, um sich auf der Website MQL5.com anzumelden.
Bitte aktivieren Sie die notwendige Einstellung in Ihrem Browser, da Sie sich sonst nicht einloggen können.