Technische Indikatoren für den MetaTrader 4 - 29

Über Waddah Multimeter (kostenlos):
Dieses Produkt basiert auf dem WAExplosion Indicator. Es hilft, explosive Markttrends und potenzielle Handelsmöglichkeiten zu erkennen. Schauen Sie sich den detaillierten Produktbeitrag hier für Scanner und Multimeter an: https://www.mql5.com/en/blogs/post/758020
Bitte beachten Sie, dass der Scanner kostenpflichtig und das Multimeter kostenlos ist.
Merkmale: Waddah Trendrichtung Trendstärke (oberhalb/unterhalb der Explosionslinie oder Totzone) Trend-Explosio
FREE
Dieses Dashboard kann kostenlos heruntergeladen werden, setzt aber voraus, dass Sie den Flag Trend Pro MT4-Indikator besitzen . Laden Sie den Indikator herunter: Flag Trend Pro
Das Dashboard zeigt Ihnen auf einem einzigen Chart alle Zeitrahmen (M1 bis Monthly) mit ihrem eigenen Status für den Indikator :Gold Pro MT4
alle Zeitrahmen und alle Symbole: intelligenter Algorithmus erkennt den Trend, filtert das Marktrauschen heraus und gibt Einstiegssignale!!!
Wie man den Status versteht: Symbol
FREE

Einführung und Beschreibung
Der Indikator zeigt einen Pfeil an, wenn ein "Bearish Engulfing " erkannt wird. Letzteres weist in der Regel auf den Beginn eines Abwärtstrends hin. Ein "Bearish Engulfing"-Muster ist ein charttechnisches Muster, das den Beginn niedrigerer Kurse ankündigt. Das Muster besteht aus einer Aufwärtskerze, gefolgt von einer großen Abwärtskerze, die die kleinere Aufwärtskerze in den Schatten stellt oder "verschlingt". Das Muster kann wichtig sein, weil es zeigt, dass die Verk
FREE
Hochgradig konfigurierbarer Osma-Indikator.
Merkmale: Hochgradig anpassbare Alarmfunktionen (bei Levels, Kreuzen, Richtungsänderungen per E-Mail, Push, Sound, Popup) Multi-Timeframe-Fähigkeit Farbanpassung (bei Pegeln, Kreuzen, Richtungsänderungen) Optionen für lineare Interpolation und Histogramm-Modus Funktioniert im Strategie-Tester im Multi-Timeframe-Modus (auch am Wochenende ohne Ticks) Einstellbare Levels Parameter:
Osma Timeframe: Sie können die unteren/höheren Timeframes für Osma einst
FREE

Th3Eng Panda Trend ist ein leistungsfähiger Indikator, der sowohl für Scalping-Trades als auch für Swing-Trades perfekt geeignet ist. Th3Eng Panda Trend ist nicht nur ein Indikator, sondern ein sehr guter Trendfilter. Sie können ihn auf H4/H1 einrichten, um den Haupttrend zu finden und Scalping auf M5/m15/m30 Time Frames zu starten. Funktioniert mit allen Paaren und allen Time Frames.
Eingaben:
Abschnitt #1 Historie : Maximale Anzahl von Bars, um die letzten Signale zu zeichnen. (Voreinstellun
FREE

Der Indikator zeigt die Größe des Spreads für das aktuelle Instrument auf dem Chart an. Sehr flexibel in den Einstellungen. Es ist möglich, den maximalen Wert des Spreads festzulegen, bei dessen Überschreitung sich die Farbe des Spread-Labels ändert und ein Signal ertönt (falls in den Einstellungen aktiviert). Der Indikator ist sehr praktisch für Leute, die mit Nachrichten handeln. Sie werden nie einen Handel mit einem großen Spread eingehen, da der Indikator Sie sowohl visuell als auch akustisc
FREE

AIS MT4 INDICATOR 5 ALL INCLLUSIVE SET
!!!!!!!!!!!!!!!!!!!!!!!!!!!!!!!!!!!!!!!!!!!!!!!!!!!!!!!!!!!
!
! ATTENTION ! LIMITATION OF FREE OFFER PERIOD IS IMPLICIT !
!
! CONFIRMATION 2024-08-20 20:00 !
!
!!!!!!!!!!!!!!!!!!!!!!!!!!!!!!!!!!!!!!!!!!!!!!!!!!!!!!!!!!!
GUIDE
CHAPTER 1 IMPORTANT INFORMATION <1> THIS INDICATOR IS ONE OF THE SERIES OF NEW AIS INDICATORS AIS MT4 INDICATOR 1 =ADVANCED CLASSIC= AIS MT4 INDICATOR 2 =MULTIFRAMES= AIS MT4 INDICATOR 3 =LINES= AIS M
FREE

Hochgradig konfigurierbarer Balance of Power (BOP)-Indikator.
Merkmale: Hochgradig anpassbare Alarmfunktionen (bei Levels, Kreuzen, Richtungsänderungen per E-Mail, Push, Sound, Popup) Multi-Timeframe-Fähigkeit Farbanpassung (bei Levels, Kreuzen, Richtungswechseln) Optionen für lineare Interpolation und Histogramm-Modus Funktioniert im Strategie-Tester im Multi-Timeframe-Modus (auch am Wochenende ohne Ticks) Einstellbare Levels Parameter:
BOP Timeframe : Sie können die unteren/höheren Timeframes
FREE

Graphic Shapes - unter Verwendung der Historie werden vier Arten von grafischen Formen projiziert, die es Ihnen ermöglichen, die wichtigsten Bereiche der zukünftigen Preisbewegung zu bestimmen, sowie die wichtigsten Marktumkehrungen zu verstehen und gleichzeitig Einstiegspunkte nach Priorität zu bestimmen. Sie ermöglichen es Ihnen, eine vollständige Marktanalyse durchzuführen, ohne zusätzliche Tools zu verwenden! Der Indikator ist ein leistungsfähiges Instrument zur Vorhersage von Preisbewegunge
FREE

Smart Trend Line Alert Demo ist ein einzigartiger professioneller Trendlinien-, Unterstützungslinien- und Widerstandslinien-Touch- und Ausbruchsalarm mit einer fantastischen Alarm-Historienfunktion, die Händlern hilft, viele Charts und Symbole einfach zu verwalten, ohne auf den Monitor starren zu müssen. Hinweis: Dies ist eine Demoversion, die nur für USDCHF funktioniert . Link zur Vollversion: https://www.mql5.com/en/market/product/3085
Funktionen Candle Break Out Alert, Price Touch Alert und
FREE
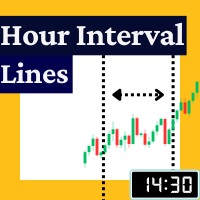
Der Rayol Code Hour Interval Lines-Indikator wurde entwickelt, um Ihre Handelserfahrung zu unterstützen. Er zeichnet den vom Benutzer gewählten Stundenbereich direkt auf dem Chart ein, so dass er es dem Händler ermöglicht, die Kursbewegungen während der von ihm bevorzugten Handelszeiten zu visualisieren, was ihm einen umfassenderen Blick auf die Kursbewegungen und die Marktdynamik ermöglicht. Dieser Indikator ermöglicht es dem Benutzer, nicht nur die Zeit des Brokers, sondern auch die Ortszeit z
FREE
Countdown-Indikator Merkmale Kategorie
Erläuterung
Bemerkungen
Erwarteter End-Countdown Berechnet die Endzeit der aktuellen Candlestick-Periode (kann auf alle Perioden angewendet werden), wobei berücksichtigt wird, dass die Candlestick aufgrund von täglichen Marktschließungen früher enden kann; Falls die Kerze mehrere Schließungen und Eröffnungen enthält, wird die letzte Schließung oder der letzte Kerzenschlusszeitpunkt verwendet. Es ist erwähnenswert, dass: dieser Indikator nicht berücksich
FREE

FusionAlert StochRSI Master ist ein Indikator, der für MT4/MT5-Plattformen verfügbar ist. Er ist eine Kombination aus RSI- und Stochastik-Indikator, die "Alarme" liefern, wenn sich der Markt in "überkauften und überverkauften" Regionen befindet, was in Kombination beider Indikatoren zu präziseren und genaueren Signalen führt, die als wunderbares Werkzeug in Form von "Kauf- oder Verkaufssignalen" verwendet werden können. Dieser Indikator verfügt über viele Anpassungsoptionen, die im Abschnitt "Pa
FREE

RiskMaster Pro Lotsize Protector
Der Indicator bietet die wohl unkomplizierteste Form zum Managen des Risikos. Ohne komplizierte Einstellungen liefert es genau die Informationen, welche zur Orderausführung notwendig sind.
Keine komplizierten Einstellungen, die gewünschte Order Art auswählen Market/Pending Aufträge, das gewünschte Risiko in Prozent des verfügbaren Kapitals und das Risiko-Ertrags-Verhältnis (Risk-Reward-Ratio RRR) eingeben.
Market Orders: • Stop Loss (SL) Linie mit der Maus a
FREE

Der Channel Builder (CB) oder Ivanov-Bands-Indikator ist eine weitgehende Verallgemeinerung des Bollinger-Bands-Indikators . Erstens wird bei CB die Mittellinie <X> mit Hilfe verschiedener Mittelungsalgorithmen berechnet. Zweitens werden die durch Kolmogorov-Mittelung berechneten Mittelwertabweichungen auf beiden Seiten der Mittellinie <X> aufgetragen. Die Mittellinie <X> kann neben den Standard-Mittelungsalgorithmen SMA, EMA, SMMA und LWMA auch Median = (Max + Min) / 2 gleitender Median sein (
FREE

Dies ist das Handelssystem des Autors.
Entwickelt für den Intraday-Handel. Die Signale werden nicht umgeschrieben. Geeignet für jedes Instrument und jeden Zeitrahmen. Sie können Warnungen aktivieren. Einfach zu benutzen. Siehe Bildschirmfotos. Einfache Einstellungen! Alles ist bereits für Sie erledigt! Die Grundlage ist die Analyse des aktuellen Trends. Der Indikator sucht nach einem Ausweg aus der Akkumulation. Wenn Sie schon lange auf der Suche nach einem guten Handelssystem sind, dann liegt
FREE
XAU Scalper MT4 MT5-Version Ein Analysewerkzeug zur Beobachtung kurzfristiger Preisbewegungen bei Gold-Paaren. Der XAU Scalper Indikator liefert Kauf- und Verkaufssignale , die auf der Stabilität der Kerze, dem RSI und der kurzfristigen Dynamik basieren. Er wurde entwickelt, um Händlern zu helfen, potenzielle Einstiegspunkte während kurzer Marktbewegungen in XAU-Paaren zu identifizieren. Funktionen Kerzenstabilitätsindex ( Candle Stability Index ): Misst das Verhältnis zwischen Kerzenkörper und
FREE

Der Indikator wurde speziell für das Handelsdienstprogramm Trade Shell (einschließlich Trade Shell SMC ) entwickelt, damit er im visuellen Strategietester funktioniert.
Testen Sie Ihre Handelsideen und Indikatoren im Backtest. Starten Sie Trade Shell auf dem visuellen Tester und setzen Sie den Indikator dann auf den Chart. Danach können Sie alle Funktionen der Trade Shell so gut steuern wie im Live-Betrieb! Es funktioniert nicht live! Verwenden Sie ihn nur mit dem visuellen Tester. Es ist nicht
FREE

The Red Dragons Support and Resistance Levels indicator automatically determines support and resistance levels using the proprietary algorithm based on historical and current data, so the levels are dynamic, which allows you to adjust trading targets based on the current price movement. For this reason, we use this indicator in our advisors, for example, Red Dragons, which you can purchase here:
https://www.mql5.com/en/market/product/128713?source=Site +Market+MT4+New+Rating006
The panel also
FREE
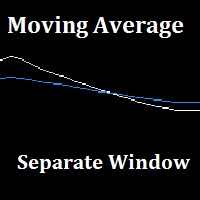
"Separater gleitender Durchschnitt" ist ein benutzerdefinierter Indikator, der aus der Kombination von 2 gleitenden Durchschnitten in einem anderen Fenster (dem Indikatorfenster) besteht, um die Unübersichtlichkeit des Preisdiagramms zu beseitigen. Der Indikator verfügt auch über Pfeile, die das Kreuz des gleitenden Durchschnitts entweder lang oder kurz anzeigen. Alle Parameter des gleitenden Durchschnitts können über das Eingabefenster des Indikators angepasst werden.
FREE
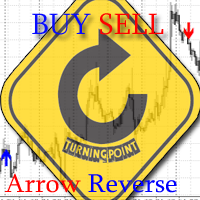
Der Indikator zeigt die Marktumkehrungen als Pfeile an. Die Umkehrsignale basieren auf der Beobachtung des Marktverhaltens. Er basiert auf den Prinzipien der Suche nach Extremwerten, Volumina und Price Action. Der Indikator liefert Signale nach den folgenden Prinzipien: Suche nach dem Ende des aufsteigenden/absteigenden Trends Suche nach dem Umkehrmuster auf Basis der Price Action Bestätigung der Umkehrung durch das Kontraktvolumen. Der Indikator verfügt außerdem über einen Alarm, der ausgelöst

Hochgradig konfigurierbarer Fisher-Transform-Indikator.
Merkmale: Hochgradig anpassbare Alarmfunktionen (bei Levels, Kreuzen, Richtungsänderungen per E-Mail, Push, Sound, Popup) Multi-Timeframe-Fähigkeit Farbanpassung (bei Levels, Kreuzen, Richtungsänderungen) Optionen für lineare Interpolation und Histogramm-Modus Funktioniert im Strategie-Tester im Multi-Timeframe-Modus (auch am Wochenende ohne Ticks) Einstellbare Levels Parameter:
Fisher Transform Timeframe: Sie können die unteren/höheren Ti
FREE

4H Open Line Indicator - Einstellungen Übersicht Dieser benutzerdefinierte Indikator wird verwendet, um den Eröffnungskurs , die Mittellinie und die Hoch/Tief-Bereiche von 4-Stunden-Kerzen auf kleineren Zeitrahmen zu zeichnen und zu visualisieren. Er ist besonders nützlich für Intraday-Händler, die die Niveaus höherer Zeitrahmen sehen möchten. Eingaben und Beschreibungen des Indikators Parameter Wert Beschreibung OpenLineFarbe Weiß Farbe der Linie, die den Eröffnungskurs der 4H-Kerze anzei
FREE

Dieser Semaphor-Indikator basiert auf dem Standard-RSI, der über den Hüllkurven-Indikator gelegt wird, der eine Hüllkurve oder Hüllkurvenschwankungsgrenzen anzeigt. Dies ist eine Version des RSI vs. Envelopes , die im Symbolfenster gezeichnet wird. Ein Verkaufssignal entsteht, wenn die obere Hüllkurve/Grenze vom RSI-Indikator von oben nach unten durchbrochen wird. Ein Kaufsignal entsteht, wenn die untere Hüllkurve/Grenze durch den RSI-Indikator von unten nach oben durchbrochen wird. Der Indikato
FREE

Smart Fibo Zones sind leistungsstarke, automatisch generierte Fibonacci-Retracements, die an wichtigen Marktstrukturverschiebungen verankert sind. Diese Zonen dienen als kritische Angebots- und Nachfrageniveaus , die Ihnen helfen, potenzielle Preisreaktionen zu erkennen und die Marktrichtung zu bestätigen. Fibonacci-Berechnungen , die von professionellen Händlern häufig verwendet werden, können komplex sein, wenn es darum geht, Hochs und Tiefs zu identifizieren. Smart Fibo Zones vereinfacht dies

Merkmale: Finden Sie diese Engulfing-Muster: Einfacher Engulf Stick Sandwich Engulf Drei-Linien-Schlag Aufsteigende Drei Morgenstern Doji Scanner sind nützlich, um Ihre Strategie zu verbessern. Orientieren Sie sich nicht immer am Gewinn/Verlust-Prozentsatz. Denn dieses Tool basiert nicht auf den Ergebnissen der Vergangenheit. Grundeinstellungen: Für alle Patterns können Sie einstellen: Verhältnis erste:letzte Kerze Dies stellt sicher, dass die frühere Gegenkerze mindestens das angegebene Verhält
FREE

Entfesseln Sie Ihr Handelspotenzial mit dem Apex Trend Detector! Sind Sie es leid, profitable Trades zu verpassen? Fällt es Ihnen schwer, auf dem volatilen Devisenmarkt zuverlässige Ein- und Ausstiegspunkte zu finden? Es ist an der Zeit, Ihr Handelsarsenal mit dem Apex Trend Detector aufzurüsten - dem intelligenten MT4-Indikator, der entwickelt wurde, um das Marktrauschen zu durchdringen und hochwahrscheinliche Handelsmöglichkeiten zu erkennen! Der Apex Trend Detector ist nicht einfach nur ein w
FREE

IntradayMagic prognostiziert ATR und Tick-Volumen für 1 Tag im Voraus. Der Indikator wird nicht neu gezeichnet und hinkt nicht hinterher. Mit Intraday Magic können Sie die Qualität des Handels deutlich verbessern und unnötige Risiken vermeiden. Anhand seiner Messwerte können Sie Marktkrisen und Trendumkehrmomente erkennen, den Zeitpunkt und die Richtung von Einstiegen klären. Diese kostenlose Testversion ist auf Symbole (Paare) einschließlich GBP beschränkt. Es gibt keine weiteren Beschränkungen
FREE

Dieser Indikator verarbeitet nicht die Daten des Kurscharts und liefert keine Handelssignale. Stattdessen handelt es sich um eine Anwendung zur Berechnung und Anzeige der Frequenzantwort vieler herkömmlicher Indikatoren. Gleitende Durchschnitte wie der SMA, der LWMA und der EMA sowie Oszillatoren wie der MACD, der CCI und der Awsome Osc haben alle die Form von digitalen Filtern. Elektronikingenieure verwenden eine spezielle Methode zur Charakterisierung der Leistung dieser Filter, indem sie ihr
FREE
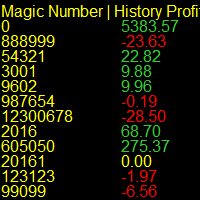
Betreiben Sie mehrere EAs auf Ihrem Konto und sind verwirrt, wer gewinnt und wer verliert? Probieren Sie diesen Indikator aus, der in Echtzeit über die Magic Numbers in Ihrem Konto berichtet, indem er die History_trades zusammen mit den Open_trades ausliest. Hinweis: Manuelle Trades werden unter der Magic Number "0" gruppiert. Um einen besseren visuellen Bericht zu erhalten, lassen Sie den Indikator auf einem Symbol laufen, auf dem Sie keine Trades ausführen, schalten Sie die Verlaufsbalken auf
FREE

FIBO-ALERT https://www.mql5.com/en/market/product/34921
Dieser Indikator zeichnet ein Fibonacci-Retracement (Hoch und Tief) einer Kerze. Er alarmiert und benachrichtigt den Benutzer, sobald der Kurs die Fibonacci-Levels berührt oder durchquert. INPUTS ON Alert: Wenn diese Option auf true gesetzt wird, erscheint ein Pop-up-Alarm, sobald der Preis die Niveaus im Chart-Zeitrahmen überschreitet. ON Push: Wenn diese Option auf true gesetzt ist, wird eine Push-Benachrichtigung an das Telefon gesendet
FREE

Dieser Indikator ist für das Scalping auf dem Forex-Markt und den Handel mit binären Optionen konzipiert. Ein Signal erscheint bei der Eröffnung einer neuen Kerze. Empfehlungen für die Verwendung: Für binäre Optionen: Es wird empfohlen, Trades zu eröffnen, wenn ein Signal auf der ersten Kerze erscheint. Ein Kaufsignal erscheint, wenn das blaue X das rote ersetzt, während ein Verkaufssignal erscheint, wenn das rote X das blaue ersetzt, wie in den Screenshots gezeigt. Für den Devisenmarkt: Tätige
FREE

!!! In [CodeBase] habe ich den Mql4-Indikatorcode veröffentlicht. Laden Sie den Code kostenlos herunter!!! (Sie müssen den Code beim Update des Terminals anpassen).
Dieser Indikator ist ein Werkzeug für Trader. Es zeigt die Bewegung der Stochastik in allen Perioden und Symbolen: М1, М5, М15, М30, Н1, Н4 jede Minute (die Zeitskala von aktuell bis -240 Minuten, d.h. die letzten 4 Stunden).
Step_Stoch überwindet den Nachteil stochastischer Indikatoren - Lagging. Zum Beispiel kann ein Anstieg nach
FREE

Eine Informationstafel, die Kauf- und Verkaufsniveaus und Gewinnziele für den aktuellen Tag festlegt. Die Niveaus werden entsprechend der Bewegung der Währung für den gestrigen Tag festgelegt. Das Panel enthält Informationen über das Währungspaar, Markttrends, Zeit zum Schließen des Balkens, Geldmanagement, empfohlenes Lot, Gewinn in Pips sowie Niveaus für den Kauf und Verkauf des Instruments. Verwenden Sie nur schwebende Ausbruchsaufträge, um Geschäfte zu tätigen. Eingabeparameter Lots - legen
FREE

Der Magic SMMA Indikator ist eine große Hilfe bei der Bestimmung der Trendrichtung. Es kann eine hervorragende Ergänzung zu Ihrer bestehenden Strategie oder die Grundlage für eine neue sein. Wir Menschen können bessere Entscheidungen treffen, wenn wir visuell besser sehen. Also haben wir es so gestaltet, dass es für steigende und fallende Trends eine andere Farbe anzeigt. Jeder kann dies so anpassen, wie es ihm am besten passt. Indem wir den Trendzeitraum festlegen, können wir ihn für längere o
FREE

Hallo. Ein weiterer kostenloser Indikator von Sepehr! ;) Mit diesem Tool kann man den Trend bestimmen. Anhand der Kreuzung zweier gleitender Durchschnitte kann man sagen, ob der Trend nach oben oder unten geht; ein schneller und ein langsamer Durchschnitt. Wenn der schnell gleitende Durchschnitt den langsam gleitenden Durchschnitt nach oben kreuzt, handelt es sich um einen Aufwärtstrend, und wenn er den langsam gleitenden Durchschnitt nach unten kreuzt, bedeutet dies, dass Sie einen Abwärtstrend
FREE

Dieser Indikator hilft Ihnen, die Horizontlinien ( Marcelo Ferreira ) auf dem Wochenchart zu zeichnen. Sie können z.B. auf M5 oder M15 umschalten. Die wöchentlichen Linien bleiben dabei erhalten. Die Analyse von Trends auf Wochencharts vor dem Einstieg in den Devisenmarkt ist unerlässlich, um die vorherrschende langfristige Richtung des Marktes zu erkennen. Diese Art der Analyse hilft, impulsive Entscheidungen auf der Grundlage kurzfristiger Schwankungen zu vermeiden, und bietet einen klareren Ü
FREE

SRP (Strong Retracement/Reversal Points) ist ein leistungsstarker und einzigartiger Unterstützungs- und Widerstandsindikator. Er zeigt die nächstgelegenen wichtigen Niveaus an, bei denen wir ein Retracement/Reversal des Preises erwarten! Wenn alle Niveaus von einer Seite durchbrochen werden, berechnet er neue Unterstützungs- und Widerstandsniveaus und zeichnet diese ein, so dass die Niveaus je nach Markt für mehrere Tage gültig sein können!
Hauptmerkmale Sie können es in allen Zeitrahmen verwen
FREE

Ständig überprüfen zu müssen, ob Ihre Stochastik ein bestimmtes Niveau erreicht hat, kann manchmal mühsam und anstrengend sein, vor allem, wenn Sie verschiedene Anlageklassen gleichzeitig überwachen müssen. Der Alert Stochastics-Indikator unterstützt Sie bei dieser Aufgabe und sorgt dafür, dass Sie mit wenig Aufwand das Maximum herausholen. Wenn die Stochastik-Werte ein bestimmtes Niveau erreichen, werden die Alarme ausgelöst, und zwar auf dem Chart, in der MT4-Telefon-App oder per E-Mail (Sie k
FREE

ATR Moving Average zeichnet einen gleitenden Durchschnitt des Standard Average True Range ( ATR ) im gleichen Fenster.
Einstellungen Name Beschreibung ATR-Zeitraum
Eingestellte Preisperiode für die ATR-Berechnung
ATR-Niveau Legt den ATR-Wert für den Schwellenwert fest (nur ganze Zahlen, führende Nullen werden ignoriert, z.B. 0.00089 = 89) MA-Zeitraum Einstellen der Periode des gleitenden Durchschnitts MA-Methode Einstellen der Methode des gleitenden Durchschnitts (einfach, exponentiell, geglä
FREE

Einführung in den Super Pivot- und Fibo-Indikator: Ihr ultimativer Trading-Begleiter Sind Sie bereit, Ihr Trading auf die nächste Stufe zu heben? Der Super Pivot- und Fibo-Indikator ist hier, um Ihre Handelsstrategie zu revolutionieren. Dieses leistungsstarke Tool kombiniert Schlüsselelemente wie Pivot-Punkte, Fibonacci-Retracement- und Extension-Levels, High-Low-Werte und Camarilla-Punkte, um Ihnen eine umfassende und genaue Analyse des Marktes zu liefern. Hauptmerkmale: Pivot-Punkte: Unser Ind
FREE
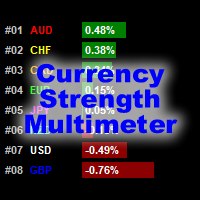
Der Indikator Währungsstärke-Multimeter zeigt die Stärke, Richtung und den Rang jeder der folgenden Währungen an: AUD CAD CHF EUR GBP JPY NZD USD Darüber hinaus zeigt es auch die Stärke, Richtung und den Rang jedes der folgenden Währungspaare: AUDCAD AUDCHF AUDJPY AUDNZD AUDUSD CADCHF CADJPY CHFJPY EURAUD EURCAD EURCHF EURGBP EURJPY EURNZD EURUSD GBPAUD GBPCAD GBPCHF GBPJPY GBPNZD GBPUSD NZDCAD NZDCHF NZDJPY NZDUSD USDCAD USDCHF USDJPY Der Indikator funktioniert in jedem Diagramm und in jedem Z
FREE

Der LexusBO-Indikator wird für den Handel mit binären Optionen empfohlen. Signale werden generiert, wenn die Indikatoren RSI, ADX und CCI die anpassbaren Werte überschreiten. Der Indikator zeigt die Signale durch Auf- und Abwärtspfeile auf dem Chart an. Ihre Werte sind in den Puffer-Arrays verfügbar (Puffer mit Index 0 - "Aufwärtspfeil", mit Index 1 - "Abwärtspfeil"). Dies erleichtert die Verwendung des Indikators für den automatisierten Handel durch spezialisierte Expert Advisors. Der empfohlen
FREE

Präzise Trading-Analyse auf Knopfdruck: Next-Generation Trading-Analyse-Software Die auf dem Markt erhältliche Standard-Trading-Analyse-Software bietet oft nur stündliche oder wöchentliche Statistiken zum Verhältnis von Gewinn und Verlust, was den Bedarf an einer präziseren Trading-Analyse nicht erfüllt. Im realen Trading-Markt präsentiert sich jedoch jeder Tag mit einzigartigen Umständen. Montags sind ruhig, Mittwochs sind aktiv mit dreifachen Overnight-Zinsen, und Freitags sind außergewöhnlic
FREE

Haben Sie Schwierigkeiten zu erkennen, wo die verschiedenen Forex-Sessions beginnen und enden? Oder erfordert Ihre Strategie, dass Sie nur in einer bestimmten Sitzung handeln? Dann ist dies genau das Richtige für Sie.
Der Sitzungsindikator schattiert die gewünschte Sitzung in einer bestimmten Farbe, so dass Sie sie leicht identifizieren können. Zu den angezeigten Sitzungen gehören: Londoner Sitzung, New Yorker Sitzung, Asiatische Sitzung, Überschneidung Asien - London und Überschneidung London
FREE

TMA Classic – Übersicht des Dreiecks gleitenden Durchschnitts-Indikators Der TMA Classic ist ein sehr einfacher und leichter Indikator, der den Dreiecks gleitenden Durchschnitt (TMA) als eine einzelne, geglättete Linie anzeigt. Er entfernt effektiv übermäßiges Rauschen und erfasst die zentrale Preisbewegung, was hilfreich für die Erkennung von Trends und Seitwärtsmärkten ist. Da nur eine Linie angezeigt wird, bietet der Indikator eine hohe Sichtbarkeit auf dem Chart, ohne mit anderen Indikatoren
FREE

Nermal Round Levels ist ein Indikator für runde Zahlen in Form eines Gitters mit horizontalen Linien. Sie können ihn in vielerlei Hinsicht verwenden ... als Aktivierung für einen Expert Advisor, um in den Markt einzusteigen, als Bestätigung für den Einstieg in Ihre Strategie, als Einstiegsbereich, zur Markierung von Bereichen mit wichtigen Niveaus, für mögliche Rebounds und andere. Platzieren Sie es in Ihrem Chart und überprüfen Sie, ob der Preis diese runden Niveaus respektiert.
Eingaben Rast
FREE

Egal, ob Sie ein Scalper oder ein Tageshändler sind, Sie werden immer nach bullischen/baissischen Engulfing-Kerzen Ausschau halten. Dies kann etwas schwierig und anstrengend sein, wenn Sie versuchen, die Engulfing-Kerzen auf dem Chart visuell zu identifizieren. Darüber hinaus kann es vorkommen, dass Sie auf dem M15-Zeitrahmen handeln, aber die engulfende Kerze sich auf dem H4-Zeitrahmen bildet oder bereits gebildet hat. Dieser Indikator ist dafür gemacht, dies für Sie zu tun. Sie können auf jede
FREE

Indikator ini berdasarkan Gain ADX - Trend folgen - Disertai Pivot, Support & Resistant Daily
Dengan indicator ini semoga menjadikan indicator yang porofit able, selama mengikuti signal yang tampil, apabila berwarna Hijau siap2 untuk Buy, dan berwarna Merah siap2 untuk Sell.
Akan tampil signal Sell/Buy di saat gain mencukupi, baik TF Kecil maupun TF Besar TF Besar / Hoch TF adalah Trend Kuat TF Kecil / Low TF adalah Trend Lemah
Open Posisi pada High TF, signal akan menunjukkan Sell/Buy.
FREE

AdvaneZigZag-Indikator
Haben Sie genug von den Einschränkungen des traditionellen ZigZag-Indikators? Lernen Sie AdvaneZigZag kennen, das ultimative Werkzeug, um Ihre Marktstrukturanalyse zu vereinfachen und Ihre Handelsstrategien zu verbessern. AdvaneZigZag wurde mit Blick auf Flexibilität und Präzision entwickelt und bietet Ihnen fortschrittliche Funktionen, um den Markt mit Zuversicht zu navigieren.
Hauptmerkmale:
1. Erhöhte Flexibilität:
- Während die vertraute Einfachheit des konvention
FREE
Einfacher Indikator, der Ihren Verlauf in Pips und Gewinn anzeigt. Sie können ihn verwenden, um Ihren Fortschritt bei den Positionen zu verfolgen. Er zeigt Ihnen den Handelsverlauf nur für das Symbol, auf dem der Indikator steht, und nur für Ihren Handelsverlauf. Der Text des Labels wird aktualisiert, wenn der Auftrag geschlossen wird. Der Text kann an jeder Ecke angezeigt werden, er befindet sich in den Parametern.
Grundlegende Eingabeparameter: Farbe der Beschriftung Schriftgröße Position des
FREE

Dieser Indikator hilft Ihnen, überkaufte und überverkaufte Kurse auf der Grundlage des William %R zu finden. Eingabe Beschreibung: WZeitraum: Zeitraum für den %R-Indikator. ÜberkauftLevel: Definieren Sie das überkaufte Niveau für %R. Muss zwischen 0 und -50 liegen. OverSoldLevel: Definieren Sie das überverkaufte Niveau für %R. Muss zwischen -50 und -100 liegen. mittlerer_Wert: Wenn true, zeichnet der Indikator auch die mittleren Punkte zwischen der oberen und unteren Linie. shift: Legt einen zus
FREE

Der All Averages Scanner Dashboard ist ein MT4-Indikator, der entwickelt wurde, um den aktuellen Stand verschiedener Arten von gleitenden Durchschnitten anzuzeigen. Lesen Sie den Blogbeitrag für eine detaillierte Erklärung mit Screenshots: https://www.mql5.com/en/blogs/post/762972
Der Indikator eignet sich hervorragend, wenn Sie verschiedene Arten von gleitenden Durchschnitten in Bezug auf den Preis und andere Durchschnitte testen möchten. Auch wenn Ihre Strategie auf dem Stapeln von MAs basie
FREE

Zeitlich begrenztes Angebot! Zum Start von NextBot Scalper EA wird der Preis dieses Indikators auf KOSTENLOS fallen !
Wir stellen Ihnen ein pragmatisches und innovatives Tool für MetaTrader 4 (MT4) Trader vor: den Linear Regression Next Channel Indikator, der mit dem Bestimmtheitsmaß R 2 erweitert wurde. Dieser Indikator dient als grundlegendes Instrument für Händler, die Markttrends durch die Linse der statistischen Analyse, insbesondere der linearen Regression, verstehen wollen.
Die Essenz d
FREE
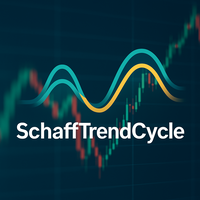
Was ist der Schaff Trend Cycle? Der Schaff Trend Cycle (STC) ist ein Oszillator-Indikator, der entwickelt wurde, um Trendwechsel frühzeitig zu erkennen. Im Gegensatz zu traditionellen Indikatoren wie gleitenden Durchschnitten oder dem MACD kombiniert der STC zyklische Marktbewegungen mit Momentum, um den Beginn und das Ende eines Trends klarer darzustellen. Hauptmerkmale Klare Trendwendesignale: Die Zykluslinie steigt bei Aufwärtstrends und fällt bei Abwärtstrends. Rauschunterdrückung in Seitwär
FREE

Produkttitel Smart Bulls (MT4) – Teil der SmartView Indicators Serie Kurzbeschreibung Ein Bulls -Indikator mit einzigartiger Benutzererfahrung auf der MetaTrader-Plattform. Bietet erweiterte Funktionen, die zuvor nicht verfügbar waren, wie das Öffnen von Einstellungen per Doppelklick, das Ausblenden und Anzeigen von Indikatoren ohne Löschung und die Anzeige des Indikatorfensters in voller Chartgröße. Entwickelt für nahtlose Zusammenarbeit mit dem Rest der SmartView Indicators Serie. Überblick Di
FREE

Übersicht Der True Strength Index (TSI) Indikator ist ein Momentum-Oszillator, der in einem separaten Fenster in MT4 angezeigt wird. Er glättet das Momentum (MTM) und dessen Absolutwert mittels zweier aufeinanderfolgender Exponential Moving Averages (EMAs) und berechnet anschließend deren Verhältnis multipliziert mit 100. Der TSI hilft, die Stärke eines Trends und mögliche Wendepunkte im Markt zu visualisieren. Hauptfunktionen Duale EMA-Glättung zur Reduzierung von Rauschen und Erzeugung einer s
FREE
Hören Sie auf zu raten, fangen Sie an zu bestätigen: Die Einführung von Signal Sentinel Haben Sie genug von Signalen, die Sie im Regen stehen lassen? Der Signal Sentinel-Indikator ist Ihre ultimative Waffe gegen die Ungewissheit am Markt. Er wurde entwickelt, um Ihnen hochwahrscheinliche Handels-Setups direkt auf Ihr Chart zu liefern. Wir haben die Kraft von zwei MACDs mit einem langfristigen EMA-Filter kombiniert, um sicherzustellen, dass Sie nur in den stärksten, am besten bestätigten Trends
FREE

Macd Prädiktor Macd 's Haupt-Chart-Indikator Wenn Sie diesen Indikator mögen, ist Dinapoli Levels Expansion and Retracement Demo ein hilfreiches Werkzeug :https://www.mql5.com/en/market/product/35884
1. Sie können den Preis bestimmen, bei dem der MACD von Kauf auf Verkauf wechselt und umgekehrt. Er ist der Cousin des Oszillator-Prädiktors. Wenn Sie eine Position zu dem Zeitpunkt kennen, dann müssen der genaue Preis, die aktuelle und die nächste (zukünftige) Spalte den MACD-Crossover erreichen.
FREE
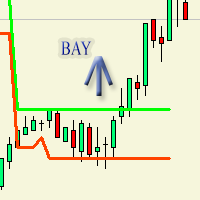
Der Indikator war ursprünglich für einen Handelsroboter gedacht, der in Zukunft veröffentlicht werden soll. Zeichnet eine Fläche auf dem Chart. Das heißt, der Rest des Trends. Sehr deutlich drückt eine flache durch Standard-Parameter. flateWigth - zulässige Breite oder Differenz zwischen den Balken, um die der Indikator ein Flat zählt. Der Indikator arbeitet in Echtzeit. Sie können es in den Tester für einen klaren Blick auf die Arbeit laufen.
FREE

Dieser Indikator zeigt potenzielle Kursniveaus, Unterstützungs- und Widerstandsniveaus, höchste und niedrigste Kursniveaus für asiatische, europäische und amerikanische Sitzungen an. Er funktioniert für den Tag, den Sie auf der Benutzeroberfläche auswählen. Er ist geeignet für Gold, Bitcoin, alle Währungen, Rohstoffe, Kryptowährungen und alle Anlageinstrumente auf dem Metatrader. Sie können auf den Tag Handel Transaktionen leicht zu verwenden. Dieser Indikator ist für metatrader4 Plattform.
FREE
Wie wir wissen, speichern МТ4 und МТ5 keine Tick-Historie, die für die Entwicklung von Handelsstrategien und Marktanalysen notwendig sein kann. Ich habe eine Methode entwickelt, mit der Sie die Tick-Historie sehr einfach erhalten können. Der Indikator sammelt den Tickverlauf in Echtzeit und schreibt ihn in die Datei XXXXXX2.hst, wobei XXXXXX ein Symbolname ist. Diese Datei kann verwendet werden, um einen Offline-Chart oder etwas anderes zu erstellen. Wenn Sie einen Handelsroboter verwenden, star
FREE
Search for an entry with low risk for trading by Lisek Moving Average Indicator. There are many ways to trade with Lisek Moving Average Indicator: Trend continuation (Trend trading). Trade pullbacks (Range trading). Trade breakouts. Trade reversals. Take profits or set stop-loss based on your MA.
Moving Averages are a frequently used technical indicator in forex trading, especially over 10, 50, 100, and 200 periods. Moving Averages are lagging indicators, which means they don't predict where pr
FREE
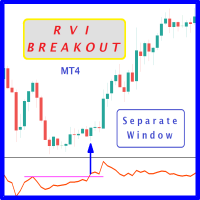
Es besteht die Wahrscheinlichkeit, dass höhere Kurse verzeichnet werden, wenn der RVi aus dem historischen Widerstandsniveau des Oszillators ausbricht. Es wird dringend empfohlen, Kursausbrüche mit Oszillatorausbrüchen zu bestätigen, da sie vergleichbare Auswirkungen haben wie das Durchbrechen von Unterstützungs- und Widerstandsniveaus durch den Kurs; sicherlich werden Short-Trades die gleiche Wahrnehmung haben. Der Vorteil ist, dass der Oszillatorausbruch oft dem Preisausbruch vorausgeht, was e
FREE

Der Indikator misst die Volumina auf verschiedenen Charts und Instrumenten. Sein Hauptvorteil ist die Fähigkeit, verschiedene Broker zu vergleichen. Je weniger Middle Volume und Tick / Second , desto zuverlässiger ist der Broker. In der oberen linken Ecke befindet sich ein Kommentar Kommentar Daten: Tick/Sekunde - Anzahl der Ticks pro Sekunde für ein ausgewähltes Instrument Mittleres Volumen - durchschnittliches Volumen im vorletzten Balken Mit diesem Indikator lässt sich die relative Marktaktiv
FREE

Was ist Macro Kill Boxer? Macro Kill Boxer ist ein Indikator für die technische Analyse, der für die MetaTrader-Plattform entwickelt wurde. Er visualisiert Marktbewegungen während bestimmter Zeitintervalle (z.B. Asien, London Open/Close, New York AM/PM), indem er farbige Boxen auf dem Chart zeichnet. Jedes Kästchen steht für die Höchst- und Tiefstkurse innerhalb des definierten Zeitraums, die oft mit makroökonomischen Ereignissen oder Sitzungen mit hoher Volatilität verbunden sind. Was wird dami
FREE
Der ATR-Strategie-Multiplikator wurde entwickelt, um Händlern zu helfen, die Marktvolatilität unter Verwendung der Average True Range (ATR) über mehrere Zeitrahmen hinweg zu bewerten. Er berechnet und zeigt die ATR-Werte zusammen mit den empfohlenen Stop-Loss- (SL) und Take-Profit-Niveaus (TP) auf der Grundlage der ATR an. Diese Niveaus sind für die Festlegung von Parametern für das Risikomanagement und die Optimierung von Handelsstrategien unerlässlich.
Parameter: Indikator-Parameter : ATR-Zei
FREE

...................................................................................................................... ............rsi................ ...........................................rsi für die Zeiten M30 und D1............................................. ...............................fast jeder verwendet rsi bei 1 Zeitrahmen aber.............................. ..................................wenn wir 2mal rsi haben, was man sehen kann ................................... Ich schre
FREE

Dieser Indikator zeigt in einem Unterfenster den Trend in den Zeitrahmen M1, M5, H1, D1 basierend auf MA, MACD, Stochastic Auf diese Weise können Sie in verschiedenen Zeitfenstern sehen, was passiert. Dies ist mein erster kostenloser Indikator. Bitte folgen Sie mir, ich werde hier einige mehr setzen. Vielen Dank für Ihre Aufmerksamkeit . . . . . .
lfknglkslksnlgslgnsflgjrpoesv ,msv lkrjpfjésmdg sd.npo4wsmdglknsp4jwpkeégmfs.lkmp Danke
FREE

Der Indikator mit Setup-Warnungen von Larry Williams, dem es 1987 gelang, bei einer Handelsmeisterschaft 10.000 Dollar in 1.100 Dollar zu verwandeln, und der dies bewies, indem er seine Tochter, die Schauspielerin ist, den gleichen Schaden am Markt anrichten ließ! Der Durchschnitt von 9 oben ist kaufen, unten ist verkaufen, so einfach ist das! Mit akustischen und visuellen Alarmen für Kauf, Verkauf und Flat bleiben Sie in Position, bis der Alarm Ihre Position umkehrt. Wir empfehlen den Einsatz a
FREE
MetaTrader Market - der einzige Shop, in dem man Handelsroboter als Demoversion herunterladen und testen sowie anhand historischer Daten optimieren kann.
Lesen Sie die Beschreibung und Bewertungen anderer Kunden über das gewünschte Produkt, laden Sie es direkt ins Terminal herunter und erfahren Sie, wie man einen Handelsroboter vor dem Kauf testet. Nur bei uns können Sie ein Programm testen, ohne dafür zu bezahlen.
Sie verpassen Handelsmöglichkeiten:
- Freie Handelsapplikationen
- Über 8.000 Signale zum Kopieren
- Wirtschaftsnachrichten für die Lage an den Finanzmärkte
Registrierung
Einloggen
Wenn Sie kein Benutzerkonto haben, registrieren Sie sich
Erlauben Sie die Verwendung von Cookies, um sich auf der Website MQL5.com anzumelden.
Bitte aktivieren Sie die notwendige Einstellung in Ihrem Browser, da Sie sich sonst nicht einloggen können.