Technische Indikatoren für den MetaTrader 4 - 25

Mit diesem Indikator können Sie 1 den Trend erkennen und die großen und kleinen Trends durch Einzeichnen von Linien verfolgen. Wenn der Kurs den Korridor der Linien verlässt, dann wird der Kurs mit hoher Wahrscheinlichkeit zur nächsten Linie gehen und auf dieser umkehren. 2 Long-Linie - Legen Sie Linien entlang der Zentren von Fraktalen, kann der Indikator das Fraktal des zweiten Punktes erkennen (Zahlenbalkenanalyse). Oft nähert sich der Kurs der Linie sogar nach einer Woche oder einem Monat u
FREE

Mit diesem Indikator können Sie problemlos Preisregionen in allen Zeitzonen bilden. Darüber hinaus können Sie mit dem automatischen Angebot-Nachfrage-Finder sicherstellen, dass die neuen Regionen automatisch gefunden werden. Sie können Ihre Transaktionsqualität erhöhen, indem Sie mit diesem Hilfstool und Indikator genauere Operationen erreichen.
Ich stelle Ihnen die Testversion von EURUSD kostenlos zur Verfügung. Wenn Sie die Arbeitsversion in allen Paritäten kaufen möchten, können Sie mich ko
FREE

Einführung in den universellen Segmentierungsindikator: Die universelle Liniensegmentierung basiert auf zwei ineinander verschlungenen Durchschnittswerten, die sich an der goldenen und der toten Gabel als Standard orientieren, wobei die Hoch- und Tiefpunkte auf beiden Seiten der goldenen und der toten Gabel miteinander verbunden sind, um sich zu einer Liniensegmentierung zu öffnen. Dieser Indikator kann auf verschiedene Parameter der Multi-Level-gestapelt verwenden eingestellt werden. Das Prinz
FREE

HINWEIS!! Das Trendvotum und die Kauf-/Verkaufsoption müssen in die gleiche Richtung gehen, bevor Sie einen Handel tätigen!!!
Indikator, der Kalman-Filter verwendet (wie bei autonomen Fahrzeugen für die Datenfusion zwischen verschiedenen Sensoren/Technologien wie RADAR, LIDAR und Kamera mit künstlicher Intelligenz für die Objekterkennung), indem er den Höchst- und Tiefstpreis verwendet, um Kauf- und Verkaufssignale zu identifizieren, wie auf dem Diagramm angezeigt.
Dieser Indikator kann auf je
FREE

Der "MACD Trend Follower" ist ein Indikator, der auf dem MACD-Oszillator basiert. Er dient dazu, die Trendrichtung zu erkennen, indem er ihr eine feste Farbe gibt, bis sich der Trend ändert (die Farben der Trendrichtung sind anpassbar). Die MACD-Standardeinstellungen für den Indikator wurden geändert, um sie an den sich schnell bewegenden Forex-Markt anzupassen, können aber je nach Bedarf des Händlers geändert werden.
Empfohlene Einstellungen für den Indikator : - MACD Fast EMA : 8 Perioden. -
FREE
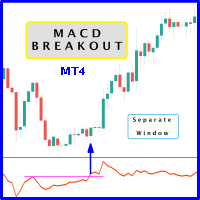
Wenn der MACD aus dem historischen Widerstandsniveau des Oszillators ausbricht, ist die Wahrscheinlichkeit höherer Kurse gegeben. Es ist ratsam, den Preisausbruch mit dem Oszillatorausbruch zu bestätigen, da sie vergleichbare Auswirkungen haben wie das Durchbrechen von Unterstützungs- und Widerstandsniveaus durch den Preis; sicherlich werden Short-Trades die gleiche Wahrnehmung haben. Der Vorteil ist, dass der Oszillatorausbruch oft dem Preisausbruch vorausgeht und somit ein frühzeitiger Hinweis
FREE
Übersicht Der True Strength Index (TSI) Indikator ist ein Momentum-Oszillator, der in einem separaten Fenster in MT4 angezeigt wird. Er glättet das Momentum (MTM) und dessen Absolutwert mittels zweier aufeinanderfolgender Exponential Moving Averages (EMAs) und berechnet anschließend deren Verhältnis multipliziert mit 100. Der TSI hilft, die Stärke eines Trends und mögliche Wendepunkte im Markt zu visualisieren. Hauptfunktionen Duale EMA-Glättung zur Reduzierung von Rauschen und Erzeugung einer s
FREE

Was ist der Super Ichi-Indikator? Super Ichi ist eine fortschrittliche Kombination der Indikatoren Ichimoku Kinko Hyo und SuperTrend. Dieses leistungsstarke technische Analyseinstrument wurde entwickelt, um Markttrends zu erkennen und Handelssignale zu generieren. Was leistet es? Zweistufige Trendanalyse : Verwendet angepasste Versionen der Tenkan-sen- und Kijun-sen-Linien Automatische Signalerzeugung : Zeigt visuelle Markierungen (Pfeile) an Überkreuzungspunkten an Echtzeit-Warnsystem : Liefert
FREE

Erschließen Sie sich intelligenteres Trading mit Triple Candle Trend! Hören Sie auf, Signalen hinterherzujagen, und beginnen Sie, mit Zuversicht und Gelassenheit zu handeln. Der Triple Candle Trend-Indikator ist Ihr All-in-One-System, das das Marktrauschen durchbricht und Einstiegspunkte mit hoher Wahrscheinlichkeit liefert. Wir verlassen uns nicht auf einen einzigen Faktor, sondern kombinieren die Kraft von drei Bestätigungsinstrumenten zu einem klaren Signal! Warum Sie diesen Indikator brauch
FREE

Supply and Demand Channels Indicator für MetaTrader: Machen Sie Ihren Handel mit Klarheit und Genauigkeit Der Supply and Demand Channels Indicator für MetaTrader ist ein fortschrittliches Tool, das Händlern einen klaren und präzisen Überblick über die wichtigsten Angebots- und Nachfragezonen auf dem Markt bietet. Dieser Indikator basiert auf dem fundamentalen Prinzip des Gesetzes von Angebot und Nachfrage und bietet eine einzigartige grafische Interpretation der Kräfte, die die Preisbewegungen a
FREE
Free Pro Level Indikator ist für die automatische Konstruktion von Unterstützungs- und Widerstandsniveaus konzipiert. Vorteile des Indikators: sowohl für erfahrene Trader als auch für Anfänger geeignet; einfach zu bedienen; Die Niveaus werden nicht neu gezeichnet; die Wahrscheinlichkeit einer Kursreaktion bei Berührung des Niveaus liegt bei über 80%; kostenlos. Der kostenlose Pro-Level-Indikator hat nur 5 Punkte als Eingabeparameter: Minimale Kerzenlänge in 5-stelligen Punkten - der Hauptparamet
FREE
Mouse Calculation berechnet schnell den Gewinn/Verlust jeder Order, wenn sie zum vom Mauszeiger angezeigten Preis geschlossen würde. Ideal für schnelle Entscheidungen bei vielen Orders wie Grid, Martingale und gestaffelten Einstiegen. Break-even und Zielpreise auf einen Blick. Hauptfunktionen Mouse PnL (M) : Vorschau von P/L je Order und insgesamt (inkl. swap). Break even Price (B) : Anzeige des Break-even-Preises / der Break-even-Linie des Gesamtkorbs. Time_Sync_Lines (T) : Gleiche Tageszeit üb
FREE
** Alle Symbole x Alle Zeitrahmen scannen nur durch Drücken der Scanner-Taste ** *** Kontaktieren Sie mich , damit ich Ihnen eine Anleitung schicken und Sie in die "RSI-Scanner-Gruppe" aufnehmen kann, damit Sie Ihre Erfahrungen mit anderen Nutzern teilen oder sehen können.
Einführung RSI-Divergenz ist eine wichtige Technik die verwendet wird, um die Trendumkehr zu bestimmen, wenn es Zeit ist, zu verkaufen oder zu kaufen, weil die Preise wahrscheinlich fallen oder in den Charts steigen werden.

Dieser Indikator zeichnet regelmäßig bullische und bärische Divergenzen in Echtzeit in die Charts ein. Der Algorithmus zur Erkennung dieser Divergenzen basiert auf meiner über 10-jährigen Erfahrung mit der visuellen Erkennung von Divergenzen. Die Divergenzen werden als grüne und rote Rechtecke auf den Charts dargestellt. Sie können im visuellen Modus des Strategietesters sogar Vorwärtstests durchführen. Diese KOSTENLOSE Version ist auf EURUSD und GBPUSD beschränkt. Die Vollversion ohne Einschrän
FREE
Der Indikator kann mit jedem Zeitrahmen und Forex-Paar verwendet werden. Ein einfach zu bedienender Parameter im Indikator ermöglicht es Ihnen, die Signale an jedes Forex-Paar und jeden Zeitrahmen anzupassen, mit dem Sie handeln möchten.
Die Pfeile wiederholen sich nicht!
Informationstafel: Wir haben diesen Indikator mit einem benutzerfreundlichen Panel ausgestattet. Auf der einen Seite des Panels wird der Zeitrahmen angezeigt, während auf der anderen Seite das Währungspaar zu sehen ist. Daru

Dieser Indikator zeigt, dass die Preisveränderung von Finanzinstrumenten KEIN Random-Walk-Prozess ist, wie es die "Random-Walk-Hypothese" behauptet und wie es der Bestseller "A Random Walk Down Wall Street" propagiert. Ich wünschte, das wäre der Fall! Hier wird gezeigt, dass die tatsächliche Situation bei Preisveränderungen viel schlimmer ist als ein Random-Walk-Prozess! Trügerische Marktpsychologie und das Tauziehen zwischen Bullen und Bären stapeln die Chancen gegen die Händler in allen Instru
FREE
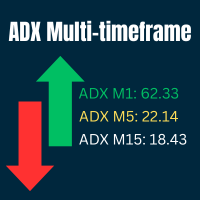
Ultimativer ADX-Multi-Zeitrahmen-Indikator Dieser Indikator liefert Echtzeit-ADX-Werte für mehrere Zeitrahmen in einem unauffälligen Beschriftungsfeld. Er ist besonders nützlich, um die Trendstärke über mehrere Zeitrahmen hinweg abzuschätzen, ohne ständig die Charts wechseln zu müssen. Wählen Sie aus, welche Zeiträume angezeigt werden sollen, verankern Sie das Panel an einer beliebigen Chartecke und kodieren Sie die ADX-Stärkestufen farblich nach Ihrem Geschmack. Hauptmerkmale & Personalisierung
FREE

Beschreibung:
Dieser Indikator (mit seinem Algorithmus) markiert relative Hochs und Tiefs, die eine Reihe von nützlichen Anwendungen haben.
Dieser Indikator wird nie neu gezeichnet.
Eigenschaften:
Markiert relative Hochs und Tiefs Verwenden Sie diesen Indikator, um Punkte der Trendfortsetzung zu bestimmen, d. h., wo der Trend einen Rückzieher machen könnte, bevor er über diesen Punkt hinaus weiter steigt oder fällt. Oder verwenden Sie diese Funktion, um potenzielle Umkehrpunkte zu bestimmen
FREE
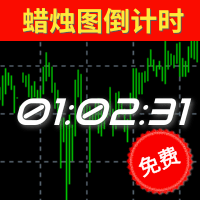
Countdown-Indikator Merkmale Kategorie
Erläuterung
Bemerkungen
Erwarteter End-Countdown Berechnet die Endzeit der aktuellen Candlestick-Periode (kann auf alle Perioden angewendet werden), wobei berücksichtigt wird, dass die Candlestick aufgrund von täglichen Marktschließungen früher enden kann; Falls die Kerze mehrere Schließungen und Eröffnungen enthält, wird die letzte Schließung oder der letzte Kerzenschlusszeitpunkt verwendet. Es ist erwähnenswert, dass: dieser Indikator nicht berücksich
FREE

Bitte überprüfen Sie regelmäßig die Registerkarte "What's new " für eine vollständige und aktuelle Liste aller Verbesserungen + Parameter. KOSTENLOSER Indikator für mein Handelsprogramm Take a Break . Dieser Indikator ermöglicht es Ihnen, mehrere andere EAs mit nur einer Take a Break EA-Instanz zu verwalten. Geben Sie einfach die entsprechende Chart-Gruppe in den Indikator(en) und den Take a Break EA-Einstellungen an und schon kann es losgehen.
Setup-Beispiele (Indikator + EA)
Als Voraussetzun
FREE

Der Indikator basiert auf dem klassischen CCI-Indikator. Ich empfehle, meinen Berater zu beobachten - Night Zen EA Zeichnet seine Signale nicht neu. Es gibt Alarme für das eingehende Signal. Er enthält 2 Strategien: Eintritt der CCI-Linie in die überkaufte Zone (für Kauftrades ) / in die überverkaufte Zone (für Verkaufstrades ) Ausstieg der CCI-Linie aus dem überkauften Bereich (für Verkaufstrades) / aus dem überverkauften Bereich (für Kauftrades)
Einstellungen: Name Einstellung Beschreibung Ze
FREE

Dieser Scanner überwacht den gesamten Markt auf Ichimoku-Handelsmöglichkeiten für alle Symbole und alle Zeitrahmen. Sie müssen nicht alle Charts, alle Symbole und alle Zeitrahmen im Auge behalten. Dieser Scanner alarmiert Sie auf Ihrem Computer oder auf Ihrem Handy, wenn eine Handelsmöglichkeit gefunden wurde. Sie müssen nie wieder eine Handelsmöglichkeit verpassen! Dieser Indikator wurde entwickelt, um alle Paare und Symbole für alle ausgewählten Zeitrahmen zu scannen, um ein Tenkan- und Kijun-

Graphic Shapes - unter Verwendung der Historie werden vier Arten von grafischen Formen projiziert, die es Ihnen ermöglichen, die wichtigsten Bereiche der zukünftigen Preisbewegung zu bestimmen, sowie die wichtigsten Marktumkehrungen zu verstehen und gleichzeitig Einstiegspunkte nach Priorität zu bestimmen. Sie ermöglichen es Ihnen, eine vollständige Marktanalyse durchzuführen, ohne zusätzliche Tools zu verwenden! Der Indikator ist ein leistungsfähiges Instrument zur Vorhersage von Preisbewegunge
FREE

Indikator : Forex Reversal Trend Der Indikator hilft Investoren, den frühesten und perfekten Umkehrpunkt zu identifizieren. Einfach zu treffende Entscheidung, mit dem Trend zu handeln Price Action Trading. Durch technische Analyse erstellt der Roboter eine kurzfristige Strategie, um die optimale Einstiegsposition zu bestimmen. Version PRO: https: //www.mql5.com/en/market/product/70867 Telegramm: https://t.me/tForexSniper
FREE
WAS IST DER NÄCHSTE SCHRITT? DIE EINFACHE ANTWORT IST, DASS DIESES PROGRAMM AUF DER PREISAKTION BASIERT UND ES DAHER EINFACH IST, DIE NÄCHSTE BEWEGUNG ZU IDENTIFIZIEREN. DIESES PROGRAMM VERWENDET STANDARDBERECHNUNGEN FÜR UNTERSTÜTZUNG UND WIDERSTAND IN FORM VON 2 MÖGLICHKEITEN TRENDLINIEN AUSWÄHLEN HORIZONTALE LINIEN TRENDLINIEN LEITEN DEN HÄNDLER AN, IN EINEM BEREICH ZU HANDELN, DER AUCH DIE PIVOT-EBENE ENTHÄLT HORIZONTALE LINIEN FÜHREN SIE ÜBER DIE UNTERSTÜTZUNG UND DEN WIDERSTAND IN VERSCHIE
FREE
Hören Sie auf, Trends zu verfolgen, und fangen Sie an, Umkehrungen zu erkennen: Der Stochastic Sniper stellt sich vor Haben Sie es satt, seitwärts laufende Märkte zu handeln oder von falschen Ausbrüchen überrascht zu werden? Der Stochastic Sniper Indikator wurde für einen präzisen Einstieg entwickelt. Er kombiniert die Volatilitätskanäle der Keltner-Bänder mit dem Momentum-Timing des Stochastik-Oszillators , um extreme Preisumkehrungen mit hoher Genauigkeit zu erkennen. Stellen Sie sich vor, Si
FREE
Hochgradig konfigurierbarer Bollinger Bands Indikator. Merkmale: Hochgradig anpassbare Alarmfunktionen (bei Levels, Kreuzen, Richtungsänderungen per E-Mail, Push, Sound, Popup) Multi-Timeframe-Fähigkeit Farbanpassung (bei Niveaus, Kreuzen, Richtungswechseln) Option für lineare Interpolation Funktioniert im Strategie-Tester im Multi-Timeframe-Modus (auch am Wochenende ohne Ticks) Parameter:
Bollinger Bands Timeframe: Sie können den unteren/höheren Zeitrahmen für Bollinger Bands festlegen. Bollin
FREE

Range-Bound & Reversal-Strategien Dashboard (MT4) Handeln Sie saubere Umkehrungen mit Vertrauen.
Dieser MT4-Indikator scannt 20 wichtige Instrumente in Echtzeit und ermittelt hochwahrscheinliche Gelegenheiten für Range- und Mean-Reversal-Strategien und stellt alles in einem einfachen, professionellen Dashboard dar. Warum Trader ihn lieben 10 bewährte Setups in einem Tool
Support/Resistance Bounce, Bollinger Mean Reversion, RSI OB/OS, MACD Turn, Stochastic OB/OS, CCI Extreme, Daily Pivot S/R, Kel
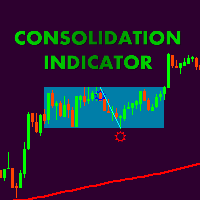
Сonsolidation Box Indikator mit der Möglichkeit der flexiblen Einstellungen nach den Anforderungen der Traider. Es ist auch möglich, den Indikator in EA einzubetten. Ich danke Alexey Mavrin für die Realisierung der technischen Aufgabe. Nach der klassischen technischen Analyse ist der Preis in Bewegung, ohne eine klare Richtung für fast 70% der Marktzeit und Methoden der Gewinnung von flachen sollte im Arsenal eines jeden Händlers sein. Preiskonsolidierung - sind Perioden des Marktgleichgewichts,

Präzisionshandel mit fortschrittlicher Marktanalyse! Verschaffen Sie sich einen Vorteil im Devisenhandel mit einer umfassenden Analyse-Suite, die Ihnen hilft, Volatilität zu kategorisieren, Swing-Längen abzuschätzen und datengestützte Entscheidungen auf der Grundlage des historischen Marktverhaltens zu treffen. Hauptmerkmale: Erweiterte Swing-Erkennung
Passen Sie die Empfindlichkeit gegenüber Kursbewegungen an, indem Sie die für einen neuen Swing erforderlichen Mindesttakte und Kursv
FREE
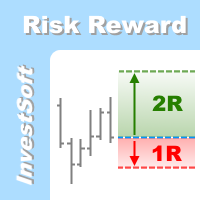
Dies ist die Forex visuelle Aufträge Werkzeug & Forex Positionsgröße (Lot) Rechner mit intuitiven Panel. Risk Reward Ratio Indicator funktioniert mit allen Arten von Symbolen: Währungspaare, Indizes, Metalle, Rohstoffe, Kryptowährungen, etc.
Wenn Sie sich vergewissern möchten, dass Risk Reward Ratio Indicator auf Ihren Lieblingssymbolen funktioniert, kontaktieren Sie uns (besuchen Sie unser Profil ) und fordern Sie eine kostenlose 7-Tage-Testversion an, um dieses Tool ohne Einschränkungen zu t

Indikator (beinhaltet Volumenprofil + Orderblöcke) - ein revolutionärer Indikator, der zwei der leistungsfähigsten Konzepte der modernen technischen Analyse kombiniert: Volumenprofile und Orderblöcke institutioneller Akteure. Mit diesem Tool können Sie sehen, was den meisten Händlern verborgen bleibt, und Sie erhalten einen bedeutenden Vorteil auf dem Markt.
Die wichtigsten Vorteile des Indikators: Visualisierung von "intelligentem Geld": Zeigt deutlich die Bereiche, in denen sich große Marktte

Der Zig-Zag-basierte Level-Indikator ist ein hochpräzises Werkzeug für den Forex-Handel, das Ihnen helfen wird, Ihre Strategie zu verbessern und präzisere Entscheidungen zu treffen. Er verwendet den Zig-Zag-Algorithmus, um verschiedene Unterstützungs- und Widerstandsniveaus auf dem Markt zu identifizieren, anhand derer Sie bestimmen können, wann es am besten ist, in einen Handel einzusteigen oder ihn zu beenden.
Dieser Indikator zeichnet sich durch eine hohe Leistung und Genauigkeit bei der Be
FREE
Ist Zero Lag profitabel? Nicht immer, verschiedene Systeme sind für verschiedene Paare. Sie können mit diesem Indikator von Mladen herumspielen, ich habe ihn mit Bollinger Bands über T3 modifiziert.
Sie können den Zeitraum und die Art der Berechnung ändern. MT5 Version ist auch verfügbar.... Bitte hinterlassen Sie eine Bewertung, es hilft uns und wir werden mehr Indikatoren teilen. .... Vielen Dank und viel Spaß beim Trading
FREE

Dieser Indikator integriert die Bollinger-Band-Strategie in die Berechnung mit einer Volume-Over-MA
Berechnung, um die "Areas of Interest"-Ebenen für eine potenzielle Re-Test-Zone auf der rechten Seite des Charts weiter einzugrenzen.
Wir fügten eine Berechnung des gleitenden Durchschnitts für eine mehrstufige Wolke hinzu und schlüsselten weitere Bedingungen auf, um sowohl
Volumenfluss-Crossover auf den hohen und extrem hohen MAs als auch hohe und extrem hohe Volumenspitzen auf den festgelegten
FREE

Die "Stimmung der Händler" auf den Finanzmärkten ist ein Thema, das uns schon seit langem beschäftigt. Im Laufe der Zeit konnten wir jedoch nicht die richtige Formel finden, um diese Stimmungen zu definieren. Auf der Suche nach der richtigen Methode haben wir viele Stufen durchlaufen - von der Übernahme von Daten aus externen Quellen zur Berechnung der offenen Positionen von Käufern und Verkäufern bis hin zur Berechnung des Tick-Volumens, aber wir waren immer noch nicht zufrieden mit den Ergebni

Der Indikator findet starke Trendbewegungen eines Währungspaares über die angegebene Anzahl von Balken. Er findet auch Korrekturen zu diesem Trend. Wenn der Trend stark genug ist und die Korrektur den in den Parametern angegebenen Werten entspricht, erzeugt der Indikator ein Signal. Sie können verschiedene Korrekturwerte einstellen, wobei sich die Werte 38, 50 und 62 (Fibonacci-Levels) am besten eignen. Darüber hinaus können Sie die Mindestlänge des Trends, die Anzahl der Verlaufsbalken für die
FREE

Der Indikator zeigt den Nulldurchgang des gleitenden Durchschnitts des Oszillators (OsMA) in Form von Pfeilen an. Der Indikator benachrichtigt über ein Signal durch ein Pop-up-Alarm-Fenster oder durch das Senden einer Benachrichtigung per E-Mail.
Parameter Schneller EMA Zeitraum - schneller EMA. Dies ist ein exponentieller gleitender Durchschnitt eines Preises mit einer kurzen Periode. Langsamer EMA Zeitraum - langsamer EMA. Hierbei handelt es sich ebenfalls um einen exponentiell gleitenden Dur
FREE

Der Bullish and Bearish Engulfing Pattern Screener für MetaTrader 4 ist ein leistungsstarkes Tool für Händler, die wichtige Umkehrmuster an den Finanzmärkten erkennen möchten. Dieser Indikator durchsucht Preisdiagramme nach bullischen und bearischen Engulfing-Mustern, die potenzielle Trendumkehrungen signalisieren. Hauptmerkmale: Scannen in Echtzeit : Analysiert fortlaufend die Kursdaten, um sofortige Warnungen zu liefern, wenn Engulfing-Muster erkannt werden. Anpassbare Einstellungen : Ermöglic
FREE

Tägliche Pivot-Punkte sind beim Handel relativ wichtig. Dieser Indikator verfügt über Optionen zur Auswahl von 5 häufig verwendeten Pivotpunktberechnungen. Benutzereingabe Wählen Sie die Pivotpunkt-Berechnung (Methode Classic, Methode Camarilla, Methode TomDeMark, Methode Fibonacci oder Methode Woodies ) . Wählen Sie den angewandten Zeitrahmen für die Berechnung (M5, M15, H1, H4, D1, W1 usw.) Kann mit jedem Zeitrahmen verbunden werden Wählen Sie die Farbe des Pivot-Punktes Für die MT5 Version, b
FREE
Bitte vor dem Kauf lesen: - Wir haben keine Details des Käufers, wenn der Kauf gemacht wurde. Um die Boni zu erhalten, müssen Sie mich über Produktkommentar (nicht Produktbewertung) zu kontaktieren. Auf diese Weise werde ich Sie zurück über mql Nachricht fragen nach E-Mail kontaktieren. - Bitte vergewissern Sie sich, dass Sie den Empfang von Nachrichten aus der Nicht-Freundesliste aktivieren, sonst kann ich Sie nicht per E-Mail kontaktieren. Dieser Indikator ist nicht nur über Smart Money Konzep
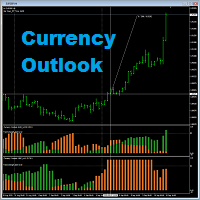
Currency Outlook ist ein Indikator, der uns helfen kann, "das richtige Paar in der richtigen Richtung und zum richtigen Zeitpunkt zu handeln". Dieser Indikator analysiert die Preise aller Cross-Währungspaare der ausgewählten Währung und meldet uns das Ergebnis in Form eines zweifarbigen Histogramms. Die maximale Höhe des Histogrammdiagramms des Indikators beträgt 100. Der Indikator ist ausschließlich für AUD, CAD, CHF, EUR, GBP, JPY, NZD und USD programmiert. Er kann in jedem Zeitrahmen im MT4 a

Broken Trends ist ein Indikator für Scalper und Intraday-Trader. Der Indikator wählt die Trendstufen aus und zeigt sie im Echtzeitmodus auf dem Chart an. Der Indikator reagiert auf das Kursmomentum: Er beginnt mit der Suche nach Trends, sobald die Momentum-Amplitude den in einem speziellen Parameter festgelegten Schwellenwert überschreitet. Der Indikator kann auch einen Ton abspielen, wenn der Preis die aktuelle Trendlinie überschreitet. Im normalen Modus zeigt der Indikator nur einen (zuletzt g
FREE

Hello, I need reviews from you guys. Thank you Der Fractal Swing Detector Pro Indikator wurde entwickelt, um Händlern dabei zu helfen, wichtige Schwungpunkte auf dem Markt zu identifizieren . Durch die Kombination von Fraktal- und Pivot-Analyse bietet dieser Indikator tiefere Einblicke in Kursbewegungen und potenzielle Umkehrpunkte . Hauptmerkmale: Fraktalanalyse : Identifizieren Sie hohe und niedrige Fraktale mit der Option, entweder 3 oder 5 Balken-Fraktale zu verwenden . Fraktale helfen, kle
FREE

Das Indikatoranalysesystem ZhiBiJuJi verwendet eine leistungsfähige interne Schleife, um seine eigenen externen Indikatoren aufzurufen, und ruft die Analyse dann vor und nach dem Zyklus auf. Die Datenberechnung dieses Indikatoranalysesystems ist sehr kompliziert (Aufruf vor und nach dem Zyklus), so dass die Hysterese des Signals reduziert wird und die Genauigkeit der Vorausschätzung erreicht wird. Dieser Indikator kann in allen Zyklen des MT4 verwendet werden und eignet sich am besten für 15 Min
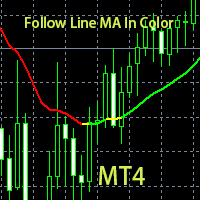
Das ist die eigene indikatoren auf der grundlage der farbe erkennen.
Wenn die farbe grün Lange single.
Wenn farbe IST ROT, Kurz allein.
Wenn die farbe Gelb, sagte zitate zu umkehr, die besten positionen oder die Short - positionen.
Das ist nach einer Langen phase der single folgen Hohe Genauigkeit bei der Hand, geschrieben, dann nach einer farbe Guter indikator indikator für die richtung der beschränkungen, keine Zeit, Geld. Aktuellen index am besten auf 15 minuten, 30 minuten, 1 stunde, 4 s
FREE

Dieser Indikator basiert auf den Ideen von Dan Valcu.
Kerzenkörper (offen-geschlossen) sind die Hauptkomponente, die verwendet wird, um Trendrichtung, Stärke und Umkehrungen anzuzeigen und zu bewerten.
Der Indikator misst die Differenz zwischen Heikin Ashi schließen und öffnen.
Die Messung der Höhe der Kerzenkörper führt zu extremen Werten, die auf Trendverlangsamungen hinweisen. Auf diese Weise wird der Heikin Ashi quantifiziert, um frühere Signale zu erhalten.
Ich habe diesen Indikator au
FREE

Supreme Stoploss ist ein Indikator für den Metatrader 4, der auf dem ATR-Indikator basiert. Er gibt Stoploss/Takeprofit als Linien an, die über und unter dem Preis gezeichnet werden, dieser Indikator malt nicht zurück und ist nicht verzögert. kann verwendet werden, um den Stop-Loss oder Take-Profit eines Handels zu bestimmen, indem der ATR-Wert mit der vom Benutzer festgelegten Zahl multipliziert wird. ==============================================================================================
FREE
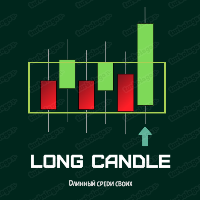
EIN INDIKATOR FÜR DIE SUCHE NACH LANGEN KERZEN. Mit diesem Indikator können Sie schnell eine Kerze finden, die sich von den anderen unterscheidet, nämlich die lange Kerze.
Wenn sich der Kurs aus dem "flachen" Momentum herausbewegt, deutet dies darauf hin, dass sich der Trend ändern will. Es ist also an der Zeit, ein Geschäft abzuschließen!
Denken Sie daran, dass nicht alle Pfeile Ihnen einen hervorragenden Einstiegspunkt garantieren. Vergewissern Sie sich, bevor Sie ein Geschäft eröffnen, das
FREE

Dieser Indikator ist eine Ergänzung zu "Trendkanten".
Der Indikator "Trend Edges Histogramm" bestimmt, ob der Trend steigend oder fallend ist. Er ist für jeden Zeitrahmen geeignet (getestet am DAX).
Finden Sie ein Trendpaar, einen Index oder CFD. Zusätzlich :
-Tonalarm bei Trendwechsel.
-Alarm-Benachrichtigung
-Alarm-Benachrichtigung auf Ihrem Mobiltelefon Sehen Sie sich meine anderen Indikatoren an.
FREE

Der Hull Moving Average (HMA), entwickelt von Alan Hull im Jahr 2005, ist einer der sich am schnellsten bewegenden Durchschnittswerte, reduziert die Verzögerung und ist einfach zu verwenden, um Trends sowohl kurz- als auch langfristig zu identifizieren. Dieser Indikator basiert auf der exakten Formel des gleitenden Hull-Durchschnitts mit 3 Phasen der Berechnung: Berechnung des gewichteten gleitenden Durchschnitts (WMA_01) mit Periode n/2 & (WMA_02) mit Periode n Berechnen Sie RAW-HMA: RAW-HMA =
FREE
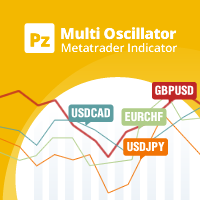
Der Multi-Oscillator ist das ultimative Schweizer Taschenmesser für den Handel mit mehreren Währungen und Zeiträumen. Es zeichnet Ihren gewünschten Oszillator für viele Währungspaare und / oder Zeiträume in einem einzigen Diagramm auf. Es kann zum Handel mit statistischer Arbitrage, als Marktscreening-Tool oder als verfeinerter Multi-Timeframe-Indikator verwendet werden. [ Installationsanleitung | Update-Anleitung | Fehlerbehebung | FAQ | Alle Produkte ] Einfache Interpretation und Konfiguratio
FREE

Der Blahtech Moving Average Indikator ist eine Multitimeframe Version des Standard Moving Average Indikators. Er ist außerdem mit anpassbaren Alarmen, Periodenbrüchen und anderen Konfigurationsoptionen ausgestattet. Die gleitenden Durchschnitte der 50- und 200-Tage-Linie werden von Anlegern und Händlern häufig verfolgt, wobei Durchbrüche über und unter den MA-Linien als interessante Signale gelten. Links [ Installieren | Aktualisieren | Training | Alle Produkte ]
Funktions-Highlights Bis zu dre
FREE
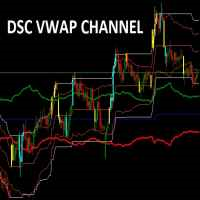
Corretora recomendada para usar esse indicador: https://tinyurl.com/5ftaha7c
Indikator für die Anzeige von Widerstandspunkten im Bild. Funktioniert in allen Bereichen und Zeiträumen.
Erkennen Sie genau die Eingangs- und Ausgangspunkte Ihrer Operationen. S EHEN SIE UNSERE ERGEBNISSE AUF INSTAGRAM: https: //www.instagram.com/diogo.cansi/ TELEGRAMMGRUPPE = https://t.me/robosdsc Mehr Informationen per E-Mail dscinvestimentos@gmail.com oder per Whatsapp 55-991372299
FREE

Macd Prädiktor Macd 's Haupt-Chart-Indikator Wenn Sie diesen Indikator mögen, ist Dinapoli Levels Expansion and Retracement Demo ein hilfreiches Werkzeug :https://www.mql5.com/en/market/product/35884
1. Sie können den Preis bestimmen, bei dem der MACD von Kauf auf Verkauf wechselt und umgekehrt. Er ist der Cousin des Oszillator-Prädiktors. Wenn Sie eine Position zu dem Zeitpunkt kennen, dann müssen der genaue Preis, die aktuelle und die nächste (zukünftige) Spalte den MACD-Crossover erreichen.
FREE

Suchen Sie nach einem Einstieg mit geringem Risiko für den Handel mit dem Lisek Waves Indicator. Mit dem Lisek Waves Indicator können Sie Ihre Handelsleistung verbessern. In seiner einfachsten Form erleichtert dieses Trading-Tool die Suche nach einem Einstieg mit geringem Risiko und die Verwaltung Ihres Handels und Risikos. Die Lisek-Wellen-Analyse basiert auf der Vorstellung, dass Märkte bestimmten Mustern folgen, die als Wellen bezeichnet werden und das Ergebnis eines natürlichen Rhythmus der
FREE

Der Indikator synchronisiert acht Arten von Markierungen auf mehreren Charts eines Handelsinstruments.
Dieser Indikator kann bequem in Verbindung mit "Multichart Dashboard" oder einem ähnlichen Assistenten verwendet werden, mit dem Sie gleichzeitig mit mehreren Charts arbeiten können.
"Multichart Dashboard" finden Sie unter dem Link auf meinem Youtube-Kanal.
Die Einstellungen:
Aktivieren die vertikale Liniensynchronisation
Aktivieren die horizontale Liniensynchronisation
Aktivieren die Trendlin
FREE
Was ist der Market Sessions Indicator? Der Market Sessions Indicator ist ein technisches Analysetool, das für die MetaTrader 4-Plattform entwickelt wurde. Er stellt die Handelszeiten der wichtigsten Finanzmärkte (Asien, Europa, USA und andere wichtige Sitzungen) visuell auf dem Chart dar. Indem er jede Marktsitzung mit farbigen Rechtecken markiert, hilft er den Händlern zu verstehen, welche Märkte aktiv sind und welchen Einfluss sie auf die Kursbewegungen haben. Was macht es? Visualisiert Markts
FREE

** Alle Symbole x Alle Zeitrahmen scannen nur durch Drücken der Scanner-Taste ** *** Kontaktieren Sie mich , um Ihnen eine Anleitung zu schicken und Sie in die "Divergence-Gruppe" aufzunehmen, damit Sie Ihre Erfahrungen mit anderen Nutzern austauschen oder sehen können. Einführung MACD-Divergenz ist eine wichtige Technik die verwendet wird, um die Trendumkehr zu bestimmen, wenn es Zeit ist, zu verkaufen oder zu kaufen, weil die Preise wahrscheinlich fallen oder in den Charts steigen werden. Der

KOSTENLOS Ich empfehle www.CoinexxBroker.com als einen großartigen Broker und den, den ich persönlich benutze Asien Sitzung 1:00 bis 9:00 (6pm est bis 2 am est) Eur bedeutet London Session 10:00 bis 18:00 (3 am est bis 11 am est) USA bedeutet New York Session 15:00 bis 23:00 (8 am est to 4 pm est) Der Sitzungsindikator hebt den Beginn der jeweiligen Handelssitzung hervor. Sie können alle Sitzungen anzeigen oder die Einstellungen bearbeiten, um nur die Stunden anzuzeigen, die Sie hervorheben möch
FREE

Der LexusBO-Indikator wird für den Handel mit binären Optionen empfohlen. Signale werden generiert, wenn die Indikatoren RSI, ADX und CCI die anpassbaren Werte überschreiten. Der Indikator zeigt die Signale durch Auf- und Abwärtspfeile auf dem Chart an. Ihre Werte sind in den Puffer-Arrays verfügbar (Puffer mit Index 0 - "Aufwärtspfeil", mit Index 1 - "Abwärtspfeil"). Dies erleichtert die Verwendung des Indikators für den automatisierten Handel durch spezialisierte Expert Advisors. Der empfohlen
FREE

Der Algorithmus basiert auf der Idee des Currency Power Meter-Indikators. In dieser Version ist die Anzahl der angezeigten Werte unbegrenzt, der Code ist kompakter und schneller, Werte des aktuellen Balkens können über Indikatorpuffer abgerufen werden. Was der Indikator zeigt : Ein dünnes Band und die obere Zahl vor der Währung zeigen den relativen Stärkeindex für die letzten N Stunden (N wird in den Parametern in der Variablen 'Stunden' eingestellt), ein breiteres Band zeigt den Tagesindex an
FREE
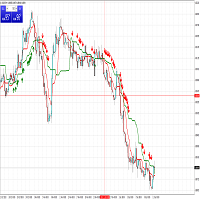
Zwei erweiterte gleitende Durchschnitte Sind Sie auf der Suche nach einem einfachen und effektiven Indikator? Er wird Ihnen helfen! Der Indikator verwendet zwei MA, um Trends zu erkennen. Benutzerhandbuch: Wenn der schnelle MA (rote Linie) den langsamen MA (grüne Linie) überquert und das erste Kaufsignal erscheint, können Sie long gehen. Wenn der schnelle MA (rote Linie) den langsamen MA (grüne Linie) unterschreitet und das erste Verkaufssignal erscheint, können Sie verkaufen.
FREE

Der Fibonacci-Indikator zeigt automatisch die Fibonacci-Retracement-Levels an, die wichtige Unterstützungs- und Widerstandsmarken darstellen. Der Bereich für die Berechnung des Indikators kann aus dem Vortag, der Woche, dem Monat, dem Jahr oder einer benutzerdefinierten Sitzung stammen.
Niveaus 100 % (Hoch) der Spanne der vorangegangenen Sitzung. 0 % (Tiefstwert) der Spanne der vorangegangenen Sitzung. 76,4 % der Spanne der vorangegangenen Sitzung. 61,8 % der Spanne der vorangegangenen Sitzung
FREE

Three Bar Break basiert auf einer Handelsmethode von Linda Bradford Raschke, die meiner Meinung nach gut geeignet ist, potenzielle künftige Kursschwankungen zu erkennen. Es wird darauf geachtet, dass das Hoch des ersten Balkens niedriger ist als das Hoch des dritten Balkens und das Tief des ersten Balkens höher ist als das Tief des dritten Balkens. Dies sagt dann voraus, dass der Markt innerhalb von 2-3 der nächsten Balken zu neuen Niveaus ausbrechen könnte. Er sollte hauptsächlich auf dem Tages
FREE

Market Calculator ist ein leistungsstarkes Tool, mit dem Sie die wichtigsten Parameter eines Handels einfach und schnell berechnen können: Lot-Größe, StopLoss und TakeProfit, sowie die Schätzung der Höhe der Mittel (erforderliche Margin) zur Eröffnung einer Position. Das Programm hat eine sehr bequeme und intuitive Steuerung, da es im Stil von OS Windows implementiert ist. Es gibt viele interessante und praktische Funktionen - schauen Sie sich einfach das Video an: youtu.be/FG2qqTJTIhE Alle Prog

Das Dashboard für symmetrische Dreiecksmuster ermöglicht es Ihnen, mehrere Märkte und Zeitrahmen gleichzeitig auf symmetrische Dreiecksmuster zu überwachen, wie sie vom hier verfügbaren Indikator für symmetrische Dreiecksmuster gezogen werden: https://www.mql5.com/en/market/product/68709/ Besuchen Sie den obigen Indikator, um mehr darüber zu erfahren, wie symmetrische Dreiecksmuster gebildet werden, und einfach zu befolgende Strategien, um sie zu handeln.
Das Dashboard ist ein eigenständiges P

ATSCStrategy ist ein vielseitiger Indikator, der sowohl für binäre Optionen als auch für Devisenmärkte entwickelt wurde. Nutzen Sie dieses dynamische Tool für Ihre Handelsstrategien und gewinnen Sie wertvolle Erkenntnisse, um in der schnelllebigen Welt der binären Optionen und des Devisenhandels fundierte Entscheidungen zu treffen.
-Forex Market
-Binary Option Market
-Binary use timeframe 1M - 5M
-Forex use timeframe M30 or high
FREE

Trend Graf ist ein Werkzeug, das Ihnen erlaubt, den Trend des aktuellen Augenblicks zu sehen, mit Startbereiche, die alle sechs Stunden erscheinen, ist in der Lage, uns die Höhe der Korrektur Grenze sowohl auf den Trend und auf die Änderung der it.Works auf alle Währungspaare! In den Einstellungen haben wir einen Offset für die Projektion der Startbereich von der aktuellen Einstellung, für jedes Währungspaar können Sie den Offset, die am besten zeigen, die Korrektur Grenze.The nächste Update wir
FREE

Manchmal muss ein Händler wissen, wann eine Kerze geschlossen wird und eine neue erscheint, um die richtigen Entscheidungen zu treffen. Dieser Indikator berechnet und zeigt die verbleibende Zeit der aktuellen Kerze an. Er ist einfach zu bedienen, ziehen Sie ihn einfach auf das Diagramm. Bitte benutzen Sie ihn und äußern Sie Ihre Meinung, denn die Äußerung Ihrer Meinung wird die Produkte fördern. Um andere kostenlose Produkte zu sehen, besuchen Sie bitte meine Seite .
FREE
MetaTrader Market - Handelsroboter und technische Indikatoren stehen Ihnen direkt im Kundenterminal zur Verfügung.
Das MQL5.community Zahlungssystem wurde für die Services der MetaTrader Plattform entwickelt und steht allen registrierten Nutzern der MQL5.com Webseite zur Verfügung. Man kann Geldmittel durch WebMoney, PayPal und Bankkarten einzahlen und sich auszahlen lassen.
Sie verpassen Handelsmöglichkeiten:
- Freie Handelsapplikationen
- Über 8.000 Signale zum Kopieren
- Wirtschaftsnachrichten für die Lage an den Finanzmärkte
Registrierung
Einloggen
Wenn Sie kein Benutzerkonto haben, registrieren Sie sich
Erlauben Sie die Verwendung von Cookies, um sich auf der Website MQL5.com anzumelden.
Bitte aktivieren Sie die notwendige Einstellung in Ihrem Browser, da Sie sich sonst nicht einloggen können.