Technische Indikatoren für den MetaTrader 4 - 24

Dieser Indikator liefert Handelssignale, die auf der Polarität der dynamischen Parameter von zwei digitalen Signalen basieren. Die dynamischen Parameter (Momentum-Beschleunigung) werden abgeleitet, indem ein hochwertiger Momentum-Oszillator, MTEMA LPD (siehe Top Gun Oscillators ), auf zwei digitale Signale angewendet wird. Der MTEMA-Momentum-Oszillator wird zunächst auf den Preis selbst angewendet. Dann wird ein Gleichrichtungsverfahren auf den Preis angewendet, das auf den Signalen des Momentum
FREE

Der Hull Moving Average (HMA), entwickelt von Alan Hull im Jahr 2005, ist einer der sich am schnellsten bewegenden Durchschnittswerte, reduziert die Verzögerung und ist einfach zu verwenden, um Trends sowohl kurz- als auch langfristig zu identifizieren. Dieser Indikator basiert auf der exakten Formel des gleitenden Hull-Durchschnitts mit 3 Phasen der Berechnung: Berechnung des gewichteten gleitenden Durchschnitts (WMA_01) mit Periode n/2 & (WMA_02) mit Periode n Berechnen Sie RAW-HMA: RAW-HMA =
FREE
Range-Bound & Reversal-Strategien Dashboard (MT4) Handeln Sie saubere Umkehrungen mit Vertrauen.
Dieser MT4-Indikator scannt 20 wichtige Instrumente in Echtzeit und ermittelt hochwahrscheinliche Gelegenheiten für Range- und Mean-Reversal-Strategien und stellt alles in einem einfachen, professionellen Dashboard dar. Warum Trader ihn lieben 10 bewährte Setups in einem Tool
Support/Resistance Bounce, Bollinger Mean Reversion, RSI OB/OS, MACD Turn, Stochastic OB/OS, CCI Extreme, Daily Pivot S/R, K

Für Händler ist die Beobachtung von Kursbewegungen eine ständige Aufgabe, denn jede Kursbewegung bestimmt, welche Maßnahmen als nächstes ergriffen werden müssen. Dieser einfache Indikator hilft den Händlern, die Kurse in einem größeren Format klarer darzustellen. Der Benutzer kann die Schriftgröße einstellen und die Farbe wählen, die im Diagramm angezeigt werden soll. Es gibt drei Farboptionen, die für die Anzeige im Diagramm ausgewählt werden können.
FREE

Zeit für den Handel Der Indikator für den Handelszeitpunkt basiert auf der Marktvolatilität durch 2 ATR-Indikatoren, um den Zeitpunkt einer Transaktion zu bestimmen. Der Indikator bestimmt die Zeiten, in denen der Markt eine starke Volatilität im Trend aufweist. Wenn das Histogramm größer als 0 (blau) ist, handelt es sich um einen starken Markt, wenn das Histogramm kleiner als 0 (gelb) ist, um einen schwachen Markt. Es sollte nur innerhalb von Histogrammen größer als 0 gehandelt werden. Basieren
FREE

In der Physik ist der "Ruck" die dritte Zeitableitung der Position, wobei die Beschleunigung die zweite Ableitung und die Geschwindigkeit die erste Ableitung ist. In der technischen Analyse ist die erste Ableitung des Preises der Preisimpuls, wobei die zweite Ableitung, die Beschleunigung, selten verwendet wird und die dritte Ableitung praktisch unbekannt ist. Der Betragsfrequenzgang eines digitalen Differenzierers ist eine Gerade mit positiver Steigung, die durch die Frequenz Null verläuft. Dah
FREE

Lisek Stochastik-Oszillator-Indikator mit Alarm, Push-Benachrichtigungen und E-Mail-Benachrichtigungen. Der Stochastik-Indikator ist ein Momentum-Indikator, der Ihnen anzeigt, wie stark oder schwach der aktuelle Trend ist. Er hilft Ihnen, überkaufte und überverkaufte Marktbedingungen innerhalb eines Trends zu erkennen. Der Stochastik-Indikator ist ein nachlaufender Indikator, d.h. er sagt nicht voraus, wohin sich der Kurs entwickelt, sondern liefert nur Daten darüber, wo der Kurs war!!!
Wie man
FREE

Eigenschaften:
Dies ist ein Neigungsindikator für den TMA Bands Indikator. Er berechnet die Neigung der Mittellinie. Er unterstützt 3 Arten von TMA-Bändern: TMA True (nicht neu gezeichnet) Fast Line TMA (Übermalungen) TMA+CG (Wiederholungen) Der Indikator hilft Ihnen festzustellen, ob sich der Preis in einem Trend oder einer Schwankung befindet, basierend auf dem von Ihnen eingestellten Schwellenwert. Laden Sie hier zusätzliche TMA-Indikatoren für die Strategie herunter: https://www.mql5.com/en/
FREE

Für einige Händler-Charts Analyse verwenden, speziell für Multi-Timeframe-Handelsstrategien . Wenn Sie etwas von der Zeit innerhalb der verschiedenen Zeitrahmen auf dem gleichen Symbol-Chart , auch verschiedene Symbol-Charts zu überprüfen, wird dieser Indikator das Fadenkreuz auf sync bewegen zeigen. Sie müssen diesen Indikator nur in einige Charts laden, dann wird das Fadenkreuz automatisch angezeigt.
FREE
............................................hi................................................ .........................ist ein einfacher Indikator für gleitende Durchschnitte ............................
.........................verschiedene Darstellungen von gleitenden Durchschnitten.......................... ...............kann Zeitraum, Verschiebung, Modus und angewandten Preis auswählen.................. ............viele Händler nutzen gleitende Durchschnitte, um Marktbewegungen zu erkenne
FREE

Die RSI-Bänder sind ein leistungsfähiger Indikator, der ein oberes und ein unteres Band anzeigt, die dem überkauften und überverkauften Niveau des RSI entsprechen. Das Band zeigt an, welcher Preis während dieser bestimmten Kerze erreicht werden muss, damit das RSI-Überkaufte/Überverkaufte-Niveau erreicht wird. Dies ist ein äußerst nützliches Instrument, um zu erkennen, wann ein Trend begonnen hat und wann ein Trend zu Ende geht. Der Indikator bietet Puffer, so dass Sie ihn in Ihrem eigenen Exper
FREE

Der Bullish and Bearish Engulfing Pattern Screener für MetaTrader 4 ist ein leistungsstarkes Tool für Händler, die wichtige Umkehrmuster an den Finanzmärkten erkennen möchten. Dieser Indikator durchsucht Preisdiagramme nach bullischen und bearischen Engulfing-Mustern, die potenzielle Trendumkehrungen signalisieren. Hauptmerkmale: Scannen in Echtzeit : Analysiert fortlaufend die Kursdaten, um sofortige Warnungen zu liefern, wenn Engulfing-Muster erkannt werden. Anpassbare Einstellungen : Ermöglic
FREE

Dieser Indikator bewertet gleichzeitig die Volatilität und die Kursrichtung, wobei die folgenden Ereignisse ermittelt werden. [ Installationsanleitung | Update-Anleitung | Fehlerbehebung | FAQ | Alle Produkte ] Entscheidende und plötzliche Preisbewegungen Große Hämmer / Sternschnuppenmuster Starke Ausbrüche, die von den meisten Marktteilnehmern unterstützt werden Unentschlossene, aber volatile Marktsituationen Es ist ein extrem einfach zu verwendender Indikator ... Das blaue Histogramm repräsen
FREE

Der Tmcd ist ein sehr glatter Oszillator und ein guter Trendindikator. Er hat einen eingebauten Rauschfilter, der Seitwärtsmärkte anzeigt und kann auch den Beginn eines Trends anzeigen. Er funktioniert bei allen Symbolen, von Forex über Rohstoffe bis hin zu Kryptowährungen. Es ist keine Änderung der Einstellungen erforderlich. Die Standardeinstellungen sind in Ordnung. Die Verwendung des Indikators kann vielfältig sein und ich empfehle ihn in Verbindung mit anderen Indikatoren zu verwenden. Der
FREE

GROSSER KERZENALARM https://www.mql5.com/en/users/earobotkk/seller#products P/S: Wenn Sie diesen Indikator mögen, bewerten Sie ihn bitte mit 5 Sternen in der Bewertungssektion, dies wird seine Popularität erhöhen, so dass andere Benutzer von seiner Verwendung profitieren können. Dieser Indikator zeichnet eine vertikale Linie innerhalb einer Kerze, wenn die Größe eines Kerzenkörpers die in der Eingabe angegebene Mindestgröße überschreitet. EINGABE Bullish Candle Color: Wählen Sie eine Farbe Ihrer
FREE

Updates
9/12/2023 - Wenn Sie nach dem Spock EA suchen, verkaufe ich ihn nicht mehr. DM mich für weitere Informationen.
24/10/2023 - Schauen Sie sich meine anderen Produkte. Ich beginne mit der Einführung einiger EAs und Indikatoren, die auf dieser Reihe basieren .
Derzeit gibt es keine MT5-Version. Ich selbst benutze MT4.
Also werde ich meine Zeit hauptsächlich damit verbringen, umfangreichere Statistiken für die Stats-Version und vielleicht sogar einen EA zu entwickeln. Vielleicht entwickle
FREE
Wie man handelt
Führen Sie Ihre Trades in 3 einfachen Schritten aus!
Schritt 1: Handelsaufbau Einstieg Kaufen = Wenn der tägliche Eröffnungsmarkt oberhalb der PIVOT-Linie liegt oder der Kurs die Kerze oberhalb des Widerstands1 berührt und geschlossen hat. Einstieg Verkaufen = Wenn der tägliche Eröffnungsmarkt unter der PIVOT-Linie liegt oder der Kurs die Kerze über der Unterstützung1 berührt und geschlossen hat. Schritt 2: Stop Loss setzen Stop Loss BUY ----> Sie können den Stop Loss auf der Lin
FREE

Der Fibonacci-Indikator zeigt automatisch die Fibonacci-Retracement-Levels an, die wichtige Unterstützungs- und Widerstandsmarken darstellen. Der Bereich für die Berechnung des Indikators kann aus dem Vortag, der Woche, dem Monat, dem Jahr oder einer benutzerdefinierten Sitzung stammen.
Niveaus 100 % (Hoch) der Spanne der vorangegangenen Sitzung. 0 % (Tiefstwert) der Spanne der vorangegangenen Sitzung. 76,4 % der Spanne der vorangegangenen Sitzung. 61,8 % der Spanne der vorangegangenen Sitzung
FREE

Symmetrical Triangle Pattern Indikator - Trend-Erkennung in MetaTrader meistern Nutzen Sie die Möglichkeiten der Trenderkennung mit dem "Symmetrical Triangle Pattern" Indikator für MetaTrader. Dieses innovative Tool vereinfacht die Erkennung von symmetrischen Dreiecksmustern und liefert Händlern klare Signale für eine mögliche Trendfortsetzung oder -umkehr. Verbessern Sie Ihre Handelsstrategien mit diesem MQL-Angebot. Hauptmerkmale : Genaue Mustererkennung : Der Symmetrical Triangle Pattern Indi
FREE

Zentrade bringt Sie auf das professionelle Niveau. Dieser Indikator bietet Ihnen Konsistenz, Klarheit und Präzision für sicheres Trading, denn Ihre Signale bleiben bestehen und Ihre Handelslogik wird nicht beeinträchtigt.
Keine Neuberechnung. Niemals. Kauf- und Verkaufssignale werden sofort auf der aktuellen Kerze generiert und sind permanent. Was Sie sehen, ist die Realität.
Unveränderte Logik. Vergangene Signale werden weder gelöscht noch verändert. Analysieren Sie Ihre Historie mit v
FREE

Erschließen Sie Ihr Handelspotenzial mit Momentum Master , dem intelligenten Indikator, der Ihnen hilft, die Märkte mit Zuversicht zu steuern. Dieses leistungsstarke Tool liefert klare, umsetzbare Signale, indem es die Stärken mehrerer bewährter Indikatoren kombiniert. Verabschieden Sie sich vom Rätselraten und begrüßen Sie den Präzisionshandel. Momentum Master ist mehr als nur ein Signalanbieter; es ist Ihr persönlicher Marktanalyst. Er nutzt eine einzigartige Kombination aus gleitenden Durchsc
FREE

Zweck:
Die Funktion dieses Indikators besteht darin, 3 Linien mit gleitenden Durchschnitten (MAs) auf dem Haupt-MT4-Preisdiagramm zu zeichnen.
Die MAs stammen aus 3 verschiedenen Zeiträumen, die vom Benutzer unabhängig von dem aktuell angezeigten Diagramm festgelegt wurden.
Wenn Sie Ihre Diagrammansicht durch verschiedene Zeitrahmen schalten, zeigen die 3 MAs weiterhin die MA-Linien für die in den Eigenschaften angegebenen Zeitrahmen an.
Beispiel:
In den Standardeinstellungen sind drei MAs
FREE
Hochgradig konfigurierbarer Indikator für Akkumulation und Verteilung (AD). Merkmale: Hochgradig anpassbare Alarmfunktionen (bei Levels, Kreuzen, Richtungsänderungen per E-Mail, Push, Sound, Popup) Multi-Timeframe-Fähigkeit Farbanpassung (bei Pegeln, Kreuzen, Richtungsänderungen) Optionen für lineare Interpolation und Histogramm-Modus Funktioniert im Strategie-Tester im Multi-Timeframe-Modus (auch am Wochenende ohne Ticks) Einstellbare Levels Parameter:
Ad Timeframe: Sie können die unteren/höhe
FREE

In der Finanzwelt ist die Korrelation ein statistisches Maß dafür, wie sich zwei Wertpapiere im Verhältnis zueinander bewegen. Korrelationen werden in der fortgeschrittenen Portfolioverwaltung verwendet. Der Indikator misst, wie sich verschiedene Wertpapiere im Verhältnis zu einem Referenzwert bewegen, und erleichtert so die Portfolioverwaltung. [ Installationshandbuch | Update-Handbuch | Fehlerbehebung | FAQ | Alle Produkte ] Gleichzeitige Trades in stark korrelierten Instrumenten vermeiden Fin
FREE

Dieser Scanner überwacht den gesamten Markt auf Handelsmöglichkeiten für alle Symbole und für alle Zeitrahmen. Sie müssen nicht alle Charts, alle Symbole und alle Zeitrahmen im Auge behalten. Dieser Scanner alarmiert Sie auf Ihrem Computer oder auf Ihrem Handy, wenn eine Handelsmöglichkeit gefunden wurde. Sie müssen nie wieder eine Handelsmöglichkeit verpassen! Dieser Indikator wurde entwickelt, um alle Paare und Symbole für alle Zeitrahmen zu scannen, um ein Kreuz der MACD Haupt- und Signallini
Hochgradig konfigurierbarer gleitender Durchschnittsindikator.
Merkmale: Hochgradig anpassbare Alarmfunktionen (bei Levels, Kreuzen, Richtungsänderungen per E-Mail, Push, Sound, Popup) Multi-Timeframe-Fähigkeit Farbanpassung (bei Niveaus, Kreuzen, Richtungsänderungen) Option für lineare Interpolation Funktioniert im Strategie-Tester im Multi-Timeframe-Modus (auch am Wochenende ohne Ticks) Parameter:
MA Timeframe: Sie können den unteren/höheren Zeitrahmen für MA einstellen. MA Bar Shift: Sie kön
FREE

Sie haben wahrscheinlich schon von der Dow-Trendtheorie gehört, nach der höhere Höchst- und Tiefststände einen Aufwärtstrend und niedrigere Höchst- und Tiefststände einen Abwärtstrend anzeigen. Dieser Indikator bestimmt diesen Trend auf der Grundlage der Dow-Theorie. Sie müssen lediglich eine Zahl eingeben, die die Anzahl der Kerzen zwischen den Extremen angibt. Die optimale Lösung ist die Zahl 3, es sei denn, Sie möchten den Trend ab M5 haben, befinden sich aber auf M1, dann müssen Sie diese Z
FREE

Trend Graf ist ein Werkzeug, das Ihnen erlaubt, den Trend des aktuellen Augenblicks zu sehen, mit Startbereiche, die alle sechs Stunden erscheinen, ist in der Lage, uns die Höhe der Korrektur Grenze sowohl auf den Trend und auf die Änderung der it.Works auf alle Währungspaare! In den Einstellungen haben wir einen Offset für die Projektion der Startbereich von der aktuellen Einstellung, für jedes Währungspaar können Sie den Offset, die am besten zeigen, die Korrektur Grenze.The nächste Update wir
FREE
** Alle Symbole x Alle Zeitrahmen scannen nur durch Drücken der Scanner-Taste ** *** Kontaktieren Sie mich , damit ich Ihnen eine Anleitung schicken und Sie in die "RSI-Scanner-Gruppe" aufnehmen kann, damit Sie Ihre Erfahrungen mit anderen Nutzern teilen oder sehen können.
Einführung RSI-Divergenz ist eine wichtige Technik die verwendet wird, um die Trendumkehr zu bestimmen, wenn es Zeit ist, zu verkaufen oder zu kaufen, weil die Preise wahrscheinlich fallen oder in den Charts steigen werden.
Der Indikator kann mit jedem Zeitrahmen und Forex-Paar verwendet werden. Ein einfach zu bedienender Parameter im Indikator ermöglicht es Ihnen, die Signale an jedes Forex-Paar und jeden Zeitrahmen anzupassen, mit dem Sie handeln möchten.
Die Pfeile wiederholen sich nicht!
Informationstafel: Wir haben diesen Indikator mit einem benutzerfreundlichen Panel ausgestattet. Auf der einen Seite des Panels wird der Zeitrahmen angezeigt, während auf der anderen Seite das Währungspaar zu sehen ist. Daru
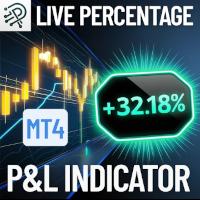
Überwachen Sie Ihren gleitenden Gewinn oder Verlust als Prozentsatz Ihres Kontosaldos live und immer sichtbar direkt auf Ihrem Chart! Hauptmerkmale: Echtzeit-Berechnung: Berechnet sofort den kombinierten variablen Gewinn oder Verlust aus allen offenen Geschäften als Prozentsatz Ihres aktuellen Kontosaldos. Einfache Anzeige auf dem Chart: Das Ergebnis wird bequem als Etikett in der unteren rechten Ecke Ihres Charts angezeigt - keine Ablenkung, immer sichtbar. Klare Farbkodierung: Grün für Gewinn
FREE
Altopium Trend ist ein Indikator, der kurzfristige Trends identifiziert. Die von ihm generierten Signale können zur Eröffnung von Long- oder Short-Positionen genutzt oder mit anderen Indikatoren/Strategien integriert werden. Da es sich um einen Trendindikator handelt, ist in engen Seitwärtsphasen Vorsicht geboten. Ich empfehle, ihn als kurzfristigen Trendindikator zu verwenden, ergänzt durch andere Indikatoren, die die besten Einstiegszeitpunkte in den Markt anzeigen.
Warten Sie auf das Schlie
FREE

Oil Master ist ein sehr einsteigerfreundlicher Kauf-Verkaufs-Pfeil-Indikator, der auf Öl-Paaren funktioniert. Dieser Indikator konzentriert sich auf schnelle Scalping-Signale mit eingebautem Geldmanagement in Form von farbigen Take-Profit- und Stop-Loss-Linien, die mit jedem Pfeil-Signal geliefert werden, der Indikator hat auch ein eingebautes Stats-Panel, das neben nützlichen Informationen die Signalgenauigkeit in % angibt. WIE BENUTZEN : Eröffnen Sie den Handel entsprechend der Pfeilrichtung,
FREE
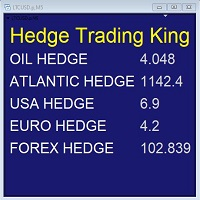
Hedge Trading Monitor ist mein Indikator, der auf einen Blick die Differenz oder das Verhältnis zwischen zwei Vermögenswerten anzeigt, die für den Hedge-Handel nützlich sind.
Wie man ihn benutzt + den Indikator herunterladen + Wenden Sie den Indikator auf einen offenen Chart an + Sie können die Vermögenswerte ändern, indem Sie in den Einstellungen handeln.
Vertrieb + er wird nur auf MQL5.vom verteilt + kostenlose Lizenz (FREE)
FREE

Der Indikator gibt Kauf- oder Verkaufssignale, die auf dem Parabolic SAR-Indikator basieren, und er enthält auch Strategien mit gleitenden Durchschnitten. Es gibt Alarme und Benachrichtigungen an das mobile Endgerät und an die E-Mail. Die Pfeile werden auf dem Chart gezeichnet, nachdem das Signal bestätigt wurde. Sie werden nicht neu gezeichnet. Ich empfehle, meinen Berater zu beobachten - Night Zen EA
Um über meine neuesten Produkte und Ideen auf dem Laufenden zu bleiben, treten Sie meinem Tel
FREE

Dieser Scanner überwacht den gesamten Markt auf Ichimoku-Handelsmöglichkeiten für alle Symbole und alle Zeitrahmen. Sie müssen nicht alle Charts, alle Symbole und alle Zeitrahmen im Auge behalten. Dieser Scanner alarmiert Sie auf Ihrem Computer oder auf Ihrem Handy, wenn eine Handelsmöglichkeit gefunden wurde. Sie müssen nie wieder eine Handelsmöglichkeit verpassen! Dieser Indikator wurde entwickelt, um alle Paare und Symbole für alle ausgewählten Zeitrahmen zu scannen, um ein Tenkan- und Kijun-

Graphic Shapes - unter Verwendung der Historie werden vier Arten von grafischen Formen projiziert, die es Ihnen ermöglichen, die wichtigsten Bereiche der zukünftigen Preisbewegung zu bestimmen, sowie die wichtigsten Marktumkehrungen zu verstehen und gleichzeitig Einstiegspunkte nach Priorität zu bestimmen. Sie ermöglichen es Ihnen, eine vollständige Marktanalyse durchzuführen, ohne zusätzliche Tools zu verwenden! Der Indikator ist ein leistungsfähiges Instrument zur Vorhersage von Preisbewegunge
FREE

Dieser Indikator zeigt ein komplettes Tick-Chart mit zwei optionalen gleitenden Durchschnitten an und macht die Beachtung von Sub-M1-Kursdaten wirklich einfach. [ Installationsanleitung | Update-Anleitung | Fehlerbehebung | FAQ | Alle Produkte ] Preisspitzen leicht erkennen Die blaue Linie ist der Briefkurs Die rote Linie ist der Geldkurs Der Indikator verliert keine Tickdaten, wenn er neu geladen wird Er implementiert zwei optionale gleitende Durchschnitte Der Indikator wird nicht neu gezeichne
FREE

Dieser Indikator eignet sich für den Handel mit Forex und Binären Optionen, je nach Einstellung. Der Indikator ist für den Trendhandel konzipiert. Ein Kaufsignal: Ein Aufwärtspfeil erscheint auf dem Chart. Ein Verkaufssignal: Ein Abwärtspfeil erscheint auf dem Chart.
Eingabeparameter === Einstellung CCI === Periode CCI 1 - Periode des CCI Zeitraum CCI 2 - Zeitraum des CCI Level BUY - Level des CCI für Käufe Level SELL - Level des CCI für den Verkauf === Einrichtung RSI === Level SELL - Niveau d
FREE
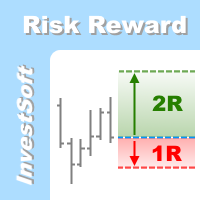
Dies ist die Forex visuelle Aufträge Werkzeug & Forex Positionsgröße (Lot) Rechner mit intuitiven Panel. Risk Reward Ratio Indicator funktioniert mit allen Arten von Symbolen: Währungspaare, Indizes, Metalle, Rohstoffe, Kryptowährungen, etc.
Wenn Sie sich vergewissern möchten, dass Risk Reward Ratio Indicator auf Ihren Lieblingssymbolen funktioniert, kontaktieren Sie uns (besuchen Sie unser Profil ) und fordern Sie eine kostenlose 7-Tage-Testversion an, um dieses Tool ohne Einschränkungen zu t

Indikator (beinhaltet Volumenprofil + Orderblöcke) - ein revolutionärer Indikator, der zwei der leistungsfähigsten Konzepte der modernen technischen Analyse kombiniert: Volumenprofile und Orderblöcke institutioneller Akteure. Mit diesem Tool können Sie sehen, was den meisten Händlern verborgen bleibt, und Sie erhalten einen bedeutenden Vorteil auf dem Markt.
Die wichtigsten Vorteile des Indikators: Visualisierung von "intelligentem Geld": Zeigt deutlich die Bereiche, in denen sich große Marktte
Präzisionseinstiegspfeile: Verpassen Sie nie wieder einen hochwahrscheinlichen Handel! Hören Sie auf zu raten und beginnen Sie, mit Zuversicht zu handeln. Der Precision Entry Arrows-Indikator ist ein ausgeklügeltes All-in-One-Tool, das hochwertige, nicht nachmalende Kauf- und Verkaufssignale direkt auf Ihrem Chart liefert. Er kombiniert gekonnt die Leistung von MACD , Stochastik und einem einzigartigen EMA 5 Cross , um exakte Einstiegszeitpunkte zu ermitteln, und filtert dann alles durch einen
FREE

Resistance and Support ist ein einfach zu bedienender Indikator, der horizontale Widerstands- und Unterstützungslinien anzeigt. Es gibt zwei Fenster zum Hinzufügen von Ebenen. Wenn Sie auf die Schaltfläche klicken, erscheint eine Linie auf dem Preisdiagramm. Durch einen Doppelklick mit der Maus auf diese Linie können Sie sie aktivieren und verschieben, wodurch sich die Indikatorwerte ändern. Im Menü des Indikators haben Sie die Wahl zwischen folgenden Warnmeldungen kein Alarm, Alarm bei Berührun
FREE

Die "Stimmung der Händler" auf den Finanzmärkten ist ein Thema, das uns schon seit langem beschäftigt. Im Laufe der Zeit konnten wir jedoch nicht die richtige Formel finden, um diese Stimmungen zu definieren. Auf der Suche nach der richtigen Methode haben wir viele Stufen durchlaufen - von der Übernahme von Daten aus externen Quellen zur Berechnung der offenen Positionen von Käufern und Verkäufern bis hin zur Berechnung des Tick-Volumens, aber wir waren immer noch nicht zufrieden mit den Ergebni

Beschreibung Dieser Scanner verwendet 3LZZ TRO ex4 und scannt nach Semafors bei gegebener "Shift"-Leiste.
Detaillierte Einstellungen des Scanners: https://www.mql5.com/en/blogs/post/747456
Andere Einstellungen: Zeiträume für Semafor 1,2,3 einstellen Alarme ein/aus für Semafor 1,2,3 einstellen Verschiebebalken (Balken, an dem Semafor gescannt wird) Refresh After Ticks (Anzahl der Ticks, nach denen der Strich aufgefrischt wird) Dieser Scanner ist eine ziemlich vereinfachte Version. Eine ausführl
FREE

Informativer & optimierter Zickzackkurs, kumuliertes Volumen, Preisänderung Eine Neufassung des traditionellen Zickzack-Tools mit neuen Zusätzen. Eigenschaften:- Optimierter Code Anzeige des kumulierten Volumens zwischen den Spitzenwerten Zeigt die Preisveränderung zwischen den Spitzenwerten an Verwendung:- Erkennen von Trendschwankungen Identifizierung von Schwankungen mit hohem Volumen Vergleichen von Preisänderungen zwischen Schwankungen Zeichnen des Fibonacci-Tools bei starken Preisänderunge
FREE
Bitte vor dem Kauf lesen: - Wir haben keine Details des Käufers, wenn der Kauf gemacht wurde. Um die Boni zu erhalten, müssen Sie mich über Produktkommentar (nicht Produktbewertung) zu kontaktieren. Auf diese Weise werde ich Sie zurück über mql Nachricht fragen nach E-Mail kontaktieren. - Bitte vergewissern Sie sich, dass Sie den Empfang von Nachrichten aus der Nicht-Freundesliste aktivieren, sonst kann ich Sie nicht per E-Mail kontaktieren. Dieser Indikator ist nicht nur über Smart Money Konzep
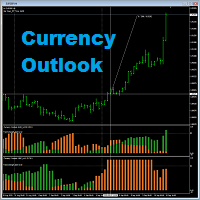
Currency Outlook ist ein Indikator, der uns helfen kann, "das richtige Paar in der richtigen Richtung und zum richtigen Zeitpunkt zu handeln". Dieser Indikator analysiert die Preise aller Cross-Währungspaare der ausgewählten Währung und meldet uns das Ergebnis in Form eines zweifarbigen Histogramms. Die maximale Höhe des Histogrammdiagramms des Indikators beträgt 100. Der Indikator ist ausschließlich für AUD, CAD, CHF, EUR, GBP, JPY, NZD und USD programmiert. Er kann in jedem Zeitrahmen im MT4 a

Dynamische CMF-Berechnung: Passen Sie den Zeitraum für den Chaikin Money Flow (CMF) an, um Ihre Analyse zu verfeinern und die Signalgenauigkeit zu maximieren. Intuitive farbkodierte Warnungen: Interpretieren Sie die Marktbedingungen sofort mit klaren visuellen Hinweisen: Grüner Alarm: Zeigt die überkaufte Zone an - ein Zeichen für eine potenzielle Verkaufsmöglichkeit. Roter Alarm: Zeigt die überverkaufte Zone an - was auf eine potenzielle Kaufgelegenheit hindeutet. Grauer Alarm: Zeigt den neutra
FREE
Hallo!
Ich bin Tatsuron, ein japanischer Privatanleger. Wir verwalten über 1 Milliarde Yen in Forex.
Lassen Sie mich einen sehr nützlichen Indikator vorstellen, den ich verwende.
Der Indikator, der die Grundlage des Marktpreises bildet.
ThreeLine hat den gleitenden Durchschnitt (Moving Average, SMA) verbessert, um die langfristigen numerischen SMA-Einstellungen zu beantworten.
Je mehr Sie tägliche Trades und Überprüfungen wiederholen, desto glaubwürdiger wird die Three Line.
Wenn der Wi
FREE

Pfeilindikator ohne Redrawing und Verzögerung Der Indikator zeigt die besten Trendeinstiegspunkte auf dem Chart an. Es ist besser, ihn in Verbindung mit anderen Trendindikatoren als Filter zu verwenden. Der Indikator zeigt gute Ergebnisse auf niedrigeren Zeitskalen. Das Signal wird innerhalb der Kerze erzeugt und erscheint als blaue und rote Pfeile. Zeigt Signale am Null-Balken an
Einstellungen
Step : Berechnung der Balken in der Historie
Balken : Zeigt die Balken in der Historie an
Delta :
FREE
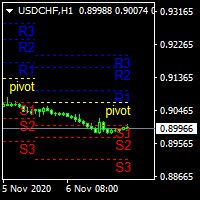
.................................wenn Sie Pivotpunktebenen benötigen............................... ............................das ist ein wöchentlicher Pivot-Punkt-Level-Schöpfer........................... ...es ist für wöchentliche Pivots und zeigt die Levels in den Zeiträumen d1 , H4 , H1 , M30 ............... .................................zeigt auch die Niveaus der letzten 3 Wochen.............................. ................ kann mit anderen Indikatoren verwendet werden und zeigt wich
FREE
Der Indikator bestimmt überkaufte/überverkaufte Zonen auf verschiedenen Zeitskalen. Die Pfeile zeigen den Markttrend in verschiedenen Zeitabschnitten an: verlässt der Markt die überkaufte Zone, zeigt der Pfeil einen Aufwärtstrend an (Pfeil nach oben), verlässt der Markt die überverkaufte Zone, zeigt der Pfeil einen Abwärtstrend an (Pfeil nach unten). Die Situation auf dem Zeitrahmen, auf dem sich der Indikator befindet, wird im unteren rechten Fenster angezeigt. In diesem Fenster werden Informat
FREE

BuySell Volume ist ein Indikator, der das Kauf- und Verkaufsvolumen auf der Grundlage der Preisbewegung annähert. Eingabe Beschreibung: Angewandtes_Modell: Wählen Sie das angewandte Modell. Im Modus "niedrige Umkehrung" wird davon ausgegangen, dass der Preis während der Entstehung der bullischen Kerze einen geringen bärischen Druck erhält (hoher bärischer Druck im Modell "hohe Umkehrung"). Mit anderen Worten: Bullische Marubozu-Kerzen haben im Modell mit niedriger Umkehrung wirklich hohe Kaufvol
FREE

MultiFiboDynamicMT4 ist ein leistungsstarker, professioneller Indikator zur Einschätzung der wichtigsten Unterstützungs- und Widerstandsniveaus. Der Hauptvorteil besteht darin, dass er die Fibonacci-Levels in allen Zeitrahmen gleichzeitig anzeigt, was dem Händler erlaubt, sich ein vollständiges Bild von der möglichen Preisbewegung des Handelsinstruments zu machen!
Vorteile des Indikators Der Indikator ist perfekt für Scalping und den Handel mit binären Optionen. Geeignet für Anfänger und erfahr
FREE

Der Levels-Indikator basiert auf den Daten des Vortages. Die mathematische Formel bestimmt die Einstiegs- und Ausstiegslevel.
Handelsempfehlungen. Levels werden zu Beginn der europäischen Sitzung gehandelt, wenn Volatilität auftritt. Bei unzureichender Volatilität wird die Hälfte des Take-Profits zum Ausstieg verwendet. Wenn der Kurs bei der Hälfte des Take-Profits umgekehrt ist, suchen Sie bei der Umkehrung ebenfalls ein Ziel auf dem Niveau des halben Take-Profits. Wenn der Kurs vom Einstieg
FREE

Produkttitel Smart Bears (MT4) – Teil der SmartView Indicators Serie Kurzbeschreibung Ein Bears -Indikator mit einzigartiger Benutzererfahrung auf der MetaTrader-Plattform. Bietet erweiterte Funktionen, die zuvor nicht verfügbar waren, wie das Öffnen von Einstellungen per Doppelklick, das Ausblenden und Anzeigen von Indikatoren ohne Löschung und die Anzeige des Indikatorfensters in voller Chartgröße. Entwickelt für nahtlose Zusammenarbeit mit dem Rest der SmartView Indicators Serie. Überblick Di
FREE

Einige kurze, aber nette Algo geben Signale und einige Ideen für Stops. Fünf gleitende Durchschnitte werden verwendet, um Cross-Overs zu finden und eine Zone zu erstellen. Alle Perioden und Methoden sind einstellbar, aber die Standardwerte sind bereits optimiert. Wenn Sie Lags auf lange Geschichte haben, können Sie MaxBars reduzieren, damit es schneller funktioniert. Bitte kommentieren Sie, wenn Sie die Parameter erklären müssen. Auch jegliche Verbesserungsvorschläge sind willkommen.
FREE

Bereichsfilter - BreakOut EA
Was ist der Bereichsfilter? Der Range Filter ist ein innovatives Tool, das Marktgeräusche glättet und aussagekräftige Kursbewegungen hervorhebt. Anstatt sich auf jede kleine Schwankung zu konzentrieren, eliminiert der Range Filter unbedeutende Aktivitäten und ermöglicht es Händlern, Trends klarer zu erkennen. Die Idee stammt vom Volatilitätsfilter des QQE, aber anstatt ihn auf den RSI anzuwenden, wird dieser Ansatz direkt auf die Preisbewegung angewandt. Und so funk
FREE

Hör auf zu raten, fang an zu schießen: Der neue SR Sniper! Haben Sie genug von zufällig erscheinenden Einstiegspunkten? Der SR Sniper-Indikator ist Ihr neues, unverzichtbares Werkzeug, um mit chirurgischer Präzision hochwahrscheinliche Trades zu finden. Er wurde entwickelt, um das Marktrauschen zu durchdringen und Ihnen klare Kauf- und Verkaufssignale genau an den kritischsten Preiszonen zu geben. Dieser leistungsstarke Indikator kombiniert die dynamische Analyse des Commodity Channel Index (CC
FREE

** Alle Symbole x Alle Zeitrahmen scannen nur durch Drücken der Scanner-Taste ** *** Kontaktieren Sie mich , um Ihnen eine Anleitung zu schicken und Sie in die "Divergence-Gruppe" aufzunehmen, damit Sie Ihre Erfahrungen mit anderen Nutzern austauschen oder sehen können. Einführung MACD-Divergenz ist eine wichtige Technik die verwendet wird, um die Trendumkehr zu bestimmen, wenn es Zeit ist, zu verkaufen oder zu kaufen, weil die Preise wahrscheinlich fallen oder in den Charts steigen werden. Der

Oszillator-Dominator: Der fortschrittliche Vorteil für Ihr Trading Haben Sie genug von nachlaufenden Indikatoren und gemischten Signalen? Der Oscillator Dominator ist ein leistungsstarker, firmeneigener Indikator, der entwickelt wurde, um das Marktrauschen zu durchbrechen und hochwahrscheinliche Handelsgelegenheiten zu erkennen. Er verwendet nicht nur den standardmäßigen Relative Strength Index (RSI), sondern wertet ihn auf, indem er zunächst einen gleitenden Durchschnitt (MA) auf den Preis anw
FREE
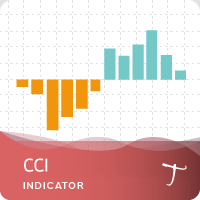
28 Symbole, leistungsstarkes Dashboard mit mehreren Zeitfenstern für eine vollständige Marktübersicht Anpassbare Kauf-/Verkaufswarnungen, Push-Benachrichtigungen, E-Mail-Benachrichtigungen und visuelle Warnungen auf dem Bildschirm. Markierte Kauf-/Verkaufssignale Zweifarbiges Trend-Histogramm. Der Commodity Channel Index (CCI) ist ein Oszillator, der ursprünglich von Donald Lambert im Jahr 1980 eingeführt wurde. Der CCI misst das aktuelle Preisniveau im Verhältnis zu einem durchschnittlichen Pr
FREE

Dieser automatisierte AK Edge Scalping-Indikator kann eingesetzt werden, um den Handel zu überwachen und optimale Einstiegspunkte für alle Zeitrahmen zu identifizieren und sowohl zu kaufen als auch zu verkaufen, wenn der Preis einen Aufwärts- oder Abwärtstrend beginnt. Er ist so konzipiert, dass er Zonen für Verkaufs-/Kaufgeschäfte erkennt, indem er den gleitenden Durchschnitt und den MACD verwendet. Zusätzlich wird der Average True Value zur Feinabstimmung des Stop Loss und des Take Profit her
FREE

Wenn Sie dieses Projekt mögen, hinterlassen Sie eine 5-Sterne-Bewertung. Da die Institutionen große Mengen tauschen, ist es für sie nicht ungewöhnlich,
zu versuchen,
ihre Position auf bestimmten Prozentebenen verteidigen. Diese Ebenen dienen als natürliche Unterstützung und Widerstand, die Sie
verwenden können
entweder um einen Handel zu betreten oder sich über mögliche Gefahren gegen Ihre
Position bewusst zu sein. Ein Beispiel für einen gebräuchlichen Prozentsatz sind 0,25% und 0,50% auf
EU
FREE

Das Skript versucht, die Gesamtrichtung des Marktes zu bestimmen, indem es geglättete Heiken Ashi-Kerzen verwendet. Das Einfärbesystem (mit hellen und dunklen Farben) ist ein Versuch, starke und schwache Marktbedingungen zu erkennen. Das Skript verfügt auch über einen Oszillator
Dies sind die Merkmale: Alarmbedingungen Funktionen: Sie können jetzt Alarme im Alarm-Dialog für Ereignisse wie Trendwechsel, Trendverstärkung und -abschwächung einstellen; sowohl für Bullen- als auch für Bären-Trends.
FREE

Market Calculator ist ein leistungsstarkes Tool, mit dem Sie die wichtigsten Parameter eines Handels einfach und schnell berechnen können: Lot-Größe, StopLoss und TakeProfit, sowie die Schätzung der Höhe der Mittel (erforderliche Margin) zur Eröffnung einer Position. Das Programm hat eine sehr bequeme und intuitive Steuerung, da es im Stil von OS Windows implementiert ist. Es gibt viele interessante und praktische Funktionen - schauen Sie sich einfach das Video an: youtu.be/FG2qqTJTIhE Alle Prog
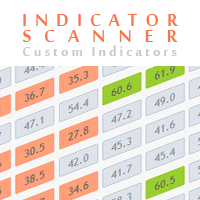
Advanced Indicator Scanner ist ein Multi-Symbol-Multi-Timeframe-Scanner, der mit Hunderten von benutzerdefinierten Indikatoren arbeitet, die im Internet verfügbar sind, einschließlich mql5-Website-Markt- und Codebase-Indikatoren.
Advanced Indicator Scanner Funktionen:
Scannt Ihren Indikator in 28 anpassbaren Instrumenten und 9 Timeframes. Überwacht bis zu 2 Zeilen (Puffer) eines Indikators. Anzeige des Indikatorwertes auf Schaltflächen. Sie können zwischen 3 Alarmmodi wählen: Einzelnes Symbol

Das Dashboard für symmetrische Dreiecksmuster ermöglicht es Ihnen, mehrere Märkte und Zeitrahmen gleichzeitig auf symmetrische Dreiecksmuster zu überwachen, wie sie vom hier verfügbaren Indikator für symmetrische Dreiecksmuster gezogen werden: https://www.mql5.com/en/market/product/68709/ Besuchen Sie den obigen Indikator, um mehr darüber zu erfahren, wie symmetrische Dreiecksmuster gebildet werden, und einfach zu befolgende Strategien, um sie zu handeln.
Das Dashboard ist ein eigenständiges P

[Abweichung jedes Indikators MT4] ist eine Sammlung von 18 Indikatoren, von denen einer beliebig ausgewählt werden kann, um an der Berechnung teilzunehmen. Es kann die Abweichungsform jedes Indikators berechnen und einen Alarm auslösen.
Parametereinstellungsbeschreibung:
Bei [Indikatoren] wird einer der 18 Indikatoren ausgewählt, um an der Berechnung teilzunehmen (dieser Parameter ist sehr wichtig) .
[period] ist ein gemeinsamer Zyklus für jeden Indikator.
[Method] ist der MA-Modus einiger
FREE
Der MetaTrader Market ist eine einzigartige Plattform für den Verkauf von Robotern und technischen Indikatoren.
Das Merkblatt für Nutzer der MQL5.community informiert Sie über weitere Möglichkeiten: nur bei uns können Trader Handelssignale kopieren, Programme bei Freiberuflern bestellen, Zahlungen über das Handelssystem automatisch tätigen sowie das MQL5 Cloud Network nutzen.
Sie verpassen Handelsmöglichkeiten:
- Freie Handelsapplikationen
- Über 8.000 Signale zum Kopieren
- Wirtschaftsnachrichten für die Lage an den Finanzmärkte
Registrierung
Einloggen
Wenn Sie kein Benutzerkonto haben, registrieren Sie sich
Erlauben Sie die Verwendung von Cookies, um sich auf der Website MQL5.com anzumelden.
Bitte aktivieren Sie die notwendige Einstellung in Ihrem Browser, da Sie sich sonst nicht einloggen können.