Breakout and Retest Scanner MT4
- Indikatoren
-
Elif Kaya
 Beware :
I just sell my products on Elif Kaya profile, any other websites are stolen old versions, So no any new updates or support.
If you want to have lifetime update free, guide file and adding in Elif Trader Group, just buy from me.
Contact me for more info. - Version: 2.31
- Aktualisiert: 19 April 2026
- Aktivierungen: 20
- Real Preis ist 80$ - 50% Rabatt (Es ist 39$ jetzt) - nur für 1 Kauf.
Kontaktieren Sie mich für Anleitung, Gruppe hinzufügen und alle Fragen!
- Nicht neu malen
- Ich verkaufe nur meine Produkte in Elif Kaya Profil, alle anderen Websites sind gestohlenen alten Versionen, also keine neuen Updates oder Unterstützung.
- Lifetime Update kostenlos
Verwandtes Produkt:Bitcoin Expert
Einführung
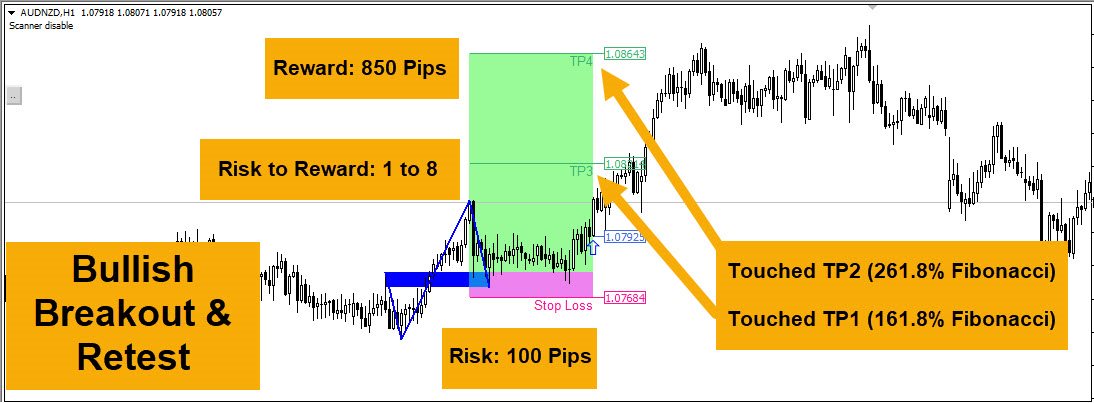
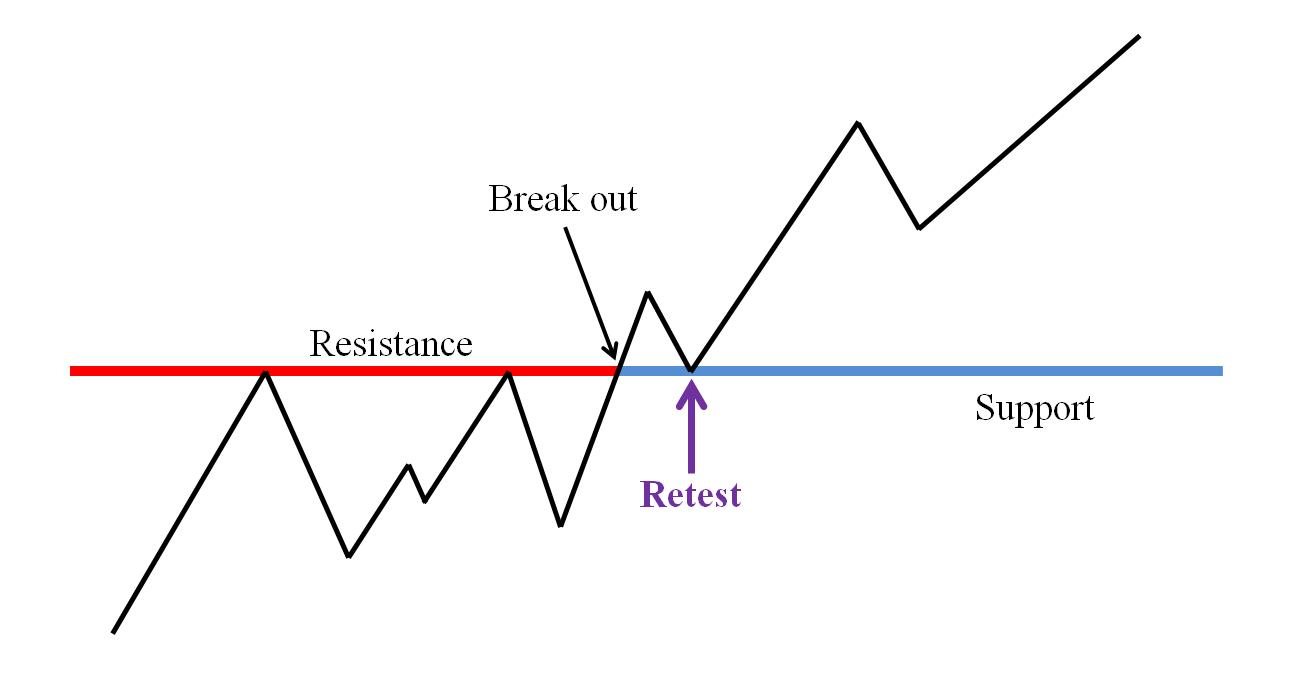
Die Breakout- und Retest-Strategie wird an Unterstützungs- und Widerstandsniveaus gehandelt. Sie beinhaltet, dass der Preis ein vorheriges Niveau durchbricht.
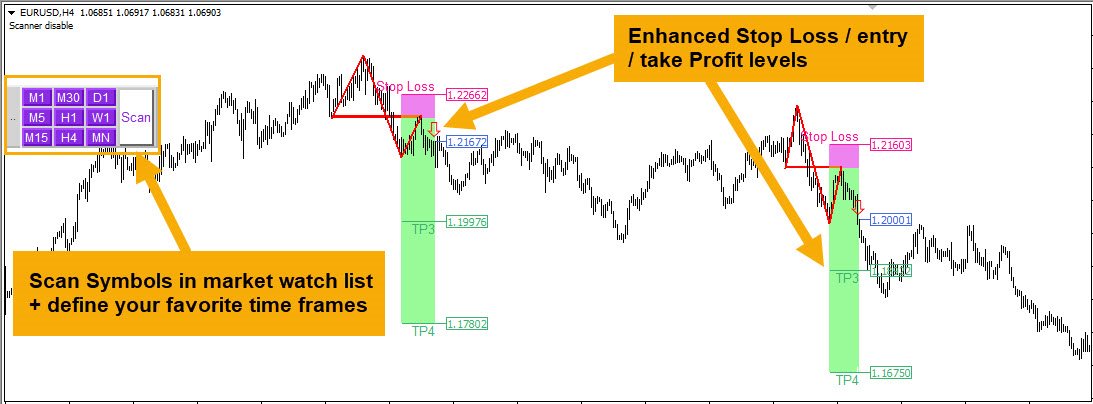
Scanner fürAusbrüche und erneute Tests
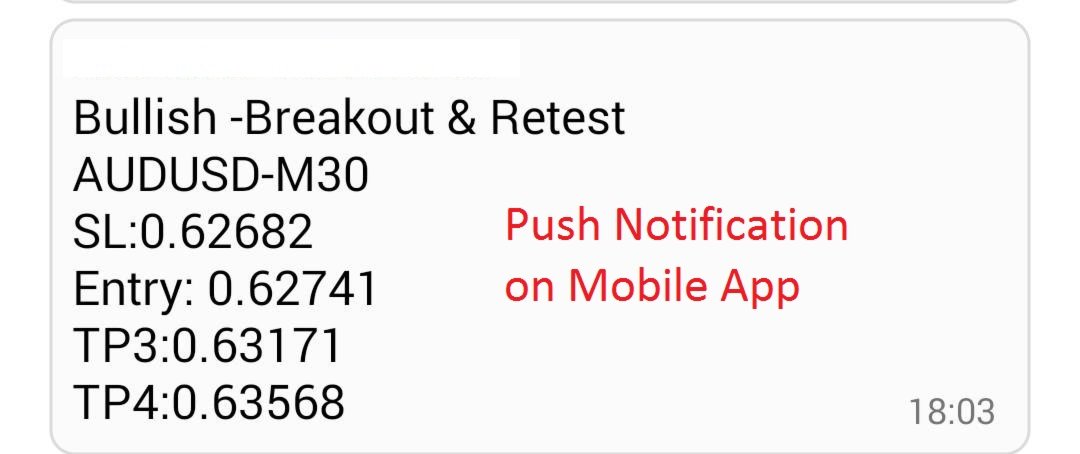
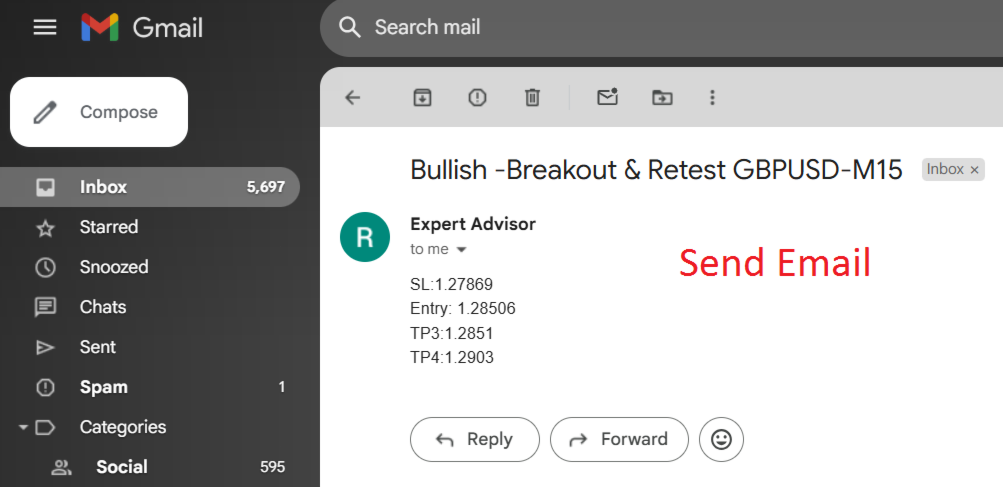
Scan, Fibonacci-Berechnungen und Mustererkennung werden vollständig vom Breakout- und Retest-Scanner-Indikator übernommen; Sie müssen nur den Scan-Button" drücken. Der Indikator sendet einen Alarm und eine Push-Benachrichtigung auf Ihr Mobiltelefon.
Wie funktioniert er?


nice indicator