MESA Cycles
- Indikatoren
- Version: 1.5
- Aktualisiert: 5 Dezember 2018
- Aktivierungen: 5

Version 1.05 - Option zum Setzen des Daten-Offsets (Anker) mit der Maus hinzugefügt. Halten Sie einfach die SHIFT-Taste gedrückt, doppelklicken Sie auf eine beliebige Stelle im Chart und lassen Sie dann die SHIFT-Taste los. Der Anker wird auf den Balken gesetzt, der dem Doppelklick am nächsten liegt.
Version 1.04 - Korrektur für den Demomodus (d.h. den Betrieb im Strategietester) hinzugefügt. Verwenden Sie nur offene Kurse und aktivieren Sie Datum verwenden (wählen Sie einen Datumsbereich)
Der MESA Cycles-Indikator berechnet das Leistungsspektrum einer Datenreihe mit Hilfe der Maximum Entropy Spectrum Estimation-Methode und erstellt eine Darstellung der stärksten Zyklen in der richtigen Phase und relativen Amplitude. Diese Zyklen werden dann um eine benutzerdefinierte Anzahl von Balken in die Zukunft verlängert. Im Gegensatz zu einer einfachen FFT-Transformation umfasst der Maximum-Entropie-Algorithmus Frequenzen aus der gesamten komplexen Frequenzebene und nicht nur aus dem Nyquist-Intervall, was im Allgemeinen bedeutet, dass er Zyklusperioden auflösen kann, die größer sind als das an die Funktion übergebene Datenfenster. Darüber hinaus ist MESA in der Lage, sehr scharfe spektrale Merkmale zu erfassen, die von anderen Analysemethoden oft übersehen werden.
Bevor die Logarithmen der Preisdaten an den MESA-Algorithmus weitergeleitet werden, werden sie mit einem Filter des kleinsten quadratischen Mittels detrendiert.
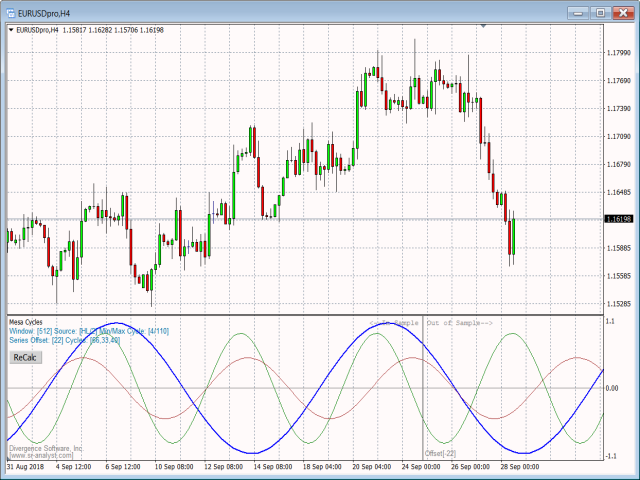
Das MESA-Zyklen-Tool ist äußerst nützlich, um Zyklen in den Preisdaten zu identifizieren, die möglicherweise noch einige Zeit in der Zukunft anhalten. Der empfohlene Ansatz besteht darin, den Offset kurz nach dem jüngsten Hoch- oder Tiefpunkt eines Schwungs einzustellen. Vergleichen Sie dann die aufgezeichneten Zyklen NACH dem Offset mit dem tatsächlichen Kursverlauf und suchen Sie nach einem Zyklus, der sich sehr eng an den Kursverlauf in diesem Zeitraum außerhalb der Stichprobe anlehnt. Für die Zyklusanalyse werden nur die Kursdaten links von Ihrem Offset verwendet. Alles, was rechts vom Offset liegt, ist außerhalb der Stichprobe und wird von den Zyklusanalyseroutinen weder gesehen noch verwendet.
Der EURAUD H4 Snapshot unten ist ein Beispiel dafür. Hier haben wir den Offset/Anker auf ein Swing-Hoch gesetzt, das 77 Bars zurückliegt. In der Periode außerhalb der Stichprobe sehen wir, dass der grüne Zyklus (36 Perioden) die Preisbewegung sehr genau verfolgt und daher ein guter Zyklus ist, den man in Zukunft beobachten sollte, um kommende Schwünge vorherzusagen. Bei jedem neuen Swing würden wir den Prozess wiederholen und Tests durchführen, indem wir den Offset auf ein aktuelles Swing-Hoch oder Swing-Tief setzen und den Offset beibehalten, der uns eine gute Out-of-Sample-Leistung für einen oder mehrere Zyklen liefert. In der Regel sollten Sie den Offset kurz nach einem der 3 jüngsten Hochs bzw. Tiefs eines Schwungs einstellen. Es wird nicht empfohlen, weiter als 3 Schwünge zurück zu gehen, es sei denn, die Schwünge sind sehr kurz.
Beachten Sie, dass in vielen Fällen der dominante Zyklus nicht unbedingt der nützlichste Zyklus für die Prognose ist.
Der MESA Cycles-Indikator ist ein Begleitindikator zu unserem MESA Spectrum-Indikator, der ebenfalls auf dem MQL-Marktplatz erhältlich ist.
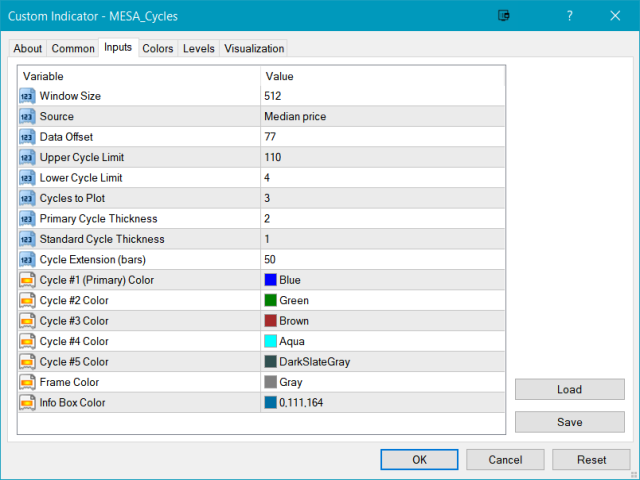
Optionen:
| Menü Option | Beschreibung |
|---|---|
| Fenstergröße | Wählen Sie zwischen 1024, 512, 256 oder 128. Im Allgemeinen wird die Fenstergröße 512 oder 256 empfohlen. Die Standardeinstellung ist 512. |
| Quelle | Wählen Sie die Quelle für die Preiseingabe. Die Standardeinstellung ist Medianpreis. |
| Daten-Offset | Legen Sie den Offset für die Preisreihe fest. Der Standardwert ist 1 (Balken). |
| Obere Zyklusgrenze | Wählen Sie die größte akzeptable Zykluslänge. Der Standardwert ist 110. Der Bereich ist 1-512. |
| Untere Zyklusgrenze | Wählen Sie die kleinste zulässige Zykluslänge. Der Standardwert ist 4. Der Bereich ist 1-512. |
| Aufzuzeichnende Zyklen | Legen Sie die Gesamtzahl der zu zeichnenden Zyklen fest. Der Bereich reicht von 1 bis 5. Die Vorgabe ist 3. |
| Primäre Zyklusdicke | Legen Sie die Linienstärke für die Darstellung des primären Zyklus fest. Der Bereich reicht von 1 bis 6. Die Voreinstellung ist 2. |
| Standard-Zyklusdicke | Legen Sie die Liniendicke für alle anderen Zyklusdiagramme fest. Der Bereich reicht von 1 bis 6. Die Voreinstellung ist 1. |
| Zyklusverlängerung | Legen Sie die Anzahl der Takte fest, die jede Zyklusdarstellung in die Zukunft verlängert werden soll. Die Voreinstellung ist 20 Takte. |
| Farbe für Zyklus 1 (primär) | Legen Sie die Farbe für die primäre (dominante) Zyklusdarstellung fest. |
| Farbe Zyklus #2 | Legen Sie die Farbe für die Darstellung des zweiten Zyklus fest. |
| Zyklus #3 Farbe | Legen Sie die Farbe für die Darstellung des dritten Zyklus fest. |
| Zyklus #4 Farbe | Legen Sie die Farbe für die Darstellung des vierten Zyklus fest. |
| Zyklus #5 Farbe | Legen Sie die Farbe für die Darstellung des fünften Zyklus fest. |
| Rahmenfarbe | Legen Sie die Farbe für die Rahmenlinien und den Text fest. |
| Farbe der Infobox | Legen Sie die Farbe für das Informationsfeld fest, das unter dem Titel angezeigt wird. |