Technische Indikatoren für den MetaTrader 4 - 23
Einführung
Die Convergence Divergence Suite enthält 17 Indikatoren , integrierte technische MT4-Indikatoren und kundenspezifische Indikatoren . Die Liste wird in den folgenden Versionen entsprechend den Wünschen der Benutzer erweitert. Jeder gewählte Indikator wird auf Ihren Chart geladen, dann werden automatisch Konvergenz- und Divergenz-Trendlinien auf dem Chart und dem Indikator gezeichnet. Dieses Tool ist wichtig, wenn Sie einen der aufgeführten Indikatoren oder Konvergenz/Divergenz in Ihr

Willkommen in der Welt von SMC (Smart Money Concepts) Trading, wo wir Händlern die Werkzeuge und das Wissen an die Hand geben, um intelligentere Handelsentscheidungen zu treffen. Unser neuestes Produkt ist der SMC Trading Pro Indikator, Version 1.0. Hauptmerkmale: Identifizierung von großen Marktstrukturen mit BODY-Break. Orderblock muss sich im Major Swing befinden (nicht im Small Swing). Orderblock mit Fair Value Gap-Erkennung. Orderblock in der Zone Discount | Premium. Filter für nur bullisc

Vollständig ausgestatteter Pivots- und Level-Indikator Pivots: Boden (normal), Woody, Camarilla, Fibonacci Niveaus: ATR, Historische Volatilität mit Standardabweichungen, Close-Preis-Volatilität mit Standardabweichungen
Merkmale: 4 +/- Stufen MTF, Pivots/Levels auf Basis von Daily, Weekly, 4h oder sogar 15min Stunden- und Minutenzeitversatz
Texte mit Preisen und Pipabständen zum zentralen Pivot/Level Eingaben für Camarilla/Fibonacci/ATR/Volatilitätslevel
Alarme, Popup, Push, E-Mail, Sound, Live
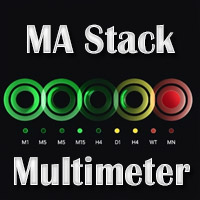
Grundlegender MA Stack-Indikator: Dies ist ein Indikator für einen einzigen Zeitrahmen und eine einzige Währung. Er betrachtet die MAs und zeigt 3 mögliche Zustände im Chart an: Wenn sich alle MA nach oben ausrichten: Aufwärts stapeln Wenn sich alle MA nach unten ausrichten: Abwärts stapeln Wenn MAs nicht ausgerichtet sind: Keine stapeln Hier kostenlos erhältlich: https://www.mql5.com/en/market/product/69539
Sie können den kleinen Block auf Ihrem Chart positionieren. Und den aktuellen Status de
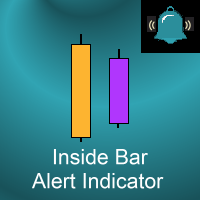
Dieser Indikator markiert Inside Bars (Bars mit einem niedrigeren Hoch und einem höheren Tief als der vorherige Bar) auf Ihrem Chart. Er sendet auch Benachrichtigungen , wenn sich ein solcher bildet, auch per E-Mail oder Push-Benachrichtigung auf Ihr Telefon . Es ist ideal, wenn Sie über die Entstehung eines Inside Bars benachrichtigt werden möchten, aber nicht den ganzen Tag vor Ihrem Chart sitzen möchten. Sie können alle Einstellungen konfigurieren, darunter: Welches Symbol (falls vorhanden) z
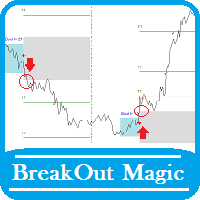
<< Sehen Sie auf YouTube, wie es funktioniert >> Sie können auch das Skript dieses Indikators hier kostenlos herunterladen: BreakOutMagic_EA.ex4 Kopieren Sie es dann an die folgende Adresse: ...\MetaTrader 4\MQL4\Experts Beachten Sie, dass das Skript nur dann funktioniert, wenn Sie den Break Out Magic Indikator bereits heruntergeladen und aktiviert haben. Möglichkeiten:
Pfeilsignal zum Kauf, Verkauf und Erreichen der Ziele Alarmsignal Mail senden Benutzerdefinierte Audiodatei ausführen Der Brea

Der GGP Wave Trend Oscillator MT4 Indikator ist ein Volatilitäts- und Momentum-Indikator, der entwickelt wurde, um Händlern zu helfen, ihre Trading-Performance zu optimieren und ihnen zu helfen, die genauesten Marktumkehrungen zu finden. Dieser Indikator ist eine MT4-Konvertierung des Indikators: WaveTrend Oscillator [WT] von " LazyBear " auf der Trading View-Website. Es wurden einige Warnmethoden hinzugefügt, um Echtzeit-Warnungen zu liefern, wenn ein Handelssignal generiert wird, damit Händler

Dieser Indikator zeigt den Haupttrend, die Einstiegszone und die Ausstiegszone an. Es handelt sich um einen Multi-Timeframe-Indikator, d.h. er wird immer in der aktuellen Periode des höheren Timeframes neu gezeichnet.
Merkmale Farbiges Histogramm: es zeigt den Haupttrend an, die Tomate bedeutet, dass der Markt bärisch ist, und das Himmelblau bedeutet, dass der Markt bullisch ist. Innere blaue Bänder: es ist die Einstiegszone für den Einstieg in den Markt, der Markt ist relativ sicher für den E

Der UT Bot Alert MT5 Indikator ist ein fortschrittliches technisches Analysewerkzeug, das Tradern helfen soll, ihre Handelsperformance zu optimieren. Dieser Indikator ist eine MT5-Konvertierung des UT Bot Alerts-Indikators von "QuantNomad" auf der Trading View-Website. Es wurden einige Warnmethoden hinzugefügt, um Echtzeit-Warnungen zu liefern, wenn ein Handelssignal generiert wird, damit Händler schnell und effizient handeln können. Hauptmerkmale: Alarmtypen: Zusätzlich zu den Terminal-Popup-Al
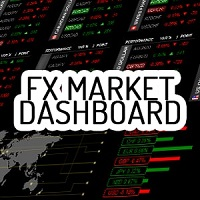
Fx Market Dashboard ist ein sehr innovatives Tool, das sich durch sehr professionelle Grafiken auszeichnet. Die Vereinfachung der Lesung des Marktes war schon immer unser Vorrecht und wir glauben, dass mit diesem Tool jeder den Markt besser verstehen kann. Dieses Tool soll uns vor allem einen klaren Überblick über die stärksten und schwächsten Währungen verschaffen, damit wir besser verstehen, wo der Markt Geld anlegt oder abzieht. Die Ablesung der prozentualen Logik dient der Präzision bei der

Der Super-Oszillator-Indikator ist ein Oszillator zur Berechnung von Trendumkehrpunkten. Eine Reihe von Balkenberechnungen und eine Reihe von Algorithmen zur Berechnung von Trendumkehrpunkten. Level-Sondierungssystem mit hoher Trendwahrscheinlichkeit. All diese Funktionen erleichtern den Anlegern das Auffinden von Trends.
Vorschläge und Funktionen Der Super-Oszillator-Indikator verfügt über zwei Ebenen. Sie liegen bei den Werten 0,5 und -0,5. Der Oszillatorbalken sollte unter -0,5 liegen, um ei

Dieser Expert Advisor führt keinen Handel durch, sondern scannt die gesamten Symbole in Ihrer Marktüberwachung und scannt jede Aktie einzeln in verschiedenen Zeitrahmen und zeigt Ihnen am Ende, welches Symbol in welchem Zeitrahmen eine starke Engulfing-Kerze hat.
Darüber hinaus können Sie einen MA-Zeitraum und ein oberes und unteres RSI-Limit definieren und es zeigt Ihnen, welche Symbole in welchem Zeitrahmen den angepassten gleitenden Durchschnitt kreuzen werden und welches Symbol in welchem
FREE
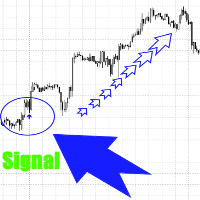
Dieser Indikator zeichnet keine Signale neu und das bedeutet, dass dort, wo er einen Pfeil zeichnet, dieser auch bleibt. Die Signale werden hier und jetzt gezeichnet, und nicht nach einer Weile, wenn der Preis weit weg ist.
Der Indikator ist perfekt für den Trendmarkt.
Der Indikator ist ein Assistent im Handel, er gibt ein Signal zum Kauf oder Verkauf, und Sie entscheiden, ob Sie die Empfehlungen des Indikators verwenden oder nicht.
Der Preis des Indikators ist minimal und kann jederzeit stei

"Der Trend ist dein Freund" ist eine der ältesten und bekanntesten Redewendungen auf den Finanzmärkten. Diese Aussage gibt jedoch nur die Hälfte des Bildes wieder. Die korrekte Aussage sollte lauten: "Der Trend ist nur so lange dein Freund, bis er endet." Der KT Trend Filter löst dieses Problem, indem er den Beginn eines Aufwärts- und Abwärtstrends anhand einer Mittelwertgleichung für die Preisreihen eindeutig anzeigt. Wenn die Trendrichtung nicht klar ist, zeigt er den Trend als Seitwärtstrend

Der glatte Heikin Ashi liefert ein glatteres Signal für Aufwärts- oder Abwärtstrends als normale japanische Kerzen oder sogar die Standard-Heikin-Ashi-Kerzen. Heikin Ashi ist ein alternatives Candlestick-Muster, das seit seiner Erfindung in Japan in den 1700er Jahren verwendet wird. Bei normalen japanischen Candlesticks gibt es eine Menge Lärm mit gemischten bärischen und bullischen Kerzen nebeneinander, sogar während Trends. Der Heikin Ashi reduziert dieses Rauschen und ermöglicht eine einfache

KT Trend Magic zeigt die Trenddarstellung auf dem Chart durch die Kombination von Marktmomentum und Volatilität. Ein Glättungskoeffizient wird verwendet, um das Rauschen des Signals zu glätten, und kann verwendet werden, um die neuen Einträge zu finden oder die von anderen EA/Indikatoren erzeugten Trades zu bestätigen.
Verwendung
Drag n Drop MTF Scanner, der nach neuen Signalen über mehrere Zeitrahmen hinweg sucht. Finden Sie neue Einträge in der Trendrichtung. Verbessert die Genauigkeit andere

Kontaktieren Sie mich nach der Bezahlung , damit ich Ihnen das Benutzerhandbuch PDF Datei.
Doppeltes Oben/Unten-Muster
Double Top and Bottom Patterns sind Chartmuster, die auftreten, wenn sich die zugrunde liegende Investition in einem ähnlichen Muster wie der Buchstabe "W" (Double Bottom) oder "M" (Double Top) bewegt. Double Top- und Bottom-Analysen werden in der technischen Analyse verwendet, um die Bewegungen eines Wertpapiers oder einer anderen Anlage zu erklären, und können als Teil einer
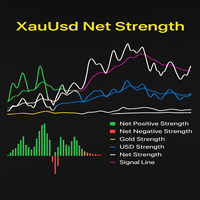
Der XauUsd-Netto-Stärke-Indikator ist ein professionelles Marktstärkeinstrument, mit dem die relative Performance von Gold (XAU) gegenüber dem US-Dollar (USD ) über einen diversifizierten Korb von Währungspaaren verfolgt und verglichen werden kann. Anstatt sich auf ein einziges Diagramm zu stützen, aggregiert er Informationen aus mehreren Gold- und Dollar-Währungspaaren, wendet Gewichtungsfaktoren an und setzt die Ergebnisse in einen leicht lesbaren Stärkevergleich um. Der Indikator stellt sechs

RSI Signals ist ein einfacher Dashboard-Indikator, der die Werte des RSI-Oszillators (Relative Strength Index) für verschiedene Instrumente und vom Benutzer gewählte Zeitrahmen anzeigt. Darüber hinaus kann er vom Händler so konfiguriert werden, dass er Signale anzeigt, wenn sich der RSI in einem überkauften/überverkauften Zustand befindet, wenn er diese Werte überschreitet oder wenn er die 50er-Marke überschreitet, was bei einigen Strategien wichtig ist. Er ist einfach und leicht einzurichten. A
Der Ichimoku-Indikator ist ein ganzes System mit einer erstaunlichen Gewinnrate Viele Trader haben das Gefühl, dass der Chart unübersichtlich aussieht, wenn wir den Indikator in den Chart einfügen. Das liegt daran, dass der Indikator zu viele Elemente enthält. Wir haben jetzt eine Lösung für dieses Problem: "TT Ichimoku on off button indicator". ÜBER DIESEN INDIKATOR Dies ist ein Ichimoku-Indikator, der die Umschaltfunktion separat für jedes Element hat, d.h. Kumo-Wolken-Button, Kijun-Button, e

Anzeige der lokalen Zeit in Ihren Charts
Zeigen Sie Ihre lokale Zeit anstelle (oder zusammen mit) der MT4-Serverzeit an.
Anzeige eines Fadenkreuzes , das die aktuelle Kerzenzeit hervorhebt.
Passt sich automatisch an den Chart-Zoom an (Vergrößern oder Verkleinern).
Zeigt jeden Zeitrahmen an (M1 - Monat) und passt sich automatisch an, wenn der Zeitrahmen des Charts geändert wird.
Behandelt spezielle ½-Stunden-Zeitzonen , wie z. B. Indien.
Schnelle Darstellung ( keine Verzögerung) beim Scroll

Einführung in den GARCH-Indikator GARCH ist die Abkürzung für Generalized Autoregressive Conditional Heteroskedasticity (verallgemeinerte autoregressive bedingte Heteroskedastizität) und ist ein in der Finanzbranche häufig verwendetes Volatilitätsvorhersagemodell. Das GARCH-Modell wurde erstmals von dem dänischen Wirtschaftswissenschaftler Tim Peter Bollerslev im Jahr 1986 vorgestellt. Der Nobelpreisträger von 2003, Robert F. Engle, leistete mit Tims Arbeit ebenfalls einen wichtigen Beitrag zur
FREE
Chart Pattern Strategies Signals Indikator Version: 1.02
Übersicht Der Chart Pattern Strategies Signals Indicator ist ein umfassendes Dashboard für MetaTrader 4, das Händlern einen leistungsstarken Überblick über potenzielle Chartmuster-Setups auf mehreren Märkten bietet. Er überwacht eine anpassbare Liste von Instrumenten in Echtzeit und zeigt klare, umsetzbare Informationen direkt in Ihrem Chart an. Dieses Tool wurde entwickelt, um manuelle Händler bei der Identifizierung und Organisation von

Dies ist eine erweiterte Multi-Timeframe-Version des beliebten Hull Moving Average (HMA). Merkmale Grafisches Panel mit den Daten des HMA-Indikators aus allen Zeitrahmen gleichzeitig . Wenn der HMA auf einem beliebigen Zeitrahmen seine Richtung geändert hat, wird auf dem Panel ein Fragezeichen oder Ausrufezeichen angezeigt, begleitet von einer Text- und Audiomeldung. Die Meldungen können für jeden Zeitrahmen separat konfiguriert werden, indem die entsprechenden Kontrollkästchen aktiviert werden.
Sie können die Swaps aller Symbole im Market Watch in einem Dashboard anzeigen und vergleichen. Ein hilfreiches Tool für Händler, die den Swap zu ihrem Vorteil nutzen oder einfach nur vermeiden möchten, gegen strafende Swapsätze zu handeln. Wählen Sie, ob Sie die unbearbeiteten Swaps sehen möchten, die Swaps als Prozentsatz der Average True Range (ATR) anzeigen möchten oder den Währungsbetrag, den Sie jeden Tag für den Handel mit dem Symbol bei einer bestimmten Losgröße erhalten. Sortieren Sie d

MT4-Trendindikator mit einer Gewinnwahrscheinlichkeit von 70-90%! Funktioniert ohne Neuzeichnen und Verzögerungen. Trend Master PRO zeigt gute Ergebnisse auf allen Handelsinstrumenten: Währungen, Metalle, Indizes, Aktien, Kryptowährungen. Empfohlener Zeitrahmen: H1-H4.
Mehr Informationen über den Indikator finden Sie hier: https://www.mql5.com/en/blogs/post/744748
Empfehlungen für die Verwendung
Verwenden Sie die automatische Periodenerkennung Das Hauptmerkmal des Indikators ist die Selbstopt
Algorithmic & Quant Strategies Signals Dashboard für MT4 Bringen Sie Ihren Devisenhandel auf die nächste Stufe mit dem AQS Signals Dashboard , einem umfassenden und leistungsstarken Tool, das für ernsthafte Trader entwickelt wurde. Mit diesem Indikator müssen Sie nicht mehr ständig zwischen verschiedenen Charts wechseln, denn er bietet Ihnen ein zentrales, umfassendes Dashboard, das den gesamten Forex-Markt für Sie überwacht. Das AQS-Dashboard basiert auf bewährten algorithmischen und quantitati
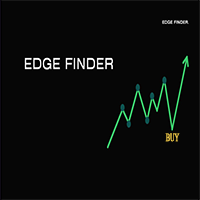
(Auffallend einfach, kraftvoll profitabel) Edge Finder ist Ihr umfassender visueller Handelsassistent, der das Marktrauschen durchbricht und auf einen Blick hochwahrscheinliche Handelsmöglichkeiten aufzeigt. Wie es funktioniert (Der Kerngedanke): Anstatt Ihr Diagramm mit komplexen Zahlen zu überfrachten, verwendet Edge Finder ein einzigartiges, farbkodiertes System, um das Marktbild klar darzustellen. Trend- und Momentum-Visualisierung : Der Indikator analysiert den Markt und färbt die Kursbalke

Institutioneller Flussindikator Ein intelligentes, volumenbasiertes Tool, das institutionelle Aktivitätszonen durch direkte Auftragsflussmuster erkennt.
Es zeigt, wo große Institutionen tätig sind. Ein fortschrittlicher Volumenindikator, der Rauschen herausfiltert, um wahrscheinliche institutionelle Muster zu identifizieren. Wichtigste Merkmale Intelligente Erkennung von Clustern Automatische Identifizierung Signal-Klassifizierung: Violett / Gelb - Institutionelle Zone - starke, anhaltende insti

Fraktalindikator für mehrere Zeitrahmen, der den Fraktalpunkt des höheren Zeitrahmens auf den niedrigeren Zeitrahmen anzeigt.
Parameter Fraktal_Zeitrahmen : Sie können die höheren Timeframes für Fraktale festlegen. Maxbar : Sie können die maximale Anzahl von Kerzen für die Berechnungen festlegen. Auf_Fraktal_Farbe, Auf_Fraktal_Symbol, Ab_Fraktal_Farbe, Ab_Fraktal_Symbol : Farb- und Stileinstellungen für die Fraktalpunkte. Linie_erweitern : Zeichnet eine horizontale Linie vom vorherigen Fraktalp
FREE
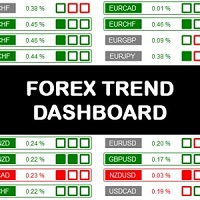
Das Forex Trend Dashboard ist ein wirklich außergewöhnliches Werkzeug für die Analyse und die Entscheidung, an welcher Börse Sie handeln möchten. Die Analyse von Währungskörben ermöglicht es Ihnen, die reale Situation des Marktes besser zu verstehen und Ihre eigenen operativen Ideen besser zu bewerten. Das Dashboard analysiert den Trend über verschiedene Zeithorizonte wie: täglich, wöchentlich und monatlich. Die sich daraus ergebenden Überlegungen sind sehr einfach: Der Eröffnungskurs der Sitzun
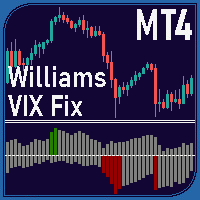
Überblick Der Williams VIX Fix-Indikator ist ein MetaTrader 4-Tool, das Händlern helfen soll, potenzielle Höchst- und Tiefststände des Marktes zu erkennen. Durch die Analyse von Preisextremen im Verhältnis zu den jüngsten Höchst- und Tiefstständen hebt er überkaufte und überverkaufte Bedingungen mithilfe von zwei Histogrammen hervor, die in einem separaten Fenster angezeigt werden. Der Indikator kombiniert die Berechnung des Williams VIX Fix mit Bollinger Bands und Schwellenwerten auf Perzentilb

Der Volumen-Oszillator ist ein beliebter Indikator, der in der Handelsansicht verfügbar ist und bei Händlern sehr beliebt ist. Definition Der Volumen-Oszillator ist ein Indikator, der aus zwei gleitenden Durchschnitten (MA) besteht, die das Volumen umgeben, wobei der eine schnell und der andere langsam ist. Der Wert des langsamen gleitenden Durchschnitts wird dann vom Wert des schnellen gleitenden Durchschnitts subtrahiert. Der Volumen-Oszillator misst das Volumen, indem er die Beziehung zwische
FREE
Major FX Signal Panel ( AI Trade Planner's) - Professionelles Intraday Signal Dashboard Erschließen Sie Ihr Intraday-Handelspotenzial mit einem leistungsstarken All-in-One Signal Dashboard. Haben Sie es satt, zwischen Charts zu wechseln und sich abzumühen, Intraday-Setups mit hoher Wahrscheinlichkeit zu finden? Dieses Panel ist ein professioneller MetaTrader 4-Indikator, der Ihnen einen entscheidenden Vorteil verschafft. Er scannt sieben wichtige Währungspaare in Echtzeit und liefert einen volls

MT5-Version MA-Band MT4 MA Ribbon ist ein erweiterter Indikator mit einem gleitenden Durchschnitt von 8 Perioden. Das MA-Band kann verwendet werden, um die Trendrichtung und Umkehrung zu identifizieren und Marktfortsetzungspunkte sowie potenzielle Einstiegspunkte, partielle Gewinnpunkte und Ausstiegspunkte. JETZT KOSTENLOS AUSPROBIEREN! Einstiegspunkte für Long- und Short-Positionen können gefunden werden, wenn der Preis in das Band eintritt oder es verlässt, erneut testet oder eine de

Einführung
Trendindikator, der keine Einstiegssignale neu zeichnet Zeigt einen genauen Preisumkehrindikator an. Ist eine Handelswaffe, die zu jedem Chart hinzugefügt werden kann. Die Umkehrsignale haben einen hohen Genauigkeitsgrad und eignen sich für Scalping-Trades auf 5-Minuten-Basis oder für den Handel in 30-Minuten-Schwankungen. Kauf- und Verkaufspfeile werden auf dem Chart als Einstiegssignale angezeigt, bilden aber am Ende der K-Linie Bestätigungsoptionen mit Warnungen. Viele Trader habe
FREE

SIE KÖNNEN JETZT KOSTENLOSE VERSIONEN UNSERER KOSTENPFLICHTIGEN INDIKATOREN HERUNTERLADEN. ES IST UNSERE ART DER RÜCKGABE AN DIE GEMEINSCHAFT! >>> HIER GEHT'S ZUM DOWNLOAD
Camarilla Pivots Historical stellt die historischen Daten der Camarilla Pivot Levels auf dem Chart dar. Die Camarilla Pivot Levels wurden 1989 von Nick Scott entwickelt. Die Niveaus werden von Intraday-Händlern als primäre Unterstützungs- und Widerstandsniveaus verwendet. Die Levels werden mit der folgenden Formel berechnet:
FREE
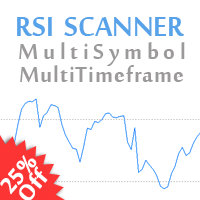
25% Rabatt. Ursprünglicher Preis: $40 RSI Scanner ist ein RSI-Dashboard mit mehreren Symbolen und Zeitrahmen, das den Relative Strength Index-Indikator auf überkaufte und überverkaufte Kurse in bis zu 28 Symbolen und 9 Zeitrahmen überwacht.
Demo hier herunterladen (Scannt nur M1 und M5) Beschreibung der Einstellungen hier MT5-Version hier
RSI Scanner Eigenschaften: Signalisiert, wenn der RSI in die überkaufte und überverkaufte Zone eintritt oder diese verlässt. Überwacht 28 anpassbare Instrum

Der Kanalindikator ist im Trend und wird nicht neu gezeichnet. Es erzeugt einen ATR-Preiskanal mit der entgegengesetzten Volatilitätsgrenze. Der Indikator hat sich in der Strategie des Handels auf Impulsniveaus und Fake Breakout gut bewährt. Der Einstiegspunkt sollte auf der Korrektur der Indikatorlinie gesucht werden und der Take-Profit sollte auf der gegenüberliegenden Grenze festgelegt werden. Blog-Link - Retest and Fake Breakout with UPD1 .
Eingabeparameter.
Bars Count - Geschichte zum
FREE

Das Verhalten verschiedener Währungspaare ist miteinander verbunden. Mit dem Visual Correlation -Indikator können Sie verschiedene Instrumente auf einem Diagramm anzeigen und dabei den Maßstab beibehalten. Sie können eine positive, negative oder keine Korrelation definieren.
Manche Instrumente beginnen sich früher zu bewegen als andere. Solche Momente können durch Überlagerung von Diagrammen bestimmt werden.
Um ein Instrument in einem Diagramm anzuzeigen, müssen Sie seinen Namen in das Feld S
FREE

Der Indikator basiert auf dem Konzept der Preiskanäle, die durch Aufzeichnung der höchsten Höchst- und niedrigsten Tiefstkurse über einen bestimmten Zeitraum gebildet werden. Der Donchian-Kanal-Indikator besteht aus drei Linien: einer oberen Kanallinie, einer unteren Kanallinie und einer mittleren Kanallinie. Die obere Kanallinie stellt das höchste Hoch über einen bestimmten Zeitraum dar, während die untere Kanallinie das niedrigste Tief darstellt. Die mittlere Kanallinie ist der Durchschnitt de
FREE

Dieser Indikator stellt ein anderes Symbol auf dem aktuellen Chart dar. Für das Symbol kann ein anderer Zeitrahmen verwendet werden, mit der Option, es in einem Modus mit mehreren Zeitrahmen anzuzeigen (1 Overlay-Kerze für mehrere Chart-Kerzen). Grundlegende Indikatoren sind vorhanden. Um die Skalierung der Preise von verschiedenen Symbolen anzupassen, werden die Overlay-Preise auf den sichtbaren Chart-Preisraum skaliert.
Funktionen Symbol- und Zeitrahmeneingabe MTF-Anzeige Option zur vertikale
FREE

MASi Three Screens basiert auf der Handelsstrategie von Dr. Alexander Elder. Dieser Indikator ist eine Sammlung von Algorithmen. Die Algorithmen basieren auf der Analyse von Charts verschiedener Zeitrahmen. Sie können jeden der angebotenen Algorithmen anwenden.
Liste der Versionen der Algorithmen:
ThreeScreens v1.0 - Eine einfache Implementierung, mit Analyse der MACD-Linie; ThreeScreens v1.1 - Eine einfache Implementierung, mit Analyse des MACD-Histogramms; ThreeScreens v1.2 - Kombiniert die
FREE

Beherrschen Sie den Markt mit CCI Crossover Master! Hören Sie auf zu raten und fangen Sie an, mit Vertrauen zu handeln! Der CCI Crossover Master-Indikator ist Ihre Geheimwaffe, wenn es darum geht, hochwahrscheinliche Bewegungen auf der Grundlage bewährter Momentum- und Trendanalysen zu erfassen. Er vereinfacht die komplexe "CCI Crossover Master "-Strategie und liefert Ihnen kristallklare Kauf- und Verkaufssignale direkt auf Ihrem Chart. Die wichtigsten Vorteile, die Ihren Erfolg ausmachen: Präz
FREE

Dieser Indikator wendet den Biquad-Hochpassfilter auf die Preisdiagrammdaten an und zeigt die Filterausgabe für den OHLC als Kerzenständer an. Die Candlesticks entsprechen den tatsächlichen Berechnungen des Filterwerts während der Bildung jedes Kursbalkens (nicht aus allen historischen Höchst-, Tiefst- oder Schlusskursen). Die Form der Balken entspricht daher direkt der Form der einzelnen Kursbalken. Hochpassfilter sind ein unterschätzter Oszillatortyp, der in der technischen Analyse nur selten
FREE

Fractal ist einer der wichtigsten Indikatoren in einer Reihe von Strategien. Volume Fractals hat die Funktionalität der Standardversion des Indikators erweitert. Das Produkt bietet die Möglichkeit, Fraktale zu sortieren und Fraktale anzuzeigen, die sowohl Preis- als auch Volumenextrempunkte darstellen.
Anwendung Stop Losses Umkehrsignale Platzierung von Pending Orders für einen Fraktal-Ausbruch
Optionen Balken der Historie - Anzahl der Chart-Balken, für die der Indikator angezeigt wird Linksse
FREE
Laden Sie die kostenlose USDJPY-Version hier herunter .
MACD-Indikator Der MACD (Moving Average Convergence and Divergence) ist ein Trendfolgemomentum-Indikator, der die Beziehung zwischen zwei gleitenden Durchschnitten anzeigt, die wir auswählen und für den Indikator konfigurieren. Der MACD wird durch Subtraktion des exponentiellen gleitenden Durchschnitts mit einer Dauer von 26 Perioden und des gleitenden Durchschnitts mit einer Dauer von 12 Perioden berechnet. Dies sind die Standardparameter

"Wouldn't we all love to reliably know when a stock is starting to trend, and when it is in flat territory? An indicator that would somehow tell you to ignore the head fakes and shakeouts, and focus only on the move that counts?" Der Choppiness-Index ist ein richtungsunabhängiger Indikator, mit dem festgestellt werden kann, ob der Markt abgehackt (seitwärts tendierend) oder nicht abgehackt (innerhalb eines Trends in eine der beiden Richtungen tendierend) ist. Es handelt sich um einen oszillieren

Der Indikator zeigt zwei gleitende Durchschnittslinien auf dem Chart an, deren Parameter in den Einstellungen festgelegt sind. Am Schnittpunkt dieser gleitenden Durchschnitte gibt er ein Signal in Form von Pfeilen und einem Ton aus . In den Einstellungen des Indikators können Sie den Zeitraum des schnellen gleitenden Durchschnitts ( Fast MA Period ) und des langsamen gleitenden Durchschnitts ( Slow MA Period ) festlegen. Außerdem können Sie die Verschiebung, den angewandten Preis, die Methode un
FREE

MT5-Version Elliot-Wave-Oszillator MT4 Der Elliot Wave Oscillator MT4 ist ein Indikator, der zur Unterstützung der Elliot Wave-Zählung entwickelt wurde. Die Standardeinstellungen helfen dabei, das Rauschen auf dem Markt herauszufiltern, was eine klare Wahrnehmung der Wellenzahlen in verschiedenen Zeiträumen ermöglicht. Der hohe Anpassungsgrad des Elliot Wave Oscillator ermöglicht es Ihnen, diesen Indikator an Ihre persönlichen Vorlieben anzupassen. Kürzere Zeiträume und schneller reagierende M

Produkttitel Smart Bollinger Bands (MT4) – Teil der SmartView Indicators Serie Kurzbeschreibung Ein Bollinger Bands -Indikator mit einzigartiger Benutzererfahrung auf der MetaTrader-Plattform. Bietet erweiterte Funktionen, die zuvor nicht verfügbar waren, wie das Öffnen von Einstellungen per Doppelklick, das Ausblenden und Anzeigen von Indikatoren ohne Löschung und die Anzeige des Indikatorfensters in voller Chartgröße. Entwickelt für nahtlose Zusammenarbeit mit dem Rest der SmartView Indicators
FREE

Der Donchian-Kanal (Donchian-Kanal-Indikator) ist einer der ältesten und einfachsten technischen Indikatoren für den Handel mit Ausbrüchen. Im Allgemeinen gilt: Je breiter der Donchian-Kanal ist, desto volatiler ist der Markt, und je schmaler der Donchian-Kanal ist, desto weniger volatil ist der Markt . Außerdem können sich die Kurse durch die Bollinger-Bänder bewegen, was beim Donchian-Kanal nicht der Fall ist, da die Bänder die Höchst- und Tiefststände eines bestimmten Zeitraums messen. Prakti
FREE

Dieser Indikator ist sehr nützlich für Daytrader oder kurzfristige Trader. Sie brauchen die Anzahl der Pips nicht manuell zu berechnen. Schauen Sie einfach auf den Chart und Sie werden die virtuelle Take Profit / virtuelle Stop Loss Ziellinie sehen und einschätzen, ob der Einstiegspunkt machbar ist, um das beabsichtigte Ziel zu erreichen oder nicht.
Geben Sie die beabsichtigten Take Profit / Stop Loss Pips für Ihren Handel ein. Der Indikator zeigt die virtuellen Take Profit- und Stop Loss -Lin
FREE

Dieser Indikator basiert auf den Ideen von Dan Valcu.
Kerzenkörper (offen-geschlossen) sind die Hauptkomponente, die verwendet wird, um Trendrichtung, Stärke und Umkehrungen anzuzeigen und zu bewerten.
Der Indikator misst die Differenz zwischen Heikin Ashi schließen und öffnen.
Die Messung der Höhe der Kerzenkörper führt zu extremen Werten, die auf Trendverlangsamungen hinweisen. Auf diese Weise wird der Heikin Ashi quantifiziert, um frühere Signale zu erhalten.
Ich habe diesen Indikator au
FREE

40% Rabatt. Ursprünglicher Preis: $50
Ichimoku Trend Finder ist ein Multi-Symbol-Multi-Timeframe-Trend-Dashboard, das Händlern hilft, potenzielle Markttrends von einem Chart aus zu überwachen und zu identifizieren. Dieses Panel scannt den Ichimoku Kinko Hyo-Indikator in 28 konfigurierbaren Instrumenten und 9 Zeitrahmen für klassische Ichimoku-Trendsignale mit einer Tiefenscan-Funktion, um alle Marktbeobachtungssymbole zu scannen (bis zu 1000 Instrumente!) .
Demo hier herunterladen (Scannt nur

Mit den "M.M. Deepness Arrows" erhalten Sie einen einfachen Zugang zu einem tiefen Wissen über die Marktbewegung! Dieser Indikator wird Ihnen Kauf- und Verkaufsempfehlungen geben, nachdem er die Tiefe des Marktes analysiert hat. Der "Trigger" für den Einstieg wird nach dem Studium der Höchst- und Tiefstwerte jeder Kerze gegeben, um so die irreführenden Daten der Eröffnungs- und Schlusskurse (die von den Brokern angegeben werden) zu vermeiden. Dank dieser Pfeile können Sie leicht erkennen, ob es

Beherrschen Sie den Markt mit Reversal Dominator! Haben Sie es satt, Trends hinterherzulaufen, nur um von einer plötzlichen Trendwende überrascht zu werden? Reversal Dominator ist Ihre ultimative Waffe, um hochwahrscheinliche Marktwenden zu erkennen , bevor sie offensichtlich werden. Dieser leistungsstarke Indikator nutzt eine ausgeklügelte Berechnung der absoluten Stärke, gepaart mit einem intelligenten Filter für gleitende Durchschnitte, um Ihnen den präzisen Vorteil zu verschaffen, den Sie b
FREE
Leistungsstarker Orderblock-Indikator in der Tradingview-Plattform. Indikator-Typ: Preis-Aktions-Indikator Einführung: Der Order-Block-Indikator - Erhöhen Sie Ihre Price-Action-Analyse. Wenn Sie auf der Suche nach einem umfassenden Orderblock-Indikator auf der MQL5-Plattform sind, brauchen Sie nicht weiter zu suchen.
Nach diesem Indikator wird ein OB als eine Zone mit ausstehenden Aufträgen von großen Institutionen verstanden, die noch nicht vollständig ausgeführt wurden und sich auf dem Markt
Hör auf zu raten, fang an zu schießen: Der neue SR Sniper! Haben Sie genug von zufällig erscheinenden Einstiegspunkten? Der SR Sniper-Indikator ist Ihr neues, unverzichtbares Werkzeug, um mit chirurgischer Präzision hochwahrscheinliche Trades zu finden. Er wurde entwickelt, um das Marktrauschen zu durchdringen und Ihnen klare Kauf- und Verkaufssignale genau an den kritischsten Preiszonen zu geben. Dieser leistungsstarke Indikator kombiniert die dynamische Analyse des Commodity Channel Index (CC
FREE

Dieses Dashboard zeigt Ihnen den aktuellen Status der 3MA Cross Overs für Multiwährungs-Multitimeframes. Funktioniert für die Plattform Metatrader 4 (MT4). Ausführlicher Beitrag:
https://www.mql5.com/en/blogs/post/759238
Wie es funktioniert:
MA Cross-Signale Es werden "S" grün/rote starke Signale und "M" oder "W" grün/rote mittlere oder schwache Signale angezeigt. Es gibt 3 Arten von MA: Faster, Medium und Slower MA. Ein starkes Signal liegt vor, wenn der FasterMA und der MediumMA beide über/u

Heiken Ashi-Schaltfläche Heiken-Ashi , oft auch Heikin-Ashi geschrieben, ist ein japanisches Wort und bedeutet "Durchschnittsbalken". Der Heiken-Ashi-Ansatz kann in Verbindung mit Candlestick-Charts verwendet werden, um Markttrends zu erkennen und künftige Kurse vorherzusagen. Er ist nützlich, um Candlestick-Charts leichter lesbar zu machen und Muster zu analysieren. Mit Hilfe von Heiken-Ashi-Diagrammen können Händler bestimmen, wann sie bei einem anhaltenden Trend im Handel bleiben und bei ein
FREE
Hochgradig konfigurierbarer Indikator für Akkumulation und Verteilung (AD). Merkmale: Hochgradig anpassbare Alarmfunktionen (bei Levels, Kreuzen, Richtungsänderungen per E-Mail, Push, Sound, Popup) Multi-Timeframe-Fähigkeit Farbanpassung (bei Pegeln, Kreuzen, Richtungsänderungen) Optionen für lineare Interpolation und Histogramm-Modus Funktioniert im Strategie-Tester im Multi-Timeframe-Modus (auch am Wochenende ohne Ticks) Einstellbare Levels Parameter:
Ad Timeframe: Sie können die unteren/höhe
FREE

Laden Sie die Indikator-Datei hier direkt herunter (wenn Sie sie nicht auf MT4 öffnen können) Der MACD-Indikator ist einer der beliebtesten Momentum-Indikatoren unter den Nutzern. Die Suche und Erkennung von MACD-Signalen mit dem bloßen Auge ist nicht immer einfach. Vollständige Charts scannen Der Dashboard-Indikator mit seiner einfachen Benutzeroberfläche und dem Panel zur Anpassung der Suche spart Zeit und scannt alle Charts für die Suche nach MACD-Signalen und benachrichtigt den Benutzer mit
FREE
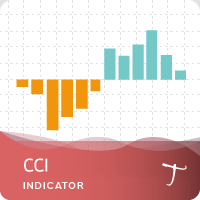
28 Symbole, leistungsstarkes Dashboard mit mehreren Zeitfenstern für eine vollständige Marktübersicht Anpassbare Kauf-/Verkaufswarnungen, Push-Benachrichtigungen, E-Mail-Benachrichtigungen und visuelle Warnungen auf dem Bildschirm. Markierte Kauf-/Verkaufssignale Zweifarbiges Trend-Histogramm. Der Commodity Channel Index (CCI) ist ein Oszillator, der ursprünglich von Donald Lambert im Jahr 1980 eingeführt wurde. Der CCI misst das aktuelle Preisniveau im Verhältnis zu einem durchschnittlichen Pr
FREE

Der Indikator My Big Bars kann Balken (Kerzen) in einem höheren Zeitrahmen anzeigen. Wenn Sie ein H1-Diagramm (1 Stunde) öffnen, zeigt der Indikator darunter ein H4-Diagramm, ein D1-Diagramm und so weiter an. Die folgenden höheren Zeitrahmen können verwendet werden: M3, M5, M10, M15, M30, H1, H3, H4, H6, H8, H12, D1, W1 und MN. Der Indikator wählt nur die höheren Zeitrahmen aus, die über dem aktuellen Zeitrahmen liegen und ein Vielfaches davon sind. Wenn Sie einen M30-Chart (30 Minuten) öffnen,
FREE
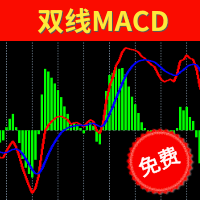
Zwei Linien MACD Viele Leute, die technische Transaktionen mit MT4 durchführen, verwenden gerne den MACD, um die Wende oder Fortsetzung des Marktes zu beurteilen. Wenn man den MACD-Indikator von MT4 verwendet, stellt man fest, dass der Indikator ein einzeiliger MACD ist und das Histogramm der Vergangenheit zu ähneln scheint. Der MACD, den ich verstehe, passt nicht dazu. Um den Händlern ein perfektes Handelserlebnis zu bieten, stellen wir speziell für alle Trader kostenlose zweizeilige MACD-Indi
FREE

IceFX Heatmap ist ein spezieller Indikator, der die Orte anzeigt, an denen sich der Preis in den letzten Tagen aufgehalten hat und sich bewegt hat. Diese Stellen werden in einem "Heatmap-Stil" angezeigt, mit dem Sie die wichtigsten gebildeten Bänder deutlich sehen können. Die Hauptkurse (in denen der Preis viel "verweilt" hat) werden in hellen Farben (bei der Schwarz-Weiß-Ansicht) oder in roter Farbe (bei der Farbansicht) angezeigt.
Einstellungen Tage - die Anzahl der Tage, für die die Wärme(ka
FREE

Wenn Sie dieses Projekt mögen, hinterlassen Sie eine 5-Sterne-Bewertung. Der Handel mit großen Volumina erfordert, dass wir mehrere Instrumente/Charts
betrachten
neue Möglichkeiten zu finden, wird dieser Indikator Ihnen helfen, indem Sie
spezifische
Ebenen durch das Vielfache einer Anzahl oder deren Suffix und aktualisieren sie
automatisch
als sich der Preis ändert, eine Aufgabe, die sonst mühsam wäre. Zum Beispiel, auf GBPUSD, könnten Sie 4 Instanzen des Indikators auf dem
Diagramm: Je 0,01
FREE

Der Supertrend-Indikator zeigt Ihnen den Trend anhand einer auf der ATR basierenden Berechnung an.
Wie funktioniert er? Der Supertrend zeichnet eine Linie, die dem aktuellen Trend folgt. Diese Linie ist das Ergebnis der Berechnung mit der ATR. Eine Linie unter der Kerze bedeutet einen wahrscheinlichen Aufwärtstrend Eine Linie oberhalb der Kerze bedeutet einen wahrscheinlichen Abwärtstrend.
Wie man mit dem CSL-Indikator handelt Kaufen, wenn die Supertrend-Linie unter dem Preis liegt, Verkaufen,
FREE
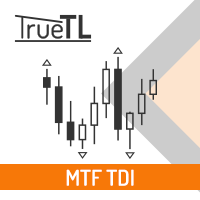
Hochgradig konfigurierbarer Trader Dynamic Index (TDI) Indikator.
Merkmale: Hochgradig anpassbare Alarmfunktionen (bei Levels, Kreuzen, Richtungsänderungen per E-Mail, Push, Sound, Popup) Multi-Timeframe-Fähigkeit (auch höhere und niedrigere Timeframes) Farbanpassung (bei Levels, Kreuzen, Richtungsänderungen) Optionen für lineare Interpolation und Histogramm-Modus Funktioniert im Strategie-Tester im Multi-Timeframe-Modus (auch am Wochenende ohne Ticks) Einstellbare Levels Parameter:
TDI Timefr
FREE
Der MetaTrader Market ist die beste Plattform für den Verkauf von Handelsroboter und technischen Indikatoren.
Sie brauchen nur ein gefragtes Programm für die MetaTrader Plattform schreiben und schön gestalten sowie eine Beschreibung hinzufügen. Wir helfen Ihnen, das Produkt im Market Service zu veröffentlichen, wo Millionen von MetaTrader Benutzern es kaufen können. Konzentrieren Sie sich auf dem Wesentlichen - schreiben Sie Programme für Autotrading.
Sie verpassen Handelsmöglichkeiten:
- Freie Handelsapplikationen
- Über 8.000 Signale zum Kopieren
- Wirtschaftsnachrichten für die Lage an den Finanzmärkte
Registrierung
Einloggen
Wenn Sie kein Benutzerkonto haben, registrieren Sie sich
Erlauben Sie die Verwendung von Cookies, um sich auf der Website MQL5.com anzumelden.
Bitte aktivieren Sie die notwendige Einstellung in Ihrem Browser, da Sie sich sonst nicht einloggen können.