Technische Indikatoren für den MetaTrader 4 - 95
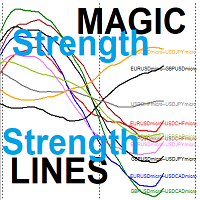
die MAGIC Smooth Strength-Linien für Devisenpaare Jede Linie stellt die relative Stärke von zwei Paaren aus 5 vom Benutzer eingegebenen Symbolen dar -> 10 Indikatorlinien Ihre Strategie basiert auf der Auswahl der schwächeren Stärke-Linie und dem Warten auf ein Umkehrsignal ODER Ihre Strategie basiert auf der Auswahl der stärkeren Stärke-Linie und dem Warten auf ein Umkehrsignal Wenn die Umkehrung eintritt, handeln Sie mit den beiden Symbolen, die durch diese Linie dargestellt werden. wie die r

Sie können z . B. den Croisement MA auf D1, die Grundtendenz, die Niveaus von Surachat und Survente des RSI auf H4 und der Stochastik auf H4 überwachen .
Cet indicateur surveille: den Anstieg der Mobilfunkfrequenzen das Niveau von Surachat / Survente du RSI das Niveau von Surachat / Survente du stochastique IL benachrichtigt Sie, wenn die drei Filter Ihren Parametern entsprechen (Push, Pop, Mail) Sie können wählen, ob Sie die Grafik für eine einzelne Einheit oder für mehrere Paare in derselben

Scanner und Dashboard für den Cycle Sniper ATR Fibo Channels Indikator
Wie die Benutzer wissen, zeichnet der Indikator Fibonacci-Kanäle und Pfeile nach den Einstellungen des Benutzers.
Mit CS ATR Fibo Channels Scanner haben Sie die Möglichkeit, den Markt zu beobachten.
- Multi Zeitrahmen - Mehrere Instrumente
Geben Sie die zu beobachtenden Parameter ein (wie in Cycle Sniper ATR Fibo Channels Indikator erklärt)
- Wenn Sie "Pfeile nach ATR-Levels" wählen, erhalten Sie die potenziellen Umkehrp

Beschreibung Candle Power Color-Indikator, der anzeigt, wann sich der Markt im Trend befindet und wann er in einer Seitwärtsbewegung ist KEY LINKS: Installationsanleitung - Häufige Fragen - Alle Produkte Wie nützlich ist dieser Indikator? Er ermöglicht die Erkennung von Trend- und Seitwärtsbewegungen im Markt Er färbt sich NIEMALS neu. Er passt sich an jeden Markt und Vermögenswert an. Er kann jede andere Handelsstrategie unterstützen. Anmerkung 1: Dieser Indikator sollte nur als Teil einer Hand

Eine Top-Qualität von dem berühmten XSuper Trend Indikator. Er ist dem ursprünglichen Algorithmus vollständig treu und implementiert viele nützliche Funktionen, die Trendindikatoren wie Filter wie MACD, CCI und Alligator beinhalten. Der Chefs Super Trend Plus Indikator ist eine hervorragende Möglichkeit, den aktuellen Markttrend zu erkennen. Der Indikator zeigt eine klare Unterscheidung zwischen Auf- und Abwärtstrends. Der Indikator verfügt über optionale Filter für fundierte Signale. Geeignet
Wenn Sie diesen Indikator mit der Master-Version kombinieren, erhalten Sie eine bessere Übersicht im visuellen Backtesting-Modus. https://www.mql5.com/en/market/product/61572 Sie helfen Ihnen bei der Entwicklung einer Handelsstrategie für mehrere Zeitrahmen.
1) Führen Sie einen Backtest im visuellen Modus durch
2) Fügen Sie den Master-Indikator in den Backtesting-Chart ein
3) Fügen Sie die Slave-Indikatoren zu anderen Charts desselben Symbols mit unterschiedlichen Zeitrahmen hinzu.
Starten
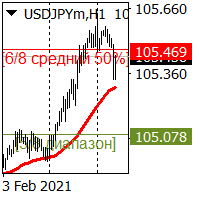
Der Indikator zeigt Unterstützungs- und Widerstandsniveaus genau an. Visualisiert wichtige starke Niveaus und durchschnittliche Stärke-Niveaus auf dem Diagramm.
Es ist wichtig, dass der Indikator nicht abhängig von der Änderung des Zeitrahmens neu gezeichnet wird.
Der Indikator kann für jede Form des Handels verwendet werden, Scalping, mittelfristiger Handel... für jedes Währungspaar.
Für den mittelfristigen Handel empfehlen wir die Verwendung der Standardparameter.
Alle Parameter des Indik
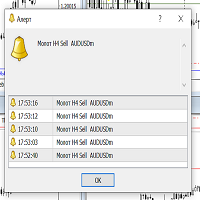
Der Indikator ist sowohl für erfahrene Trader als auch für Anfänger geeignet. Zeigt das HAMMER-Kerzenmuster an.
Scannt gleichzeitig H1, H4 und D1 und zeigt den entsprechenden Alarm auf dem Bildschirm an, begleitet von einem akustischen Signal.
Der Alarm zeigt Informationen über den Zeitrahmen des Musters und das Handelssymbol, auf dem das Muster erschienen ist.
Nur Sie können auf der Grundlage des Musters entscheiden, ob Sie in den Markt einsteigen. Da es besser ist, von den Unterstützungs-

Beschreibung
Bitcoin Manager ist der beste Indikator für den Handel mit der Kryptowährung Bitcoin. Er wird auf der Grundlage der Preisabweichung vom gleitenden Durchschnittskanal berechnet. Aufsteigende und absteigende Pfeile zeigen mögliche Punkte und Niveaus für die Eröffnung von Kauf- und Verkaufspositionen an.
Wie wird er verwendet?
Wir empfehlen dringend, diesen Indikator auf dem H1-Zeitrahmen zu verwenden. Ein Aufwärtspfeil zeigt ein Kaufniveau an. Abwärtspfeil - Verkaufsniveau.
Param
Binäre Optionen sind die Märkte, auf denen die ausgewählten Vermögenswerte entsprechend den Schätzungen gehandelt werden, in welche Richtung sie sich in einem bestimmten Zeitraum bewegen werden. Was aktiv genannt wird, sind Anlageinstrumente wie Aktien, Devisen und Gold.
Ein Beispiel: Sie glauben, dass sich eines dieser Instrumente in 10 Minuten nach oben bewegen wird. Sie haben eine der entsprechenden Optionen gekauft. Wenn sich Ihre Erwartung bei Ablauf der Frist erfüllt, verdienen Sie fast

RoboS-Indikator Version 1.5 Der RoboS-Indikator ist ein Handelsinstrument, das Ihre Marktanalyse verbessert. Mit fortschrittlichen Funktionen wie Kauf- und Verkaufssignalen vereinfacht er die Entscheidungsfindung für Trader aller Erfahrungsstufen. Dieser Indikator ist mit allen Symbolen und Zeitrahmen kompatibel, was ihn zu einer vielseitigen Ergänzung für jede Handelsstrategie macht.
Merkmale Signalpfeile: Mit den optionalen Pfeilen können Sie Kauf- und Verkaufschancen klar und deutlich erken

Diese Strategie ist am besten für den trendbasierten Handel geeignet. Während der Markt im Trend ist, macht der Preis noch kleinere Bereiche. Darvas-Boxen zeigen Ausbrüche aus diesen kleinen Bereichen, während sie immer noch dem ursprünglichen Markttrend folgen. Detaillierte Beschreibung: https://www.mql5.com/en/blogs/post/747919
Merkmale:
Darvas - Prüfen Sie den Ausbruch aus der Darvas-Box
- Prüfen Sie, ob der Kurs über/unter dem MA liegt oder ob die Darvas-Box den MA überschritten hat
- Min.
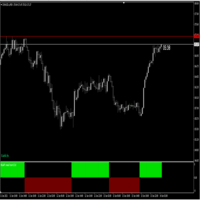
Follow Trend Indikator, Indikator funktioniert auf Währungen, Indizes, Aktien, Gold usw., gut für die Verfolgung von Trends auf den Märkten geeignet für Scalping Kaufregeln; Wenn die Histo auf Blau wechselt, platzieren Sie eine Kauforder, Stop Loss knapp unter dem vorherigen Swing-Low Verkaufsregeln: Wenn die Histo auf Rot wechselt, platzieren Sie eine Verkaufsorder, Stop Loss knapp unter dem vorherigen Swing-Hoch. Handeln Sie auf einem Zeitrahmen, der am besten zu Ihrem Handelsstil passt

Day Trades Resistance and Support (daytradesSR) ist ein Indikator, der aus folgenden Elementen besteht 1. der Hauptlinie (Unterstützungs-/Widerstandslinie), die anzeigt i. entweder einen Aufwärts- oder Abwärtstrend ii. dynamische Unterstützungs- oder Widerstandsebenen 2. einer spezifischen Spanne , die durch eine Linie für die obere Spanne und eine weitere Linie für die untere Spanne definiert ist. Diese Linien dienen als schwache sekundäre Unterstützung oder Widerstand . (3) Wenn die Hauptlinie

Sind Sie mit der Größe des Hauptcharts bei der Verwendung von Oszillatoren unzufrieden? Sie können MACD-, RSI-, Stochastik-, ATR- und Momentum-Indikatoren über Main Chart Oscillators hinzufügen . Vertikale Größe : Vertikale Größe des Indikatorfensters Zeichnungsmodus : Fügen Sie Oszillatoren im selben Abschnitt hinzu oder erstellen Sie einen neuen Abschnitt für einen beliebigen Oszillator Draw Top Line : Zeichnet eine Linie am oberen Rand des Indikatorabschnitts, um ihn zu trennen. Top Line Styl
Any Moving Average zeichnet einen gleitenden Durchschnitt eines *beliebigen Indikators in einem Unterfenster. Viele Indikatoren, die in MT4 enthalten sind, werden standardmäßig unterstützt. Sie können auch eigene Indikatoren hinzufügen. Einstellungen Name Beschreibung Zeitrahmen Zeitrahmen für die Berechnung auswählen Quelle Indikator Indikator auswählen Name des benutzerdefinierten Indikators Geben Sie den Namen des benutzerdefinierten Indikators ein (wenn der Quellindikator auf Benutzerdefinie
Hallo Trader, Ein sehr einfaches, aber nützliches Tool für automatische Trader. Ein Indikator, mit dem Sie die Geschwindigkeit des Strategietesters auf sehr einfache Weise anpassen können. Ziehen Sie den Indikator einfach in den Chart, bevor Sie den Strategietester starten, und stellen Sie die Geschwindigkeit manuell ein, und das ist alles! Die Schaltflächen können an jeder beliebigen Stelle des Charts platziert werden, geben Sie einfach die x- und y-Koordinaten ein -----------------------------
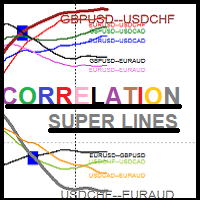
SUPER Korrelationslinien für Symbole Multi Timeframes Multi Currencies Indikator Jede Linie zeigt die Korrelation von 2 Symbolen an, basierend auf den Berechnungen der Symbolstärke bei Multi Timeframes
5 Symbole -> 10 Korrelationsindikatorlinien Strategie:1 basiert auf der Auswahl der NEUEN schwächeren/stärkeren Korrelationslinie: *****Neue schwächere Linie, die die alte schwächere Linie nach unten kreuzt: SYMBOL1 VERKAUFEN && SYMBOL2 KAUFEN *****Neue stärkere Linie, die die alte schwächere Lin

Der Perfect Entry Spotter Indikator mit Alarm basiert auf einer Kombination von Support-Resistance-, Fractal-, Alligator- und Moving-Average-Indikatoren, die auf einer intensiven Forschung basieren. Der Indikator verfügt über einen Alarm mit der Option, ihn zu aktivieren/deaktivieren. Sie können auf dieser Grundlage mit hoher Genauigkeit handeln. Empfohlene Handelsregeln: 1. Kaufen - Warten Sie auf das Erscheinen des Kalk-Pfeils und handeln Sie in Richtung des Trends (Trend nach oben). 2. Verkau
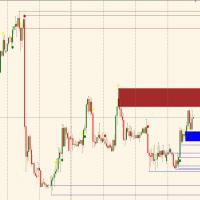
Es verfolgt automatisch die Angebots- und Nachfragezonen und zeigt den aktuellen Trend an. Sobald Sie den Trend auf dem Hauptzeitrahmen identifiziert haben, warten Sie einfach, bis der Preis auf dem operativen Zeitrahmen in der nahen Zukunft einer Nachfrage- (Kauf) oder Angebotszone (Verkauf) ankommt und führen Sie den Handel aus. Es wird empfohlen, darauf zu warten, dass der Trend auf dem höheren Zeitrahmen und der operative Zeitrahmen übereinstimmen, und ausschließlich in den Bereichen zu hand
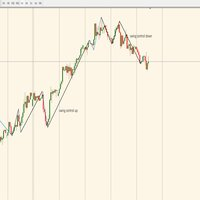
Der Indikator übersetzt automatisch Kontrollschwünge (trendbestimmter Markt) und Korrekturschwünge (rückläufiger Markt); Es handelt sich um einen einfachen Indikator, der mit Ihren Strategien kombiniert werden kann, um diese zu verbessern und nur dann in den Markt einzusteigen, wenn der Trend unter Kontrolle ist; Überprüfen Sie auf dem größten Zeitrahmen, wie sich der Markt bewegt (Swing schwarze Farbe Kontrolle oder Swing blaue Farbe Korrektur) von hier aus, gehen Sie von Zeitrahmen, um seinen

Wir handeln Live Trend Max 500-1000 Pips Unser Team von Ingenieuren hat ein großartiges Tool programmiert, das wir mit Erfolg eingesetzt haben und das Ihnen dabei helfen wird, bessere Entscheidungen zu treffen, wenn Sie einen Handel platzieren. Es ist besser als alles, was derzeit auf dem Markt erhältlich ist! Testen Sie es gegen andere Produkte und sehen Sie selbst, wie erstaunlich es ist. Unser Hauptziel ist es, Ihnen als Händler dabei zu helfen, zu entdecken, wie Sie ein einfaches Handels-Set

Wir handeln Live-Trend-Levels Dieser Indikator ist eine fantastische Ergänzung zum We Trade Live Trend Max. Er hilft dabei, Störgeräusche herauszufiltern und einen besseren Einstieg in einen Handel zu finden. Dieser Zusatz ist ein absolutes Muss und wir verwenden ihn ständig zusammen mit dem We Trade Live Trend Max, Dieser Indikator berechnet die Volumenstärke und zeigt Unterstützungs- und Widerstandsniveaus für einen Handel an, misst das Momentum in einem Markt , was den Kauf oder Verkauf auf d

Dieser Indikator identifiziert die Hoch- und Tiefpunkte der Haupt- und Nebenschwünge auf einem Diagramm. Anschließend zeichnet er anhand des letzten Schwungs ein Fibonacci-Muster mit Rücksetzungs- und Verlängerungsniveaus, um Ihnen eine Vorstellung davon zu geben, wohin sich der Preis als nächstes bewegen könnte. Sie können ein Paar gleitende Durchschnitte festlegen, um die Richtung des Gesamttrends zu bestimmen. Es gibt Konfigurationsparameter für den Haupt- und Nebenschwung sowie für die gleit
Indikator für binäre Optionen das Signal erscheint zusammen mit der Eröffnung einer neuen Kerze und signalisiert das völlige Fehlen von Redrawing-Empfehlungen Kaufsignal blauer Pfeil nach oben Verkaufssignal roter Pfeil nach unten Ablaufzeit und empfohlen 1 Kerze des verwendeten Zeitrahmens wenn sich der Handel als unrentabel erweist, können Sie den Betrag erhöhen und den Handel beim nächsten Signal wieder eröffnen das Instrument ist einfach einzurichten, nur zwei Perioden Optimale Einstellungen

LineareRegressionZerlegung ( LRD ) Die lineare Regressionszerlegung wurde mit einer sehr komplexen Methode berechnet.
Grundsätzlich wird versucht, die Kursbewegungen der Instrumente auf der Metatrader-Plattform linear zu zerlegen.
Der Indikator wird in der Grafik mit zwei separaten Linien dargestellt.
Die rote Linie ist unser Hauptindikator und behandelt die Preisdivergenz.
Die blaue Linie filtert das rote Signal.
Damit ein Kaufsignal entsteht, muss zum Beispiel die rote Linie die Nulllinie nach

Nach dem Kauf, kontaktieren Sie bitte
t.me/hakimsann
Diese Indikatoren sind gemischt auf alle logischen Wert wie
Trend
Unterstützung und Widerstand
Kerzenmuster
Price Action
wir kombinieren
2 Bollinger Band
6 Zigzag Perioden
4 Relative Strength Index Periode
1 MACD Trend
Unterstützung und Widerstand
Preisaktion
Kerzenmuster
Vermeidung von Doji auf dem Markt Kann auf jedem Markt angewandt werden
24-7
Maksimum Martingale lv 5.
Erster Einsatz 0,4% Balance

Murrey Math Multi Timeframe Indikator Unterstützung/Widerstand
Murrey Math Lines sind starke Werkzeuge zur Darstellung von Unterstützungs- und Widerstandsniveaus.
Murrey Math Multi Timeframe Indicator zeichnet Multi Timeframe MM Linien auf einem kleineren tf Chart.
Allgemeine Informationen: Nach Gann bewegen sich die Preise in 1/8-Schritten, diese 1/8-Schritte dienen als Unterstützungs- und Widerstandspunkte Widerstand, wenn sich der Preis eines Unternehmens im Laufe der Zeit verändert. Ange

We Trade Live Trend Entry & Exit ist eine weitere fantastische Ergänzung der We Trade Live Trend Indikatorensammlung Dieser Indikator arbeitet fantastisch mit unseren anderen Indikatoren zusammen. Dieser Indikator wird in erster Linie verwendet, um einen Handel einzugehen und einen Handel zu beenden, und um Sie zu warnen, wenn Sie möglicherweise eine kurze oder lange auf einem aktuellen Trend zu nehmen, bietet es Warnungen auf, wenn es eine Änderung in der Richtung auf den Trend, den Sie handeln

Der Indikator "Geschwindigkeit der Preisänderung " ( VP ) zeigt die durchschnittliche Preisänderungsrate in den charakteristischen Zeitintervallen an, in denen diese Rate annähernd konstant war. Der robuste Algorithmus, der in VP verwendet wird, um den Preis von seinen zufälligen Sprüngen zu befreien, gewährleistet die Zuverlässigkeit des Indikatorwerts, der nicht auf die einfache Preisvolatilität und ihre unbedeutenden Bewegungen reagiert. Der Indikator ermöglicht es Ihnen, Trends und die Momen

Koala Trend Line Einführung: Ich habe diesen Indikator erstellt, damit Händler den Trend besser finden können. Dieser Indikator kann Ihnen die aktuelle Trendlinie anzeigen. Wie Sie wissen, muss die Trendlinie zwischen den beiden höchsten oder niedrigsten Punkten verlaufen. Die grundlegende Logik besteht also darin, die höchsten und niedrigsten Punkte zu finden. Der Indikator findet alle höchsten und niedrigsten Punkte in der Geschichte und zeigt sie mit roten und blauen Punkten an. Diese höchst

Der ATR Levels Indicator For MT4 ist ein Indikator, der speziell für Trader entwickelt wurde, die den Meta Trader 4 für ihre Handelsanalysen, die Erstellung von Charts verschiedener Währungspaare und Handelsaktiva, die technische Analyse und das Treffen von Handelsentscheidungen während des gesamten Handelstages nutzen.
Einer der ersten großen Vorteile des ATR Levels Indicator For MT4 ist, dass er dem Trader automatisch hilft, sehr wichtige Niveaus auf den Märkten zu erkennen, die auf dem Avera
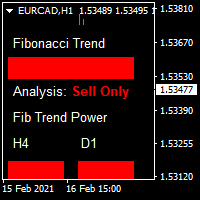
Unser Kauf- und Verkaufsindikator bietet präzise Einstiegspunkte, die Ihnen den richtigen Zeitpunkt für Käufe und Verkäufe vorgeben und gleichzeitig die Trendrichtung angeben. Dieses Tool minimiert Drawdowns und erhöht Ihren Gewinnanteil, indem es sich am Trend ausrichtet. Kaufsignale werden durch blaue Kästchen neben den Kerzen dargestellt und signalisieren optimale Einstiegspunkte. Umgekehrt zeigen rote Kästchen Verkaufssignale an. Der sekundäre Indikator, der Fibonacci-Trend, verbessert die
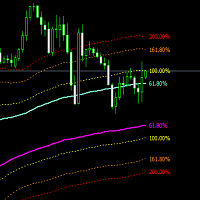
DYNAMIC CHANNEL Forex ist ein Metatrader 4 (MT4 (MT4)) Indikator und das Wesen dieses technischen Indikators ist es, die akkumulierten historischen Daten zu transformieren. Forex DYNAMIC CHANNELIndikator bietet die Möglichkeit, verschiedene Besonderheiten und Trends in der Preisdynamik zu erkennen, die mit dem bloßen Auge nicht sichtbar sind. Auf der Grundlage dieser Informationen können Händler weitere Preisbewegungen vermuten und ihre Strategie entsprechend anpassen.
Dynamischer Kanal, der a

Was ist ein Währungsstärkeindikator ?
Ein Währungsstärkeindikator ist ein grafisches Instrument, das die Stärke einer Währung anzeigt. Gängige Indikatoren zeigen in der Regel die Stärke einer Währung im Verhältnis zu einer anderen Währung an, mit einigen Berechnungen ist es jedoch möglich, die absolute Stärke jeder einzelnen Währung zu ermitteln.
Daher ist ein Währungsstärkematrix-Indikator (oder -Zähler) ein Instrument, das versucht, die absolute Stärke einer Währung auszudrücken, so dass Sie

Das Handelssystem ist für die Arbeit mit Gold in bestimmten Zeiträumen konzipiert: 30M, 1H. Der Indikator erlaubt es Ihnen, sich an die Marktsituation anzupassen.
Parameter für 1H : PERIOD=9F , FILTER=300 .
Parameter für 30M : PERIOD=22B , FILTER=450 .
Eine kleine Anpassung an einen bestimmten Broker ist möglich .
Wenn Sie den Umfang der angezeigten Historie ändern, müssen Sie möglicherweise auch die Parameter anpassen.
Der Indikator wird nicht neu gezeichnet .
"Gold n XAU" verwendet verschi
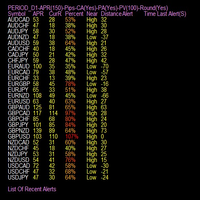
Der Indikator ist in der Lage, das Erreichen der durchschnittlichen Preisspanne der letzten Perioden durch Pop- und akustischen Alarm anzuzeigen, so dass wir unseren Betrieb einstellen können. Er ermöglicht verschiedene prozentuale Variablen erreicht und Perioden der Variation nach den eingegebenen Parametern. Wenden Sie Ihre Umkehrstrategien an, um diese Schwelle zu erreichen, damit Sie höhere Erfolgsquoten erzielen. Unverzichtbar für die Reverse-Intraday-Strategien.

Die Cauchy-Verteilung ist ein klassisches Beispiel für eine Fettschwanzverteilung. Dicke Schwänze weisen darauf hin, dass die Wahrscheinlichkeit, dass eine Zufallsvariable vom zentralen Trend abweicht, sehr hoch ist. Für eine Normalverteilung ist die Abweichung einer Zufallsvariablen von ihrer mathematischen Erwartung um 3 oder mehr Standardabweichungen äußerst selten (die 3-Sigma-Regel), und für die Cauchy-Verteilung können Abweichungen vom Zentrum beliebig groß sein. Diese Eigenschaft kann ve

!!!!AKTUALISIERTE VERSION!!!!
Multi Currency Strength Indicator ist der ultimative, einfache Multi-Währungs-Stärke-Indikator, der aus Signalgebern und automatisierten, beschrifteten Levels besteht und sowohl Anfängern als auch erfahrenen Händlern dabei hilft, ihre Strategien zu verbessern. Der Autor hat das Programm mit dem Ziel kodiert, einen einfachen und dennoch effektiven Indikator zu entwickeln, der für alle, die ihn benutzen, benutzerfreundlich ist. Probieren Sie es aus, es ist einen Vers

Dieser Indikator XX Power indicator.indicator zeigt Trend Bewegung. Indikator hilft zu kaufen und zu verkaufen. Indikator zeigt Pfeil und Linie. Eigenschaften
FiltPer - zeigt den Zeitraum des Indikators an.
Wie der Status zu verstehen ist: Wenn die Trendfarbe grün ist, ist der Trend steigend. Wenn die Trendfarbe rot ist, ist der Trend rückläufig.
//////////////////////////////////////////////////////////////////////////////////////////////////////////////////////////////////////////////////
Start Signal ist eines der zuverlässigsten Tools für den Handel auf den Finanzmärkten Mit Hilfe von Start Signal können Sie sowohl mit börslichen Optionen als auch mit anderen Märkten wie Forex handeln. Ursprünglich wurde Start Signal für Binäre Optionen entwickelt. Aber während des Handels wurde entschieden, dass es auch gut für Scalping geeignet ist Außerdem bietet es eine gute Genauigkeit Perfekt für Anfänger und erfahrene Trader Die Signale sind extrem einfach und überschaubar Sie brauchen n

der Indikator ist für den Handel in den Finanzmärkten für Scalping, Pipsing das Tool verwendet Unterstützung und Wartung Ebenen in seinem Algorithmus eigene Strategie und einzigartige Entwicklung Signale Pfeil nach oben kaufen Pfeil nach unten Verkauf empfohlen für den Einsatz auf Zeitrahmen bis zu 15 m können Sie den Handel von Signal zu Signal achten Sie auf die Transaktion nicht mehr als 2% der Kaution.
Ein gutes und zuverlässiges Werkzeug, wenn Sie die Regeln des Geldmanagements folgen Entwickelt nach seiner eigenen Strategie auf einem einzigartigen Algorithmus Der Indikator ist komplett für binäre Optionen geschärft Binary Luck ist sehr einfach zu bedienen, nichts muss konfiguriert werden Fügen Sie einfach in das Diagramm und Sie können den Handel beginnen Perfekt für Anfänger und erfahrene Händler Signale sind einfach und unkompliziert Pfeil nach oben kaufen Pfeil nach unten Verkauf Empfohle
Der We Trade Live Trend Candle Stick kann dabei helfen, potenzielle Markttrends beim Handel zu identifizieren , Markttrends zu erkennen und zukünftige Preise vorherzusagen. Der We Trade Live Trend Candle Stick hat ein glatteres Aussehen, da er im Wesentlichen einen Durchschnitt der Bewegung bildet . Wir glauben, dass es nützlich ist, um Candlestick-Diagramme besser lesbar zu machen und Trends leichter zu analysieren. Als Breakout-Trader sind Sie auf der Suche nach Trades, die aus einem wichtige
Als Händler suchen Sie nach dem perfekten Zeitpunkt für den Einstieg in den Handel. Dieser Indikator nutzt jede Kursbewegung und zeigt an, wenn ein bestimmtes Niveau erreicht wurde und ein möglicher Ausbruch bevorsteht. DIESER INDIKATOR WIRD AM BESTEN AUF DEM 1-TAGES-CHART MIT WE TREND LIVE MAX VERWENDET. Die Funktion "Check LTF" (Check Long time frame) wurde dem 5-Minuten-, 15-Minuten-, 30-Minuten-, 1-Stunden- und 4-Stunden-Chart hinzugefügt, die den Trend in allen Zeitrahmen überprüft, insbeso

Definition: VPO ist eine Volumen-Preis-Chance. Anstatt Balken oder Kerzen mit einem Eröffnungs-, Höchst-, Tiefst- und Schlusskurs zu verwenden, wird jeder "Balken" in einem Marktprofil durch horizontale Balken gegenüber dem Preis dargestellt.
Mit anderen Worten: Volumen-Preis-Chance-Profile (VPO) sind Histogramme, die zeigen, wie viele Volumina zu jedem Preis innerhalb der Profilspanne gehandelt wurden.
Mit einem VPO-Chart können Sie die Handelsaktivität auf der Grundlage des Volumens für jedes

Backtests können nicht die volle Leistung des Indikators abrufen
Der Handel an den Währungsmärkten ist ein komplexes Geschäft. Bei so vielen Paaren und mehreren Zeitrahmen ist es fast unmöglich, sie alle zu überwachen - aber mit der Currency Heatmap können Sie das. Der Currency Heatmap-Indikator liefert Ihnen die Informationen, die Sie benötigen, um Ihre Handelsentscheidungen auf das gesamte Spektrum der Währungspaare zu stützen, die von den 8 wichtigsten Währungen abgeleitet sind, nämlich dem

Fibonacci Magic Pivot Levels Der Fibonacci Magic Pivot Levels ist ein leistungsstarker und dennoch einfach zu bedienender Indikator . Er überwacht kontinuierlich die Intraday-Kursentwicklung und verwendet komplexe Algorithmen, um wichtige Unterstützungs-, Widerstands- und Pivot-Levels zu berechnen und zu erkennen, wobei der D1-Zeitrahmen als Filter verwendet wird. Der Fibonacci Magic Pivot Levels ist für die Zeitrahmen H4, H1, M30, M15, M5 und M1 optimiert und kann für ALLE Währungen, Indizes,

Dieser Indikator ist ein unverzichtbares Werkzeug, das das aktive Diagramm nach Candlestick-Mustern absucht. Er kennzeichnet jeden Balken entsprechend der gefundenen Candlestick-Muster, so dass Sie die Preisentwicklung leichter analysieren und Ihre Handelsentscheidungen besser treffen können. Es gibt 103 übliche und ungewöhnliche mögliche Muster sowie 6 neue Muster, die der Indikator auf der Grundlage von Forschungsergebnissen identifizieren kann. Wenn ein Candlestick die Anforderungen für mehre
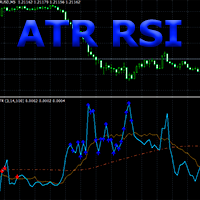
Zusammensetzung der Indikatoren ATR und RSI.
Der ATR-RSI-Indikator vergleicht zwei Berechnungen des ATR-Indikators mit den Fast- und Slow-Perioden auf einem Chart, sowie der Durchschnittslinie und den überkauften und überverkauften Zonen des RSI-Indikators.
ATR zeigt die Werte der Volatilitätsänderung des Währungspaares in Punkten an, wobei der als Parameter angegebene Zeitraum berücksichtigt wird. Die Einstiegspunkte, die der RSI-Indikator liefert, zeigen ein sehr gutes Risiko-Ertrags-Verhältn

Folgen Sie einem Schritt-für-Schritt-System, das die stärksten Ausbrüche erkennt!
Entdecken Sie Marktmuster, die auf der Grundlage einer bewährten und getesteten Strategie massive Gewinne generieren.
Vorteile, die Sie mit dem Indikator erhalten: Einzigartiger preisaktionsbasierter Algorithmus. Leistungsstarke Kombination mit jeder Handelsstrategie. Automatische Erkennung von Einstiegs-, Ausstiegs-, Stop-Loss- und Take-Profit-Levels. Automatische Berechnung der Signalstatistiken. Niemals Repa

XMaster Scalping NEW - ein einfacher Indikator, der den Beginn und das Ende eines Trends bestimmt. Es kann sehr gut gesagt werden, auch ideal für beide Scalping und mittel / langfristigen Handel. Wenn er auf einem Chart eingezeichnet wird, befindet er sich im Keller, was Ihnen die Möglichkeit gibt, Trendlinien / Levels auf den Preis zu zeichnen und in den Keller auf den Indikator zu schauen.
Wie zu verwenden: Es ist ganz einfach. Verkaufen Sie gelb, kaufen Sie grün. Die Farben können in den

Der Indikator hilft dem Händler bei der Identifizierung potenzieller Liquiditätsniveaus. Der in diesem Indikator verwendete Algorithmus prüft das Verhalten des Vermögenswerts unter Berücksichtigung der Preisniveaus, des Momentums und der Volumenanalyse.
Merkmale:- Parameter für Signaloptimierung und Warnungen.
Verwendung:- Die vom Indikator gebildeten Niveaus können Händlern bei der Identifizierung potenzieller Einstiege, Ausbrüche oder Umkehrungen behilflich sein. Er kann Händlern mit technis

Definition : TPO ist eine Time Price Opportunity. Anstelle von Balken oder Kerzen mit einem Eröffnungs-, Höchst-, Tiefst- und Schlusskurs wird jeder "Balken" in einem Marktprofil durch horizontale Balken gegen den Preis dargestellt.
Mit anderen Worten: Zeit-Preis-Chance-Profile (TPO) sind Histogramme, die zeigen, wie viel Zeit bei jedem Preis innerhalb der Profilspanne verbracht wurde.
Mit Hilfe eines TPO-Charts können Sie den Umfang der Handelsaktivität auf der Grundlage der Zeit für jedes Pre

Dieser indikator zeigt eine kerze kombination basierend auf dodge, dodge und pin bar. Die Logik des Musters besteht darin, nach der Unsicherheit auf der Seite der Macht zu sein. Der Indikator ist universell und nützlich für den Handel mit binären Optionen(zusätzliches Material wird auch zur Verfügung gestellt), Forex, ETF, Kryptowährung und vieles mehr. Der Indikator unterstützt Zeitrahmen von M15 bis MN inklusive.
In der Anzeige gibt es das Senden von Benachrichtigungen und Unterstützung für Pu
Indikator für binäre Optionen Binary Dream Trader Verfallszeit und 1 Kerze Zeitrahmen von m1 bis m15 Kein Redrawing Jedes Money Management kann verwendet werden Wenn es sich um ein Martingale handelt, erhöht sich die Profitabilität Es wird nicht empfohlen, Martingale auf einem kleinen Konto zu verwenden Signale Blauer Pfeil nach oben Kaufsignal Roter Pfeil nach unten Verkaufssignal Es wird empfohlen, den Handel während starker Nachrichtenveröffentlichungen zu vermeiden.

Alle Candlesticks Library ist ein Indikator, der ein intelligentes Mustererkennungssystem mit einer WIRKLICH BREITEN BEREICHE an Candlestick-Variationen bietet! Es gibt über 100 Kerzenmuster, von gängigen Doji- und Konsolidierungsvarianten über eine Reihe bekannter Momentum- und Breakout-Kerzen bis hin zu seltenen Mustern, die wir nicht jeden Tag sehen.
PLUS, es kommt mit (NICHT 100% GENAU, aber fair genug) Statistiken! Sie können wählen, ob Sie es sehen möchten, die Kerzenhalter, beide oder k
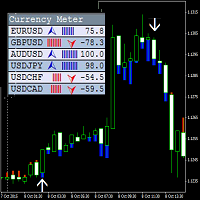
Dieser Indikator zeichnet Pfeile auf das Diagramm, die Signale für den Ein- und Ausstieg aus dem Geschäft darstellen, und als Filter färbt der Indikator jede Kerze in blau und rot. Darüber hinaus zeigt das obere linke Fenster die Stärke des Trends und seine Richtung bei den wichtigsten Paaren an. Der Indikator verfügt über eine neue Logik, die ihn deutlich von vielen Analoga unterscheidet. Er gibt frühzeitige Signale für den Ein- und Ausstieg, seine Werte werden nicht neu gezeichnet - d.h. wenn
Der perfekte Angebots- und Nachfrageindikator für die MetaTrader 4 Plattform! Er kommt mit den folgenden Funktionen...
Supply & Demand Zones
Der Indikator zeigt Supply & Demand Zones auf Ihren bevorzugten Profilen an. Er funktioniert auf allen Zeitrahmen und in allen Märkten. Fresh & Used Zones
Der Indikator markiert jede Zone farblich, damit Sie wissen, ob sie frisch ist oder nicht.
Wenn die Zone nicht mehr frisch ist, ändert sie ihre Farbe und zeigt an, dass der Preis bereits einmal oder me
Als "flat" bezeichnet man eine Position , die ein Händler im Devisenhandel einnimmt , wenn er sich über die Richtung der am Markt gehandelten Währungen nicht sicher ist. Wenn Sie keine Positionen im US-Dollar hätten oder Ihre Long- und Short-Positionen sich gegenseitig aufheben würden, wären Sie flat oder hätten ein flat book
Ein flacher Markt ist ein Markt, auf dem es kaum Kursbewegungen gibt; der Markt bewegt sich in der Regel innerhalb einer engen Spanne, anstatt einen klaren Auf- oder Abwä
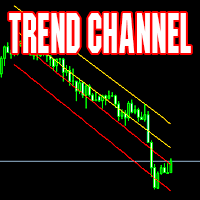
Kanal-Indikator. Wird dynamisch berechnet. Geeignet sowohl für die Arbeit in Richtung des Trends als auch innerhalb des Kanals. Hervorragende Ergebnisse bei der Arbeit auf Zeitrahmen von 4H bis zur Mitte des Kanals.
Anwendungsbeispiel: Wenn der Preis eine der extremen Linien berührt - Eröffnung eines Geschäfts in der Mitte des Kanals mit einem Take Profit auf der nächstgelegenen Mittellinie des Indikators. MT5-Version Der Indikator kann in Expert Advisors (4 Puffer) verwendet werden und empfän
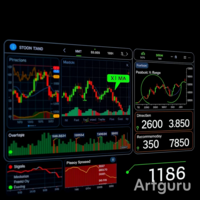
Das Multi-Informations-Panel wurde entwickelt, um den Ein- und Ausstieg in den Handel noch präziser zu gestalten und einen sofortigen Überblick über die Entwicklung eines Währungspaares zu geben. Das Multi-Informations-Panel funktioniert für jede Währung und jeden Zeitrahmen (oder sollte es zumindest) und zeigt in der unteren rechten Ecke des Charts Folgendes an.
Ein Diagramm der Stochastik-Oszillatoren für die Zeitrahmen M1 bis D1. Ein Hinweis auf den Markttrend anhand der EMAs in den Zeitrah

Volumen, Momentum und Marktstärke sind wichtige Anzeichen dafür, dass sich der Preis in eine bestimmte Richtung bewegen wird. Der Volumen-Lösungs-Indikator ist ein Indikator, der Händlern dabei helfen kann, ein Momentum-Handels-Setup objektiv als ein solches mit oder ohne Volumen und Stärke zu klassifizieren. Was ist der Volumen-Lösungs-Indikator ? Der Handelsvolumen-Indikator ist ein benutzerdefinierter technischer Indikator, der ähnlich wie ein Marktstimmungsindikator funktioniert. Er zeigt di

Ein universelles Tool zur Identifizierung von Trends, Flats und dem Handel mit Chartmustern. Kombiniert die Techniken von Ghana, Elliot, Murray.
Platzieren Sie es einfach auf dem Chart und es zeigt die Richtung und Geschwindigkeit der Preisbewegung an und hebt die Wendepunkte hervor.
Malteserkreuz hilft Ihnen, die Schlüsselmomente in der Geschichte zu lokalisieren, Handelsaktionen zu planen und offene Geschäfte zu begleiten. Grundprinzipien Malteserkreuz zeigt Trend-, Flat- und Impulslinien vor

GoldTrend MT4 - ist ein führender Indikator für Gold auf MetaTrader 4
- In der Update-Version wurde eine neue Fähigkeit auf USD-Paare
( AUDUSD, EURUSD, GBPUSD, NZDUSD, USDCAD, USDCHF, USDJPY )
- sehr einfach zu bedienen , auch für Anfänger
- Stoploss und Take Profit vorgesehen - kein Repaint, kein Redraw und kein Lagging
Wenn Sie sich entscheiden, in den globalen Markt einzusteigen , dann gibt es eine technische Fähigkeit, die Sie unbedingt haben müssen, - Es geht dabei um Trends .
Warum -

Der Indikator " Action Alert" erzeugt und schreibt Daten in das Diagramm, wenn eine Änderung am toten Prozess vorgenommen wird. Expertise Eigenschaften: Es wird ein akustisches Warnsignal mit dem Namen des Vorgangs und der durchgeführten Arbeit ausgegeben Sie benötigen nur ein Diagramm Schreibt die bearbeiteten Vorgänge in deutlicher Handschrift Die Schriftfarbe kann auf dem Diagramm gesteuert werden Einstellung Aktion Alarmanzeige
Was damit gemeint ist, ist mich jede Änderung in meinen Geschä

Mit dem Kauf der Auto-Harmonic Pattern Recognition Trading Software für MT4 , haben Sie Zugang zu: Die Auto-Harmonic-Pattern-Erkennungssoftware wurde entwickelt, um dem Trader die schwere Arbeit der Harmonic-Trading-Strategie abzunehmen. Die Software identifiziert und projiziert automatisch Harmonic Pattern Completion Zones für die 6 am besten handelbaren Harmonic Patterns. Wenn das Pattern in der projizierten Zone abgeschlossen wird, besteht eine hohe Wahrscheinlichkeit, dass der resultierende
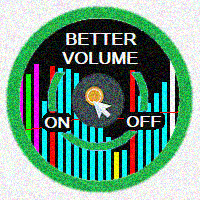
Der Better Volume Indikator verbessert das Verständnis der Lautstärke durch Einfärbung der klassischen Histogrammbalken . Die Farben weisen auf die unterschiedliche Natur des Volumens hin. Weiterhin ist es möglich, über zwei Schaltflächen und ohne den Hauptchart zu verändern , die Zeitrahmen zu wechseln und zwischen drei Symbolen zu navigieren . Die Alarme funktionieren dann entsprechend. Für jedes Symbol können die LookBack- und Ma-Perioden gewählt werden. Die Möglichkeit, den Indikator ein- u
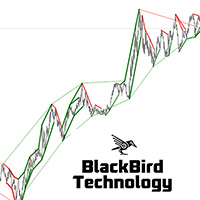
Multi Level Trend Direction ist ein Indikator, der die genauesten Kauf-/Verkaufspunkte mit der höchsten Wahrscheinlichkeit identifiziert, basierend auf mehrstufigen Zig Zag Swings. Der Indikator zeichnet ein farbiges Zig Zag an den höheren Hochs, höheren Tiefs, niedrigeren Tiefs und höheren Tiefs im Chart, aber basierend auf einem zweistufigen Zig Zag Swing. Wenn der schnelle Kursschwung mit dem Trend des langsamen Kursschwungs übereinstimmt, dann sind die Kauf-/Verkaufstrendlinien größer. Wenn

Dies ist ein Volumenprofil, bei dem Sie den gewünschten Zeitraum individuell festlegen können. Sie können dies mit einer Zeile tun oder automatische Funktionen wie die Anzeige des Volumens des letzten Zeitraums wählen. Der Indikator zeigt auch den maximalen Volumenwert (VPOC - VOLUME POINT OF CONTROL) und den Durchschnittswert, Farben und Einstellungen können Sie anpassen, wie Sie möchten, gibt es viele Möglichkeiten. Wenn Sie einen Indikator benötigen, der die konstanten Volumen-Zeitrahmen anze
Der MetaTrader Market ist die beste Plattform für den Verkauf von Handelsroboter und technischen Indikatoren.
Sie brauchen nur ein gefragtes Programm für die MetaTrader Plattform schreiben und schön gestalten sowie eine Beschreibung hinzufügen. Wir helfen Ihnen, das Produkt im Market Service zu veröffentlichen, wo Millionen von MetaTrader Benutzern es kaufen können. Konzentrieren Sie sich auf dem Wesentlichen - schreiben Sie Programme für Autotrading.
Sie verpassen Handelsmöglichkeiten:
- Freie Handelsapplikationen
- Über 8.000 Signale zum Kopieren
- Wirtschaftsnachrichten für die Lage an den Finanzmärkte
Registrierung
Einloggen
Wenn Sie kein Benutzerkonto haben, registrieren Sie sich
Erlauben Sie die Verwendung von Cookies, um sich auf der Website MQL5.com anzumelden.
Bitte aktivieren Sie die notwendige Einstellung in Ihrem Browser, da Sie sich sonst nicht einloggen können.