Technische Indikatoren für den MetaTrader 4 - 18

Stop Out & Margin Call Levels – Dein Assistent für Risikomanagement Behalte die volle Kontrolle über dein Handelsrisiko mit diesem Indikator, der dynamisch wichtige Niveaus im Chart anzeigt: Stop Out, Margin Call, Freie Margin und ein benutzerdefiniertes Level. Ideal für Trader mit hoher Hebelwirkung oder All-in-Strategien, bei denen jeder Pip zählt und kaum Spielraum für Fehler bleibt. Vollständig anpassbar – Farbe, Stil, Dicke und Sichtbarkeit jeder Linie einzeln einstellbar. Flexible Konfigur
Der FVG-Zonenindikator ist ein leistungsstarkes Tool zur Erkennung von Fair Value Gaps (FVG) auf dem Markt und hebt Preisungleichgewichte zwischen fairem Wert und Marktpreis hervor. Diese präzise Identifizierung von Lücken ermöglicht es Händlern, potenzielle Markteinstiegs- und -ausstiegspunkte zu erkennen, was ihre Fähigkeit, fundierte Handelsentscheidungen zu treffen, erheblich verbessert. Mit seiner intuitiven und benutzerfreundlichen Oberfläche durchsucht der FVG Zone Indicator Charts au
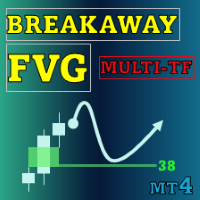
Special offer : ALL TOOLS , just $35 each! New tools will be $30 for the first week or the first 3 purchases ! Trading Tools Channel on MQL5 : Join my MQL5 channel to update the latest news from me Das Tool Breakaway Fair Value Gaps (FVG) ist eine fortschrittliche Lösung, die speziell für Trader entwickelt wurde, um Bereiche zu identifizieren, in denen der Preis das Gleichgewicht verlassen hat. Es bietet detaillierte Einblicke in die Wahrscheinlichkeit einer Korrektur. Dieses Tool

Der Boom and Crash Spike Detector Indikator ist basierend auf einer fortschrittlichen Strategie kodiert, hauptsächlich um den Boom und Crash in den Preisen zu erkennen. Komplexe Algorithmen wurden implantiert, um Booms und Crashs mit hoher Wahrscheinlichkeit in den Preisen zu erkennen. Es warnt vor möglichen Boom- oder Crash-Phasen:
Boom-Phase: Wenn der Preis zu schnell steigt. Crash-Phase: Wenn der Preis zu schnell sinkt.
ZEITLICH BEGRENZTES ANGEBOT: Der Indikator ist für nur 30$ und lebensla

Der Indikator erstellt einen Renko-Chart im Unterfenster für das aktuelle Symbol. Die Balken werden aus Live-Daten gebildet und die gewünschte Balkengröße kann auf der Registerkarte "Eingaben" eingestellt werden. Das Wichtigste: Da der Renko-Chart nur den Preis zur Erstellung der Balken verwendet und die Zeit ignoriert, kann der Indikator auf jeden beliebigen Zeitrahmen angewendet werden, und es können dieselben Ergebnisse erzielt werden. Empfohlene Verwendung
Da Renko-Charts dafür bekannt sind,
FREE

Volume Delta ist ein sehr leistungsfähiger Indikator, der das Angebot auf dem Markt anzeigt. Er berechnet das Delta aus der Bewegung des Preises und der Differenz der KAUF- und VERKAUFS-Tickvolumina. Seine besondere Struktur ermöglicht es Ihnen, alle auf der MT4-Plattform verfügbaren Zeitrahmenwerte zu erhalten. Eine gute Beobachtung dieses Instruments kann großartige Einstiegspunkte und mögliche Umkehrungen vorschlagen. Wir sind zuversichtlich, dass dieses Tool Ihnen helfen wird, Ihr Trading-Ti

Der Indikator analysiert die Preisstruktur von Fraktalen und identifiziert mögliche Umkehrpunkte der Marktdynamik. Perfekt in Kombination mit anderen Arten von Indikatoren.
Vorteile:
Funktioniert auf allen Instrumenten und Zeitreihen, Zeichnet seine Ergebnisse nicht neu, Anpassbare Farben der Indikatorelemente, Funktioniert gut mit jeder Trendstrategie, Anpassen der Stärke von Fraktalen.
MT5 version -> HERE / Our news -> HERE
Strategy: AW Flexible Fractals is an indicator that indicates si
FREE

Lot Size Calculator – Positionsgrößen-Rechner Dieser Indikator berechnet die Lotgröße basierend auf dem ausgewählten Risikoprozent und der Distanz des Stop-Loss. Er ist für den Handel mit Forex, Metallen, Indizes, Rohstoffen und Kryptowährungen konzipiert.
Hauptfunktionen Berechnung der Positionsgröße auf Basis des Kontostands / verfügbaren Eigenkapitals und des gewählten Risiko-Prozentsatzes Unterstützung von Markt- und Pending Orders Visuelle Handelslinien: Einstieg, Stop-Loss und Take-Profit
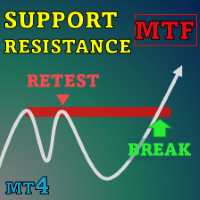
Special offer : ALL TOOLS , just $35 each! New tools will be $30 for the first week or the first 3 purchases ! Trading Tools Channel on MQL5 : Join my MQL5 channel to update the latest news from me In der sich ständig verändernden Landschaft des Finanzhandels ist die genaue Identifizierung und Analyse von Unterstützungs- und Widerstandsniveaus entscheidend für fundierte Investitionsentscheidungen. SnR Retest and Break Multi-Timeframe ist ein Unterstützungs- und Widerstandsindikator
XAU Scalper MT4 MT5-Version Ein Analysewerkzeug zur Beobachtung kurzfristiger Preisbewegungen bei Gold-Paaren. Der XAU Scalper Indikator liefert Kauf- und Verkaufssignale , die auf der Stabilität der Kerze, dem RSI und der kurzfristigen Dynamik basieren. Er wurde entwickelt, um Händlern zu helfen, potenzielle Einstiegspunkte während kurzer Marktbewegungen in XAU-Paaren zu identifizieren. Funktionen Kerzenstabilitätsindex ( Candle Stability Index ): Misst das Verhältnis zwischen Kerzenkörper und

Der Indikator besteht aus zwei Teilen. Teil I: Farbkerzen zeigen den großen Trend Farbkerzen dienen dazu, den Marktzustand anhand von Farbkerzen zu identifizieren. Wie in den Screenshots gezeigt, befindet sich der Markt in einem Zustand, in dem Sie Long-Orders platzieren oder Short-Orders beenden sollten, wenn die Farbe Aqua ist. Wenn die Farbe Tomate ist, ist es an der Zeit, Short-Orders aufzugeben oder Long-Orders zu beenden. Wenn sich die Farbe ändert, ist es besser, auf den Abschluss zu wart

Das Ziel des Dashboards ist es, einen schnellen Überblick über die tägliche, wöchentliche und monatliche Bandbreite der konfigurierten Assets zu geben. Im "Single-Asset-Modus" zeigt Ihnen das Dashboard mögliche Umkehrpunkte direkt im Chart an und macht so Statistiken direkt handelbar. Wird ein konfigurierter Schwellenwert überschritten, kann das Dashboard einen Bildschirm-Alarm, eine Benachrichtigung (an den mobilen MT4) oder eine E-Mail versenden.
Es gibt verschiedene Möglichkeiten, diese In

Rua Pinbar Dies ist ein Indikator, der Ihnen hilft, Pinbar-Kerzen im Chart schnell zu erkennen. Er kann für jedes Währungspaar und jeden gewünschten Zeitrahmen verwendet werden. Dieser Indikator wird oft verwendet, um Einstiegspunkte zu bestimmen. Sie können sich hier auf das Produkt beziehen: https://www.mql5.com/en/users/phamruacoder/seller
Ein Produkt von Ruacoder Holen Sie sich Code Indikator und Roboter (EA) nach Bedarf.
FREE

VR Ticks ist ein spezieller Indikator für Scalping-basierte Strategien. Dank dieses Indikators kann der Händler den Tick-Chart direkt auf dem Hauptchart des Finanzinstruments sehen. Mit einem Tick-Chart können Sie eine Position am Markt so genau wie möglich eingeben oder schließen. VR Ticks stellt Zeckendaten in Form von Linien dar, deren Farbe sich je nach Richtung ändert – so können Sie die Situation an Zecken visuell verstehen und beurteilen. Der Vorteil von Tick-Charts besteht darin, dass si
FREE

Dieses Meisterwerk verbindet modernste Advance MA-, HMA- und Momentum-Logik zu atemberaubenden Goldstar-Signalen, die Ihnen die Möglichkeit geben, Marktveränderungen ohne Rätselraten zu erkennen. Dieses Tool ist perfekt für jeden Händler - ob Anfänger oder Experte - und verwandelt Ihre XAUUSD-Charts in eine Goldmine der Möglichkeiten. Handeln Sie nicht nur - leben Sie!
Warum Sie es lieben werden
Kristallklare Signale : Goldstern-Warnungen heben wichtige Marktmomente hervor und erleichtern Ihr
FREE

www. tradepositive.lat
ALGO Smart Flow Structure Indicator Der institutionelle Standard für die Marktstruktur. Dieser Indikator wurde für ernsthafte SMC- (Smart Money Concepts) und Price Action-Händler entwickelt und eliminiert das Rauschen herkömmlicher Fraktale. Vergessen Sie nachmalende Signale und Mehrdeutigkeit; erhalten Sie einen kristallklaren Blick auf die reale Marktstruktur , validiert durch strenge algorithmische Regeln. Das Bias Dashboard Treffen Sie fundierte Entscheidungen
FREE

Bitte überprüfen Sie regelmäßig die Registerkarte "What's new " für eine vollständige und aktuelle Liste aller Verbesserungen + Parameter. KOSTENLOSER Indikator für mein Handelsprogramm Take a Break . Dieser Indikator ermöglicht es Ihnen, mehrere andere EAs mit nur einer Take a Break EA-Instanz zu verwalten. Geben Sie einfach die entsprechende Chart-Gruppe in den Indikator(en) und den Take a Break EA-Einstellungen an und schon kann es losgehen.
Setup-Beispiele (Indikator + EA)
Als Voraussetzun
FREE
Correlation Monitor ist ein Indikator zur schnellen Erkennung von Zusammenhängen zwischen Instrumenten: Er hilft, Paare mit starker positiver/negativer Korrelation zu finden, Divergenzen zu erkennen und fundiertere Entscheidungen für Hedging, Pair‑ und Basket‑Trading zu treffen. Meta traider 5.
Hauptfunktionen • Korrelationsmatrix und kompakte Liste: zeigt sofort die Stärke der Beziehung zwischen ausgewählten Symbolen; farbliche Kennzeichnung erleichtert das Lesen. • Mini‑Chart des korrelierten
FREE
Wir stellen den Awesome Oscillator Alert vor, einen leistungsstarken technischen Indikator, der Händlern wertvolle Einblicke in die Marktdynamik und Handelsmöglichkeiten bietet. Mit seinen umfassenden Funktionen und der benutzerfreundlichen Oberfläche ist dieser Indikator ein unverzichtbares Werkzeug für Händler, die sich einen Vorsprung auf dem Markt verschaffen möchten.
Eines der herausragenden Merkmale des Awesome Oscillator Alert ist seine Kompatibilität mit allen Währungspaaren und Zei

Der Simple ICT Concepts Indicator ist ein leistungsfähiges Instrument, das Händlern hilft, die Prinzipien der Inner Circle Trader (ICT) Methodik anzuwenden. Dieser Indikator konzentriert sich auf die Identifizierung von Schlüsselzonen wie Liquiditätsniveaus, Unterstützungs- und Widerstandszonen und Marktstrukturen, was ihn zu einem unschätzbaren Wert für Händler von Preisaktionen und Smart Money-Konzepten macht. Hauptmerkmale Marktstruktur : Marktstrukturkennzeichnungen werden aus dem Durchbrech

Es handelt sich dabei um einen benutzerdefinierten, nicht nachgemalten Indikator zur Identifizierung von Handelsmöglichkeiten bei Swing-Action, wenn sich die Kurse innerhalb eines oberen und unteren Bandes bewegen. Inspiriert durch den Keltner-Kanal, den populärsten Kanal-Indikator, der von Chester Keltner eingeführt wurde. Er unterscheidet sich von einem Bollinger Band. Er stellt die Volatilität anhand der Höchst- und Tiefstkurse dar, während sich die Bollinger-Studien auf die Standardabweichun
FREE

Frühbucher-Breakout: Nutzen Sie die Macht der London Open Sind Sie es leid, in unruhigen, unvorhersehbaren Märkten zu handeln? Der Early Bird Breakout ist Ihr unverzichtbares Werkzeug, um eines der zuverlässigsten und explosivsten Muster am Forex auszunutzen: den Asia Session Breakout . Dieser intelligente Indikator identifiziert automatisch die entscheidenden Kursniveaus, die während der ruhigen asiatischen Stunden festgelegt werden, und alarmiert Sie in dem Moment, in dem das große Volumen de
FREE

The Silent Edge of Smart Money
"Es kommt nicht darauf an, wie viel man tut, sondern wie viel Liebe man in das steckt, was man tut." - Mutter Teresa
Man sagt, dass das wahre Geld im Handel im Verborgenen gemacht wird - dort, wo sich Ineffizienzen verstecken und nur die Aufmerksamsten Kapital schlagen. Genau dort gedeiht der Arbitrage Thief Index (ATI ). Seit Jahren ist dieses Tool mein persönlicher Vorteil , da es in aller Stille risikoarme und ertragreiche Trades identifiziert , bevor die Mass

Es wäre gut, sich des "Kampfes" zwischen Käufern und Verkäufern stets bewusst zu sein. Dann wäre es viel einfacher, die beste Richtung zu bestimmen, um nicht zu verlieren. Dieser Indikator bietet eine originelle Lösung für dieses Problem: Die Angebots- und Nachfragewerte werden mit den Höchst- und Tiefstpreisen für den ausgewählten Zeitraum verglichen, um so die Marktbewegung in Richtung der stärkeren Seite zu bestimmen, ohne die Stärke der Gegenseite zu ignorieren. All dies wird in einem separa
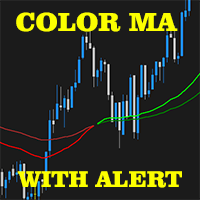
Der 2 EMA Color Alerts-Indikator ist ein leistungsfähiges Instrument für jeden Händler, der die Marktbewegungen im Auge behalten möchte. Durch die Verwendung exponentiell gleitender Durchschnitte (EMAs) kann dieser Indikator Frühwarnsignale für potenzielle Marktumkehrungen und Trendwechsel liefern. Eines der Hauptmerkmale des 2 EMA Color Alerts Indikators sind die anpassbaren Warnungen. Mit dieser Funktion können Händler ihre eigenen Parameter für den Erhalt von Warnungen festlegen, wie z. B. d
FREE

Konstruktionsprinzipien des Indikators. Der Absolute-Bands-Indikator (AB-Indikator) erinnert in seinem Aussehen und seinen Funktionen an den Bollinger-Bands-Indikator , ist aber aufgrund der deutlich geringeren Anzahl von Fehlsignalen, die an ihn ausgegeben werden, für den Handel noch effektiver. Diese Effektivität des Absolute Bands Indikators ist auf seine Robustheit zurückzuführen. Beim Bollinger Bands Indikator befinden sich auf beiden Seiten des gleitenden Durchschnitts - Ma - Linien, die
FREE
ADX-Indikator, der in der Didi's Needles-Methode verwendet wird und es Ihnen erleichtert, im Handel zu bleiben. Solange er blau ist, brauchen Sie nicht auf andere Signale zu achten, um aus dem Handel auszusteigen, und umgekehrt, solange er gelb ist, werden Sie den Verkauf beibehalten. Alles schnell und visuell. Der ADX-Indikator zeigt an, ob es einen Trend auf dem Markt gibt. Dieser Indikator zusammen mit den Nadeln ist die perfekte Kombination für das Surfen in starken Marktbewegungen!!!!
FREE

Relatives Volumen oder RVOL ist ein Indikator, der den Durchschnitt des Volumens von X Tagen angibt, was den Vergleich von Sitzungsvolumen erleichtert.
Das Histogramm hat nur 3 Farben:
Grün - Überdurchschnittliches Volumen
Gelb - Durchschnittliches Volumen
Rot - Unterdurchschnittliches Volumen
Die Standardeinstellung ist 20 Tage, was in etwa einem Handelsmonat entspricht.
Mit den von diesem Indikator erhaltenen Daten können Sie das Engagement hinter einer Bewegung besser beurteilen. So kö
FREE

Fluss-Trend Flow Trend wurde entwickelt, um den Markttrend mit einer speziellen Berechnung und einer Kombination aus Bolinger-Band und statistischer gleitender Periode
zu erkennen, um den Markttrend ohne Frequenzwechsel und Fehler zu erkennen.
Dieser Indikator ist mit einfachen Parametern entworfen, um schnell und einfach und hilfreiche Werkzeuge zu verwenden, um in einer reinen Richtung zu handeln und setzen Sie Ihre SL/TP mit diesem Indikator Cloud-System.
FREE

Full Stochastic - ist ein stochastischer Oszillator, der alle drei wesentlichen Linien anzeigt: %K Langsam K %D Standard Stochastische Oszillatoren zeigen nur Slow K und %D an.
Warum ist es wichtig, alle drei Linien im SO zu analysieren? Benutzer des Standard-SO müssen wählen, ob sie den schnellen oder den langsamen SO verwenden möchten. Im Falle des schnellen SO stellen die Händler den Verlangsamungsparameter in der Regel auf 1 oder 2, oder wenn sie den langsamen SO verwenden möchten, stellen
FREE

Trend Arrow Reaper ist ein Trendfolge-Indikator, der Ein- und Ausstiegssignale durch Pfeile anzeigt. Er analysiert den Preis und identifiziert potenzielle Umkehrpunkte. Hauptmerkmale: Handelspfeile: Blauer Aufwärtspfeil – Kaufsignal (Long). Gelber Abwärtspfeil – Verkaufssignal (Short). Weniger Fehlsignale – Integrierter Filter für mehr Genauigkeit. Funktioniert auf allen Zeitrahmen – Von M1 bis MN. Einfach zu bedienen – Keine komplexen Einstellungen. Anwendung: Warten Sie auf einen P

Institutioneller Liquiditätskompressionsindikator Dieser Indikator misst in Echtzeit die Verengung der Liquidität mithilfe der normalisierten Breite der Bollinger-Bänder, des Volumens und des durchschnittlichen Spreads, um Kompressionsphasen vor Kursausbrüchen zu erkennen. Darstellung:
Professionelles separates Fenster mit „Compression Score“-Histogramm und „Threshold“-Referenzlinie. Hauptmerkmale Früherkennung: Erkennt Kontraktionszonen vor Preisimpulsen. Multifaktorielle Messung: Kombiniert n
Übersicht BBWidth 3Lines ist ein benutzerdefinierter Indikator, der den Abstand zwischen dem oberen und unteren Band der Bollinger-Bänder (also +σ minus −σ) als durchgehende Linie in einem separaten Unterfenster anzeigt. Der Wert wird in Punkten (Points), nicht in Preisen dargestellt. Im Gegensatz zu klassischen Bollinger-Bändern, die sich auf die Preisabweichung konzentrieren, liegt der Fokus dieses Tools ausschließlich auf der Breite der Bänder , was eine visuelle und präzise Analyse der Markt
FREE

Ein Trendindikator, der die Stärke der Bullen und Bären in einer Handelsspanne anzeigt.
Besteht aus zwei Linien:
Die grüne Linie steht für einen ausgeglichenen überkauften/überverkauften Zustand. Die rote Linie gibt die Richtung der Handelsaktivität an. Die Berechnungen werden nicht neu gezeichnet.
Kann für alle Symbole/Instrumente/Zeitrahmen verwendet werden.
Einfach zu verwenden und einzurichten.
Wie der Indikator verwendet wird und was er bestimmt.
Die Grundregel ist, der Richtung der rote
FREE

Dieser Indikator verwendet den Zigzag-Indikator, um Schwunghochs und Schwungtiefs im Preisdiagramm zu identifizieren. Sobald er die Schwunghochs und Schwungtiefs identifiziert hat, kann er sie zur Bestimmung potenzieller Unterstützungs- und Widerstandsniveaus verwenden. Ein Unterstützungsniveau entsteht, wenn der Kurs fällt und von einem Schwungtief wieder nach oben abprallt, was darauf hindeutet, dass auf diesem Niveau ein Kaufdruck besteht. Ein Widerstandsniveau entsteht, wenn der Kurs steigt
FREE
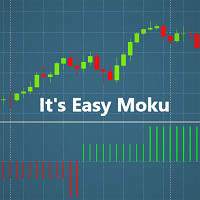
Einführung:
Willkommen liebe Nutzer, Dieser Indikator wurde entwickelt, um Händlern zu helfen, die täglich mit der Suche nach einer Strategie beschäftigt sind . Ich war schon immer von der Ichimoku-Strategie fasziniert, habe aber einige Zeit gebraucht, um herauszufinden, wie sie funktioniert. Easy Moku macht Ichimoku einfach!
Aspekt:
Easy Moku zeigt 2 prinzipielle ICHIMOKU-Signale an: kijun sen/tenken sen crossover Spanne A Spanne B + Kijun sen/tenken sen Beseitigen Sie alle Ichimoku-Linien!
FREE
Beschreibung:
NR4 & NR7 Inside Bar Highlighter für MetaTrader 4 ist ein Indikator, der automatisch Preis-Kompressionsmuster erkennt, basierend auf der Kombination von NR4 oder NR7 mit einem Inside Bar . Funktionsweise:
Das Muster NR4 (Narrow Range 4) identifiziert die Kerze mit der kleinsten Spanne der letzten 4 Balken, während NR7 die letzten 7 betrachtet. Wenn diese enge Spanne zusammen mit einem Inside Bar (eine Kerze, die vollständig in der vorherigen enthalten ist) auftritt, deutet das hä
FREE

Produkttitel Smart Bulls (MT4) – Teil der SmartView Indicators Serie Kurzbeschreibung Ein Bulls -Indikator mit einzigartiger Benutzererfahrung auf der MetaTrader-Plattform. Bietet erweiterte Funktionen, die zuvor nicht verfügbar waren, wie das Öffnen von Einstellungen per Doppelklick, das Ausblenden und Anzeigen von Indikatoren ohne Löschung und die Anzeige des Indikatorfensters in voller Chartgröße. Entwickelt für nahtlose Zusammenarbeit mit dem Rest der SmartView Indicators Serie. Überblick Di
FREE
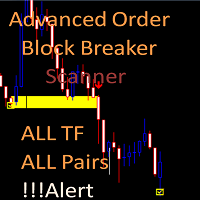
Advanced Order Block Breaker Scanner
Dieser Scanner kann kostenlos heruntergeladen werden, ist aber davon abhängig, dass Sie den Advanced Order Block Breaker Indikator besitzen. Sie müssen den Indikator hier kaufen: https: //www.mql5.com/en/market/product/59127
MT5-Version: https: //www.mql5.com/en/market/product/62769
Der Scanner zeigt Ihnen auf einem einzigen Chart alle Timeframes (M1 bis Monthly) mit ihrem eigenen Status für den Indikator: advance order block breaker Scannen Sie alle Zeitr
FREE
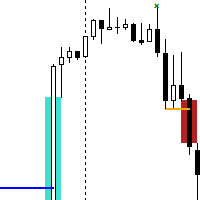
Der Break of Structure (BoS)- und Change of Character-Indikator mit Fair Value Gap (FVG)-Filter ist ein spezielles Instrument zur Verbesserung von Handelsstrategien, indem er hochwahrscheinliche Handelsgelegenheiten auf Kurscharts aufzeigt. Durch die Integration der BoS- und Change of Character-Konzepte mit der FVG-Formation bietet dieser Indikator Händlern einen robusten Filtermechanismus, um optimale Einstiegs- und Ausstiegspunkte zu identifizieren. Der Indikator identifiziert Fälle, in denen
FREE

Dieser Indikator ermöglicht die Analyse eines Diagramms nach der Regel von Angebot und Nachfrage. Sie werden Zonen von Käufen und Verkäufen sehen und die profitabelsten Punkte für die Eröffnung von Positionen bestimmen. Der Indikator basiert auf dem Prinzip der Marktfraktalität. Die Zonen im Chart zeigen die Stellen an, an denen ein starker Käufer oder Verkäufer den Preis umkehren und seine Richtung ändern ließ. Der Indikator verfügt über mehrere Arten der Zonenberechnung. Farbe und Art der Zone
FREE

Ich empfehle Ihnen, den Blog des Produkts (Handbuch) von Anfang bis Ende zu lesen , damit von Anfang an klar ist, was der Indikator bietet . Dieser Multi-Oszillator-, Multi-Zeitrahmen- und Multi-Symbol-Indikator identifiziert, wenn eine Divergenz zwischen dem Preis und einem Oszillator/Indikator auftritt. Er identifiziert sowohl regelmäßige/klassische (Trendumkehr) als auch versteckte (Trendfortsetzung) Divergenzen. Er verfügt über Filteroptionen wie gleitender Durchschnitt, RSI/Bollinger, ADX,
Eine EA-Version ist in Vorbereitung. Sie können eine private Nachricht "Benachrichtigung über EA-Version" senden.
EA wird vielseitig sein mit vielen Einstellungen für den Handel mit verschiedenen Indikatoren. Der neue EA wird auch den Handel mit diesem Indikator ermöglichen. Zum Beispiel, dass Signale nach X Signalen/Balken bis X Signale/Balken in eine Richtung, vor dem Wechsel der Richtung. Wenn der Break Out vor/nach dem Signal eines anderen Indikators erfolgt. Sammeln Sie den Gewinn bei jed
FREE
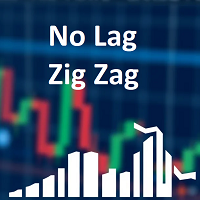
Klassische ZigZag-Formel. Aber keine Lags und Repaints. Sie können auf den Screenshots sehen, dass es Werte zwischen den Spitzen zeigt und es ist nützlich, um Strategien zu testen, die auf dem Indikator basieren. Denn manchmal finden die Leute eine gute Idee, verstehen aber nicht, dass bei Repainting-Indikatoren einige Dinge zu beachten sind. Die Parameter sind die gleichen wie beim ursprünglichen ZigZag-Indikator: Tiefe, Abweichung und Rückschritt.
FREE
Range Cycle Indikator. Gibt Signale über den Preisbereich Zyklus geglättet durch gleitenden Durchschnitt. Es ist besser, ihn auf H1+ Zeitrahmen zu verwenden und Seitwärtsmärkte zu vermeiden. Denn wenn der Markt flach ist, wird dieser Indikator zu viele Null-Gewinn- oder sogar Verlustsignale geben. Parameter: PopUpAlert - für die Benachrichtigung bei Trendänderungen; EMailAlert - für E-Mail-Warnungen; period - dies ist ein Glättungskriterium, verwenden Sie höhere Werte für niedrigere Zeitrahmen;
FREE
Der Price Action Indicator gibt Ihnen je nach Zeitrahmen und verwendeter Strategie umgekehrte oder sogar kontinuierliche Trendsignale. Dies ist kein heiliger Gral-Indikator und es wird keine 100%ige Gewinnrate geben!!! Wie Sie sehen können, gibt er nicht viele Signale aufgrund der Preisbewegungen in einem seitlichen (flachen) Trend. Sie können ihn für alle wichtigen Währungspaare und sogar für Indizes verwenden. Bitte beachten Sie die Verwendung dieses Indikators mit anderen Strategien und Indi
FREE
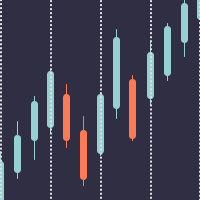
Bessere Perioden-Trennzeichen für MetaTrader 4 Die eingebaute Funktion der Periodentrenner erlaubt es nicht, den Zeitraum zu spezifizieren. Daher können Sie diesen Indikator verwenden, um anpassbare Periodentrenner zu erstellen. Auf Intraday-Charts können Sie Periodenseparatoren zu einem bestimmten Zeitpunkt platzieren. Sie können auch zusätzliche Periodenseparatoren zu einem bestimmten Zeitpunkt am Montag platzieren, um den Beginn einer Woche zu markieren. Auf Charts mit höherem Zeitrahmen funk
FREE
Was ist der ADX_DI-Indikator? ADX_DI ist ein fortschrittlicher Indikator für die technische Analyse, der für die MetaTrader-Plattform entwickelt wurde. Er kombiniert die Komponenten Average Directional Index und Directional Indicator, um die Stärke und Richtung des Markttrends zu analysieren. Was macht er? Misst die Trendstärke : Die ADX-Linie zeigt die Stärke des Markttrends an Bestimmt die Richtung : DI+ (grün) und DI- (rot) Linien identifizieren die Trendrichtung Erkennt Trendänderungen : DI+
FREE
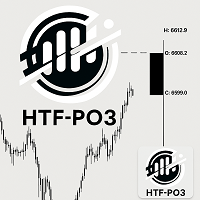
HTF Power of Three (ICT) - MT4 Indikator Übersicht Der HTF Power of Three-Indikator ist eine professionelle Umsetzung des Power of Three-Konzepts des Inner Circle Trader (ICT), das von Larry Williams inspiriert wurde. Dieser Indikator visualisiert die Entwicklung von HTF-Kerzen in Echtzeit auf jedem Chart mit niedrigerem Zeitrahmen und ist damit ein unverzichtbares Werkzeug für ICT-Händler, die institutionelle Kursbewegungsmuster studieren. Was ist Power of Three (PO3)? Power of Three steht für

Wenn die Preise ausbrechen Widerstandsniveaus sind mit Larry Williams' Percentage Range "WPR" Oszillator kombiniert bricht aus seiner historischen Widerstandsniveaus dann Wahrscheinlichkeit entsteht, um weitere Preise zu erfassen. Es wird dringend empfohlen, Preisausbruch mit Oszillator Ausbruch zu bestätigen, da sie vergleichbare Auswirkungen auf den Preis brechen Unterstützungs-und Widerstandsniveaus haben; sicherlich, kurze Trades wird die gleiche Wahrnehmung haben. Das Konzept basiert darauf
FREE
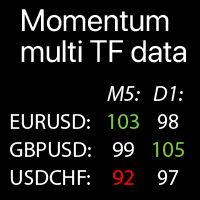
Multi-Zeitrahmen Momentum-Werte für ausgewählte Symbole: Vergleichen Sie die aktuellen Markttrends Der Indikator zeigt die Momentum-Indikator- Werte aus allen ausgewählten Zeitrahmen und Symbolen in einer einzigen Tabelle an, was eine schnelle Analyse der aktuellen Marktpreis- Trends ermöglicht.
Mein multifunktionales Tool : 66+ Funktionen | Kontaktieren Sie mich bei Fragen | MT5-Version Jedes Symbol kann angepasst werden: entfernt / ersetzt. Sie können bis zu 40 Symbole hinzufügen. D
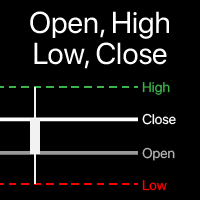
Visualisierung der Open, High, Low, Close Levels auf dem Chart Sie können jeden Zeitrahmen , nicht nur den aktuellen wählen . Der Offset des berechneten Bars kann angepasst werden : der aktuelle (schwebende) Bar , oder eine festgelegte Anzahl von Bars zurück . Multifunktionswerkzeug : beinhaltet 66+ Funktionen | Kontaktieren Sie mich bei Fragen | MT5-Version In den Indikatoreinstellungen können Sie folgendes konfigurieren: Offs

Das Produkt Divergence Mom Stoch Adx Bears Bulls wurde entwickelt, um die Unterschiede zwischen den Indikatoren und dem Preis zu ermitteln. Es ermöglicht Ihnen, anhand dieser Unterschiede Aufträge zu eröffnen oder Trends zu setzen. Der Indikator verfügt über 4 verschiedene Divergenzmerkmale.
Divergenz-Typen Klasse-A-Divergenz Klasse B Divergenz Klasse-C-Divergenz Versteckte Divergenz
Produktmerkmale und Empfehlungen ommissionsempfehlungen Der Indikator verfügt über 5 Indikatoren Indikatoren =
FREE

" WinWiFi All in Signal wurde auf der Grundlage der Prinzipien der Candlestick-Konsolidierung (กระจุกตัว) und der Preiserweiterung (กระจายตัว) entwickelt. Durch die Identifizierung dieser wichtigen Verhaltensweisen auf dem M5-Zeitrahmen können Händler Hochfrequenz-Einträge mit Vertrauen ausführen. Unser System eliminiert die Zeitzonenunterschiede zwischen den Brokern und konzentriert sich ausschließlich auf das Kursgeschehen."
WinWiFi All in Signal - Meistern Sie den M5-Goldmarkt "Erschließen S
FREE

Bullen- und Bären-Stärke-Indikator Update 1.3
Der Bullen- und Bären-Indikator verfügt jetzt über ein eingebautes Volumenprofil zur Erkennung von Bereichen mit dem stärksten Volumen innerhalb eines gegebenen Balkenbereichs. Dies kann weiter angepasst werden, um Ihre eigenen Einstellungen und Vorlieben für die Experten-Erkennung der Bullen- und Bären-Stärke mit dem höchsten Volumen zu ermöglichen.
Dies hilft bei: Früherkennung und präzisen Einstiegsmöglichkeiten Erkennung von Umkehrungen Erkennu

EA Mastermind - Die intelligente All-in-One-Handelslösung Es ist an der Zeit, sich für Ihren Handelserfolg nicht mehr auf Glück zu verlassen.
Lernen Sie EA Mastermind kennen - eine erstklassige Trading-Suite der nächsten Generation , die vom BATIK-Team entwickelt wurde, einem Kollektiv von Fachleuten für Marktanalyse, Algorithmik und intelligentes Trading-Design. EA Mastermind ist nicht einfach nur ein weiterer Expert Advisor - es ist ein revolutionäres Ökosystem , das drei intelligente Systeme
FREE

Candle Pattern Finder
Der Candle Pattern Finder ist ein leistungsstarker MT4-Indikator, der Händlern hilft, wichtige Candlestick-Muster in Echtzeit zu erkennen. Egal, ob Sie mit Trends, Umkehrungen oder Konsolidierungen handeln, dieses Tool hebt wichtige Preisaktionssignale direkt auf dem Chart hervor und hilft Ihnen, schnellere und sicherere Handelsentscheidungen zu treffen. Erkennt beliebte Candlestick-Muster: Bullish/Bearish Engulfing Hammer & Umgekehrter Hammer Sternschnuppe & Hanging Man D
FREE

Dieser Indikator verwendet einen anderen Ansatz als die vorherige Version, um seine Trendlinien zu erhalten. Diese Methode stammt von Orchard Forex, und der Prozess der Erstellung des Indikators wird in dem Video https://www.youtube.com/watch?v=mEaiurw56wY&t=1425s demonstriert .
Die Grundidee hinter diesem Indikator ist, dass er eine Tangente an die höchsten und niedrigsten Niveaus der für die Berechnung verwendeten Balken zeichnet und dabei sicherstellt, dass sich die Linien nicht mit den betr
FREE

"Capture the sleeping and waking alligator." Detect trend entrance/exit conditions - this indicator can also be tuned according to your trading style. You can adjust a confidence parameter to reduce false positives (but capture less of the trend). Er basiert auf einer Abwandlung des Alligator-Indikators von Bill Williams, einem frühen Pionier der Marktpsychologie. Es gibt zwei Hauptstrategien: entweder den "konservativen" Ansatz, um häufiger gewinnbringende Geschäfte zu machen (bei geringerem G
FREE
Advanced UT BOT ALERTS for MT4 Professionelles Multi-Filter-Trend-Erkennungssystem | Verbesserte UT BOT Engine Wir bieten ausschließlich hochwertige Indikatoren an. Advanced UT BOT wurde für den professionellen Einsatz entwickelt und verwendet eine stabile Signallogik sowie sichere Berechnungen, um Verzögerungen oder fehlerhafte Aktualisierungen zu vermeiden.
Er zeichnet keine Signale neu, entfernt oder verändert keine historischen Daten.
Alle BUY- und SELL-Signale werden erst nach dem Kerzensch
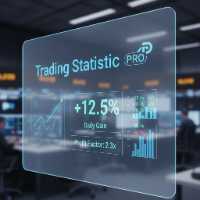
Der statistische Indikator für den Metatrader 5 TradingStatisticPro sammelt statistische Daten über Ihren Handel, die es Ihnen erleichtern, die Effektivität des Handels, den erzielten Gewinn und die Risiken zu beurteilen. Der Indikator ist kompakt in der Ecke des Hauptcharts des Terminals platziert und zeigt die folgenden Informationen an: 1. Der erzielte Gewinn. 2. Der maximale Drawdown. 3. Der Erholungsfaktor. 4. Der Gewinnfaktor. 5. Das Verhältnis von gewinnbringenden und ungewinnbringenden
FREE

SX Price Action Patterns ist ein umfassender Indikator, der verschiedene Price Action Patterns auf dem Chart für diejenigen anzeigt, die am Price Action Trading interessiert sind. Diese Muster sind wie folgt: Ein Pin Bar ist ein Candlestick-Kursbalken, der einen langen Docht auf einer Seite und einen kleinen Körper hat. Er ist ein starkes Signal für eine Preisumkehr in einer Währungshandelsstrategie. Ein Inside Bar ist durch einen Balken oder eine Kerze gekennzeichnet, der/die vollständig inner
FREE

Easy Scalp System Pro: Verpassen Sie nie wieder einen Einstieg! Haben Sie genug von komplexen Trading-Setups, bei denen Sie nur raten können? Wir stellen Ihnen das Easy Scalp System Pro vor - Ihr ultimatives, hochpräzises Werkzeug für schnelle Gewinne in jedem Markt! Dieser leistungsstarke Indikator kombiniert das Beste aus Trendbestätigung (Multiple EMAs) und Momentum-Timing (MACD) in klaren, nicht übermalenden Kauf- und Verkaufspfeilen direkt auf Ihrem Chart. Er wurde für Scalper und Daytrade
FREE

Zeichnen und Synchronisieren von Objekten Mehrere Diagramme 1. Zeichnen Sie Objekte per Tastendruck. (Sie müssen: 1. Drücken Sie die Funktionstaste => 2. Klicken Sie auf die Stelle, die Sie zeichnen möchten => 3. Zeichnen Sie es => 4. Drücken Sie ESC, um abzuschließen). (Wenn Sie nach dem Drücken der Funktionstaste nicht zeichnen wollen, müssen Sie ESC drücken, um abzubrechen). 2. entwickeln : Ausgewählte Objekte mit mehreren Diagrammen über die Schaltfläche synchronisieren. 3. Entwickeln: Ausb
FREE

Dieses Dashboard kann kostenlos heruntergeladen werden, setzt aber voraus, dass Sie den Gold Pro MT4-Indikator besitzen . Holen Sie sich den Indikator hier: https: //www.mql5.com/en/market/product/60430
Das Dashboard zeigt Ihnen auf einem einzigen Chart alle Zeitrahmen (M1 bis Monthly) mit ihrem eigenen Status für den Indikator :Gold Pro MT4
alle Zeitrahmen und alle Symbole: intelligenter Algorithmus erkennt den Trend, filtert das Marktrauschen heraus und gibt Einstiegssignale!!!
Wie man de
FREE

Der Handel mit Hilfe des MACD-Indikators ist jetzt noch bequemer geworden. Flexible Einstellungen helfen Ihnen, das auszuwählen, was Sie für Ihren Handel wirklich brauchen. Verwenden Sie die Strategie, die Sie brauchen - der Indikator verwendet 3 Strategien. Laden Sie die Demo gleich jetzt herunter! Ich empfehle Ihnen, sich meinen Berater anzusehen - Night Zen EA Abonnieren Sie meinen Telegram-Kanal, Link in meinem Profil Kontakte - mein Profil Siehe auch meine anderen Produkte auf mql5.com - me
FREE

Dieser Indikator ist nicht nur für den Handel, sondern auch zum Lernen geeignet. Mit ihm können Sie lernen, Trend, Unterstützung und Widerstand zu erkennen.
Sie haben wahrscheinlich schon von der Dow-Trendtheorie gehört, bei der höhere Hochs und höhere Tiefs einen Aufwärtstrend und niedrigere Hochs und niedrigere Tiefs einen Abwärtstrend anzeigen. Dieser Indikator bestimmt diesen Trend auf der Grundlage der Dow-Theorie. Sie müssen lediglich eine Zahl eingeben, die die Anzahl der Kerzen zwische
FREE

Der Zweck dieser neuen Version des MT4-Standardindikators, der in Ihrer Plattform enthalten ist, besteht darin, in einem Unterfenster mehrere Zeitrahmen desselben Indikators anzuzeigen. Siehe das Beispiel im Bild unten. Aber die Anzeige ist nicht wie bei einem einfachen MTF-Indikator. Dies ist die tatsächliche Anzeige des Indikators in seinem Zeitrahmen. Hier sehen Sie die verfügbaren Optionen des FFx-Indikators: Wählen Sie die anzuzeigenden Zeitrahmen (M1 bis Monthly) Definieren Sie die Breite
FREE
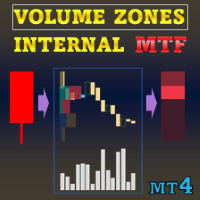
Spezialangebot : ALL TOOLS , nur $35 pro Stück! New tools will be $30 for the first week or the first 3 purchases ! Trading Tools Channel on MQL5 : Join my MQL5 channel to update the latest news from me Volume Zones Internal Visualizer Multi-Timeframe – die ultimative Lösung, um beim Handel auf einem höherem Zeitrahmen einen detaillierten Einblick in die Volumenaktivität auf niedrigeren Zeitrahmen zu erhalten. Wenn Sie ein leistungsstarkes und intuitives Volumen-Analysetool suchen,

Dieser Outside Bar Indikator ist das Gegenteil des Inside Bar Indikators. Was dieser MT4 Outside Bar Indikator also tut, ist die Identifizierung von Outside Bars für Sie, wenn sie sich auf Ihren Charts bilden. Outside Bar ist ein berühmtes Handelsmuster, bei dem der Balken ein höheres Hoch und ein niedrigeres Tief im Vergleich zum vorherigen Balken, auch bekannt als Mother Bar, aufweist. Um auf der Grundlage von Outside Bars zu handeln, platzieren Sie einfach eine Kauf-Stopp-Order über dem hohen
FREE
Der MetaTrader Market ist eine einzigartige Plattform für den Verkauf von Robotern und technischen Indikatoren.
Das Merkblatt für Nutzer der MQL5.community informiert Sie über weitere Möglichkeiten: nur bei uns können Trader Handelssignale kopieren, Programme bei Freiberuflern bestellen, Zahlungen über das Handelssystem automatisch tätigen sowie das MQL5 Cloud Network nutzen.
Sie verpassen Handelsmöglichkeiten:
- Freie Handelsapplikationen
- Über 8.000 Signale zum Kopieren
- Wirtschaftsnachrichten für die Lage an den Finanzmärkte
Registrierung
Einloggen
Wenn Sie kein Benutzerkonto haben, registrieren Sie sich
Erlauben Sie die Verwendung von Cookies, um sich auf der Website MQL5.com anzumelden.
Bitte aktivieren Sie die notwendige Einstellung in Ihrem Browser, da Sie sich sonst nicht einloggen können.