Technische Indikatoren für den MetaTrader 4 - 3

Über 100.000 Benutzer auf MT4 und MT5 Blahtech Candle Timer zeigt die verbleibende Zeit an, bevor der aktuelle Balken geschlossen wird und ein neuer Balken entsteht. Er kann für das Zeitmanagement verwendet werden Links [ Installieren | Update | Schulung ] Funktions-Highlights
Der einzige Kerzen-Timer auf MT4 ohne Stottern und ohne Verzögerung Wählbarer Standort Verfolgt die Serverzeit und nicht die lokale Zeit Mehrere Farbschemata Konfigurierbarer Text Anpassbare Warnungen und Meldungen Optimi
FREE

Der Unterstützungs- und Widerstandsniveaufinder:
Der Unterstützungs- und Widerstandsniveaufinder ist ein fortschrittliches Werkzeug, das dazu entwickelt wurde, die technische Analyse beim Handel zu verbessern. Mit dynamischen Unterstützungs- und Widerstandsniveaus passt er sich in Echtzeit an, während sich neue Schlüsselpunkte im Chart entfalten, und bietet so eine dynamische und reaktionsschnelle Analyse. Seine einzigartige Multi-Zeitrahmen-Fähigkeit ermöglicht es Benutzern, Unterstützungs- u
FREE

Dieser Indikator verfolgt den Markttrend mit einer unübertroffenen Zuverlässigkeit, indem plötzliche Schwankungen und Marktgeräusche ignoriert werden. Es wurde entwickelt, um Intraday-Charts und kleine Zeitfenster im Trend zu handeln. Die Gewinnquote liegt bei 85%. [ Installationsanleitung | Update-Anleitung | Fehlerbehebung | FAQ | Alle Produkte ] Erstaunlich einfach zu handeln Finden Sie überverkaufte / überkaufte Situationen Genießen Sie jederzeit einen rauschfreien Handel Vermeiden Sie es,

Wenn Sie dieses Projekt mögen, hinterlassen Sie eine 5-Sterne-Bewertung. Volumengewichtete Durchschnittspreise sind das Verhältnis des gehandelten Wertes
zum Gesamtvolumen
über einen bestimmten Zeithorizont gehandelt. Es ist ein Maß für den
Durchschnittspreis zu
die über den Handelshorizont gehandelt wird. VWAP wird häufig als
Trading-Benchmark von Investoren, die so passiv wie möglich in ihrer
Ausführung. Mit diesem Indikator können Sie die VWAP für: Aktueller Tag. Aktuelle Woche. Aktueller M
FREE

Gold Venamax – das ist der beste technische Indikator für Aktien. Der Indikatoralgorithmus analysiert die Preisbewegung eines Vermögenswerts und spiegelt die Volatilität und potenzielle Einstiegszonen wider. Indikatorfunktionen: Dies ist ein Super-Indikator mit Magic und zwei Blöcken von Trendpfeilen für komfortables und profitables Trading. Auf dem Diagramm wird eine rote Schaltfläche zum Wechseln von Blöcken angezeigt. Magic ist in den Indikatoreinstellungen eingestellt, sodass Sie den Indi

EnergyX-Indikator EnergyX ist ein einzigartiges Instrument, das die "Energie" des Marktes in einem separaten Fenster visualisiert. Es hilft Ihnen, schnell zu erkennen, wann die Energie steigt oder fällt, und erleichtert so das Erkennen potenzieller Handelsmöglichkeiten. Gelbe Balken zeigen an, wenn die Energie steigt. Rote Balken zeigen an, wenn die Energie abnimmt. Wie Sie es verwenden : Wenn sich der Kurs einem Widerstandsniveau nähert: Wenn die Energie hoch ist und zunimmt (gelb), besteht ein
The price is indicated only for the first 30 copies ( only 2 copies left ). Der nächste Preis wird auf 150 $ erhöht. Der endgültige Preis wird $250 sein . Sniper Delta Imbalance ist ein professionelles Tool für die tiefe Delta-Analyse - die Differenz zwischen Käufer- und Verkäufervolumen. Es hebt die Volumenanalyse auf die nächste Stufe und ermöglicht es Händlern, in Echtzeit zu sehen, wer den Preis kontrolliert - Käufer oder Verkäufer - un

Matrix Arrow Indicator MT4 ist ein einzigartiger 10-in-1-Trend, der zu 100 % nicht neu gezeichnet werden kann. Multi-Timeframe-Indikator, der für alle Symbole/Instrumente verwendet werden kann: Forex, Rohstoffe, Kryptowährungen, Indizes, Aktien. Der Matrix Arrow Indicator MT4 wird den aktuellen Trend in seinen frühen Stadien bestimmen und Informationen und Daten von bis zu 10 Standardindikatoren sammeln, die sind: Durchschnittlicher Richtungsbewegungsindex (ADX) Rohstoffkanalindex (CCI) Klassis

Super Signal – Skyblade Edition
Professionelles No-Repaint / No-Lag Trend-Signalsystem mit außergewöhnlicher Gewinnrate | Für MT4 / MT5 Hauptmerkmale: Super Signal – Skyblade Edition ist ein intelligentes Signalsystem, das speziell für den Trendhandel entwickelt wurde.
Es nutzt eine mehrstufige Filterlogik, um ausschließlich starke, richtungsbestimmte Bewegungen mit echtem Momentum zu identifizieren. Dieses System versucht nicht, Hochs oder Tiefs vorherzusagen . Ein Signal wird nur dann ausgel

Auto Optimized MFI ist ein selbstanpassender Indikator, der sich automatisch an Ihren Markt und Zeitrahmen anpasst. Er nutzt reale Handelssimulationen auf historischen Daten, um die effektivsten MFI-Kauf- und Verkaufsniveaus zu ermitteln. Im Gegensatz zu klassischen MFI-Indikatoren mit festen Schwellenwerten (wie 80/20) reagiert dieser Indikator dynamisch auf tatsächliches Preis- und Volumenverhalten. Funktionsweise Der Indikator analysiert historische Kerzen innerhalb eines benutzerdefinierten

Auto Optimized Bollinger Bands – Anpassungsfähiges Volatilitätswerkzeug basierend auf realem Marktverhalten Auto Optimized Bollinger Bands ist ein fortschrittlicher Indikator für MT4, der die klassischen Bollinger Bands verbessert, indem er mittels vergangener Tradesimulation die optimalen Perioden- und Standardabweichungswerte automatisch ermittelt. Anstatt sich auf feste Einstellungen zu verlassen, passt sich das Tool dynamisch an Marktveränderungen und Preisstrukturen an und erstellt so Echtz

Wie oft haben Sie schon einen Trading-Indikator mit großartigen Backtests, Nachweisen der Live-Kontoleistung mit fantastischen Zahlen und überall Statistiken gekauft, aber nachdem Sie ihn verwendet haben, sprengen Sie Ihr Konto?
Sie sollten einem Signal nicht einfach so vertrauen, Sie müssen wissen, warum es überhaupt erschienen ist, und das ist es, was RelicusRoad Pro am besten kann! Benutzerhandbuch + Strategien + Schulungsvideos + Private Gruppe mit VIP-Zugang + Mobile Version verfügbar
Ein

Currency Strength Meter is the easiest way to identify strong and weak currencies. This indicator shows the relative strength of 8 major currencies + Gold: AUD, CAD, CHF, EUR, GBP, JPY, NZD, USD, XAU. Gold symbol can be changed to other symbols like XAG, XAU etc.
By default the strength value is normalised to the range from 0 to 100 for RSI algorithm: The value above 60 means strong currency; The value below 40 means weak currency;
This indicator needs the data of all 28 major currency pairs

War: $299 Jetzt: $99 Supply Demand nutzt frühere Kursbewegungen, um potenzielle Ungleichgewichte zwischen Käufern und Verkäufern zu erkennen. Der Schlüssel liegt darin, die Zonen mit den besten Chancen zu identifizieren, nicht nur die unberührten Zonen. Der Blahtech Supply Demand Indikator bietet eine Funktionalität, die bisher auf keiner Handelsplattform verfügbar war. Dieser 4-in-1-Indikator hebt nicht nur die Zonen mit höherer Wahrscheinlichkeit hervor, indem er eine Multikriterien-Stärke-Eng
Binary Trader Master ist ein pfeilbasierter Indikator, der den Schluss der Kerze vorhersagt. Es führt seine Analyse nur innerhalb einer Kerze durch. Wenn sich die Kerze öffnet, dauert es einige Augenblicke, um die Analyse durchzuführen und den Schluss der Kerze vorherzusagen. Dann erzeugt es ein Signal. Der Indikator ermöglicht es Ihnen auch, Zeitlimits anzuwenden, die er für die Analyse verwenden kann, was bedeutet, dass Sie dem Indikator tatsächlich sagen können, wie viel Zeit er für die Analy

Hauptzweck: "Pin Bars" wurde entwickelt, um Pin Bars auf Finanzmarktdiagrammen automatisch zu erkennen. Eine Stiftleiste ist eine Kerze mit einem charakteristischen Körper und einem langen Schwanz, die eine Trendumkehr oder -korrektur signalisieren kann.
Funktionsweise: Der Indikator analysiert jede Kerze auf dem Diagramm und bestimmt die Größe von Körper, Schwanz und Nase der Kerze. Wenn eine Stiftleiste erkannt wird, die vordefinierten Parametern entspricht, markiert der Indikator sie auf de
FREE
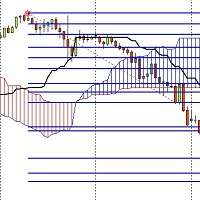
Ich habe einen Indikator entwickelt, der sowohl auf der Fibo-Musang-Strategie als auch auf dem Preisdurchbruch der Ichimoku-Wolke basiert und erstaunliche Ergebnisse liefert .
Die Funktionen sind:
1- Sobald er aktiviert ist, zeigt er Ihnen den Trend an, in dem Sie sich auf dem Diagramm befinden .
2- Nach einem Trendwechsel gibt er Ihnen einen Alarm auf dem PC oder eine Benachrichtigung auf Ihrem Telefon, wenn Sie unterwegs sind.
3- Es sendet Ihnen die genauen Preise für eine Order und 3 Take

Der Volatilitätslevel-Indikator ist ein Volatilitätsoszillator, der Trendumkehrpunkte anzeigt. Preis Trends hat reverese, wenn die Volatilität inreased. dieser Indikator zeigt Trendumkehrpunkte Volatilität. meist gleiches Niveau nach oben und unten Volatilität ist Umkehrpunkte. rote Farbe zeigt Punkte der Volatilität nach oben. und wahrscheinlich Trend wird nach unten. blaue Farbe Oszillator zeigt tiefen Punkt des Preises, wenn erhöhte volatiliyty. Auf den Bildern sind die horizontalen Linien de

Zurzeit bin ich auf den 4-Stunden-Chart umgestiegen - verwende aber auch andere Zeitrahmen zur Bestätigung :-) Ich ändere meinen Hauptzeitrahmen je nach der Marktbewegung zu dieser Zeit. Der Hurricane Forex Indicator ist ein Multi-Time-Frame-Indikator, der u.a. Handelsbenachrichtigungen, Handelsrechner, Momentum-Indikator, Risiko-Belohnung und vieles mehr beinhaltet. Wir haben auch einen kostenlosen Handelsraum für unsere Benutzer. Bitte sehen Sie sich das Video an, um zu erfahren, wie dieser In

Dieser Indikator ist eine weitere Variante des bekannten und leistungsstarken Indikators Fibonacci-SS https://www.mql5.com/en/market/product/10136 , hat aber ein anderes Verhalten bei der Platzierung von Pending Order und TP-Linie. Platziert automatisch Fibonacci-Retracement-Linien von den letzten höchsten und niedrigsten sichtbaren Balken auf dem Chart mit: Eine automatische Pending Order (Buy/Sell). Taking Profit 1, Taking Profit 2 ist der Pivot-Punkt und Taking Profit 3 für eine erweiterte Ge

Kontaktieren Sie mich nach der Bezahlung, damit ich Ihnen das Benutzerhandbuch als PDF-Datei zusenden kann . Einführung Der Indikator des gleitenden Durchschnitts ist der bekannteste und einer der beliebtesten Indikatoren unter Tradern. Er ist sehr einfach zu handhaben, aber eine grundlegende Frage ist immer wieder eine große Herausforderung für die Trader: Welches ist die optimale Einstellung des gleitenden Durchschnitts für jeden Chart-Zeitrahmen? Die Antwort auf diese Frage ist sehr schwieri
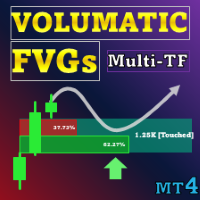
Sonderangebot : ALL TOOLS , nur $35 pro Stück! Neue Tools kosten $30 in der ersten Woche oder für die ersten 3 Käufe ! Trading Tools Channel on MQL5 : Treten Sie meinem MQL5-Kanal bei, um meine neuesten Nachrichten zu erhalten Volumatic Fair Value Gaps (FVG) identifiziert und verwaltet bedeutende Preis-Ungleichgewichtszonen und zerlegt das richtungsbezogene Volumen innerhalb jedes Gaps. Das Volumen wird aus einem niedrigeren Zeitrahmen (Standard M1, vom Nutzer wählbar) entnommen,
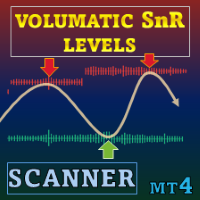
Sonderangebot : ALL TOOLS , nur $35 pro Stück! Neue Tools kosten $30 während der ersten Woche oder bei den ersten 3 Käufen ! Trading Tools Channel on MQL5 : Trete meinem MQL5‑Kanal bei, um die neuesten Nachrichten zu erhalten Volumatic Support/Resistance Levels Scanner ist ein Support‑ und Resistance‑Indikator, der der Preisstruktur ein Volumen‑Kontext hinzufügt. Durch die Darstellung, wie sich Handelsaktivität um jüngste Pivot‑Punkte konzentriert, zeigt er, wo Kauf‑ oder Verkaufsi
Der Trend Line PRO Indikator ist eine unabhängige Handelsstrategie. Er zeigt den Trendwechsel, den Einstiegspunkt in die Transaktion an und berechnet automatisch drei Ebenen des Take-Profit- und Stop-Loss-Schutzes.
Trend Line PRO ist perfekt für alle Meta Trader-Symbole: Währungen, Metalle, Kryptowährungen, Aktien und Indizes. Der Indikator wird im Handel auf realen Konten verwendet, was die Zuverlässigkeit der Strategie bestätigt. Robots, die Trend Line PRO verwenden , und echte Signale finden

Der "Gold Trader Pro Indicator" ist ein fortschrittliches technisches Analysetool für die MetaTrader 4-Plattform, das Ihnen helfen soll, fundierte Handelsentscheidungen für Gold zu treffen. Mit einer Kombination aus gleitenden Durchschnitten, RSI, ADX, MACD und Volumenanalyse liefert dieser Indikator klare Handelssignale über mehrere Zeitrahmen, einschließlich M5, M15, M30, H1, H4 und D1. Meine Indikatoren sind kostenlos. Ich bitte nur darum, dass Sie Ihr Feedback hinterlassen, um mir zu helfen
FREE

MT4-Version: https://www.mql5.com/en/market/product/125434 MT5-Version: https://www.mql5.com/en/market/product/157662
MT4-Assistent: https://www.mql5.com/en/market/product/107986
Rally Base Rally (RBR), Drop Base Rally (DBR), Drop Base Drop (DBD), Rally Base Drop (RBD), Fair Value Gap (FVG) / Ungleichgewicht, Hidden Base
Wir präsentieren den „Supply Demand MT4“-Indikator – Ihr ultimatives Werkzeug, um sich präzise und sicher in der dynamischen Welt der Finanzmärkte zu bewegen. Dieser innovat
FREE

Gartley Hunter Multi - Ein Indikator zur gleichzeitigen Suche nach harmonischen Mustern auf Dutzenden von Handelsinstrumenten und auf allen klassischen Zeitrahmen: (m1, m5, m15, m30, H1, H4, D1, Wk, Mn). Manual (Be sure to read before purchasing) | Version for MT5 Vorteile 1. Muster: Gartley, Butterfly, Shark, Crab. Bat, Alternate Bat, Deep Crab, Cypher
2. Gleichzeitige Suche nach Mustern auf Dutzenden von Handelsinstrumenten und auf allen klassischen Zeitskalen
3. Suche nach Mustern in allen
Delta Fusion Pro – Erweiterte Order-Flow-Analyse für den Intraday-Handel
Delta Fusion Pro ist ein professioneller Indikator für MetaTrader 4, der den aggressiven Orderfluss aufdeckt und die Intensität sowie die Richtung des institutionellen Drucks in Echtzeit anzeigt. Im Gegensatz zu herkömmlichen Volumenindikatoren analysiert er die Delta-Differenz zwischen Ask- und Bid-Volumen, um Umkehrungen vorherzusagen, Trends zu bestätigen und professionelle Interessenzonen zu identifizieren. Hauptmerkm
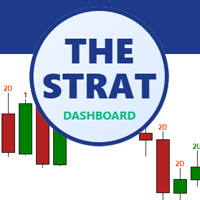
The Strat Dashboard – Multi-Symbol Pattern-Scanner für Rob Smiths Strat-Strategie
Verwandle Dein Trading mit Echtzeit Multi-Symbol Strat-Analyse
Das The Strat Dashboard ist ein leistungsstarker, professioneller Indikator, der speziell für Trader entwickelt wurde, die die renommierte „Strat“ Methodik von Rob Smith einsetzen. Überwache unbegrenzt viele Symbole über mehrere Zeitrahmen gleichzeitig, erkenne im Handumdrehen Setups mit hoher Wahrscheinlichkeit und verpasse kein handelbares Muster me

Royal Scalping Indicator ist ein fortschrittlicher, preisadaptiver Indikator, der entwickelt wurde, um hochwertige Handelssignale zu generieren. Die integrierten Multi-Timeframe- und Multi-Currency-Fähigkeiten machen es noch leistungsfähiger, Konfigurationen basierend auf verschiedenen Symbolen und Timeframes zu haben. Dieser Indikator ist sowohl für Scalp Trades als auch für Swing Trades perfekt geeignet. Royal Scalping ist nicht nur ein Indikator, sondern eine Handelsstrategie selbst. Merkmale
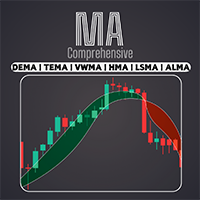
Greifen Sie mit unserem professionellen Comprehensive Moving Average -Indikator auf eine breite Palette gleitender Durchschnitte zu, darunter EMA, SMA, WMA und viele mehr. Passen Sie Ihre technische Analyse mit der perfekten Kombination von gleitenden Durchschnitten an Ihren individuellen Handelsstil an / MT5 Version
Merkmale
Möglichkeit, zwei MAs mit unterschiedlichen Einstellungen zu aktivieren. Möglichkeit zur Anpassung der Chart-Einstellungen. Möglichkeit, die Farbe der Candlesticks in Abh
FREE

Erleben Sie den Handel wie nie zuvor mit unserem beispiellosen Fair Value Gap MT4-Indikator (FVG).
als der beste seiner Klasse gefeiert. Dieser MQL5-Marktindikator geht über das Gewöhnliche hinaus,
Sie bieten Händlern ein unübertroffenes Maß an Genauigkeit und Einblick in die Marktdynamik. EA-Version: WH Fair Value Gap EA MT4
SMC-basierter Indikator: WH SMC Indicator MT4 Merkmale:
Erstklassige Fair-Value-Gap-Analyse. Unterstützung für mehrere Zeitrahmen. Anpassung. Echtzeitwarnungen. Ben
FREE
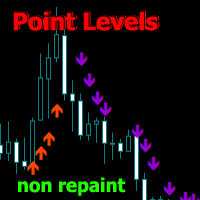
Point Directions – Ein Indikator, der Punktniveaus der Unterstützung und des Widerstands anzeigt, wenn sich der Preis bewegt. Die Pfeile zeigen Preissprünge in die angegebenen Richtungen.
Die Pfeile werden nicht neu gezeichnet, sondern auf der aktuellen Kerze geformt. Funktioniert für alle Zeitrahmen und Handelsinstrumente. Es gibt verschiedene Arten von Warnungen.
Verfügt über erweiterte Einstellungen zum Anpassen von Signalen für jedes Diagramm. Kann für den Handel mit Trends und Korrekturen
SL Curruncy-Impuls https://www.mql5.com/en/market/product/82593 SL Session Strength 28 Pair Flow dieser Intraday Asian London New York Sessions strength.SL Session Strength 28 Indikator am besten für Intraday Scalper. Markt starke Bewegung Zeit können Sie am besten Symbol zu fangen. weil Sie wissen, welche Währungen sind am besten zu diesem Zeitpunkt zu handeln. Kaufen Sie starke Währungen und verkaufen Sie schwache Währungen (divergierende Währungen). Empfohlene Zeitrahmen für den Handel: M5 -

Special offer : ALL TOOLS , just $35 each! New tools will be $30 for the first week or the first 3 purchases ! Trading Tools Channel on MQL5 : Join my MQL5 channel to update the latest news from me Wir stellen den revolutionären RSI Kernel Optimized with Scanner, ein hochmodernes Tool, das die traditionelle RSI-Analyse durch die Integration des leistungsstarken Kernel-Density-Estimation-Algorithmus (KDE) neu definiert. Dieser fortschrittliche Indikator bietet nicht nur Echtzeiteinb

Die Fair Value Gap (FVG) ist eine Preisspanne, in der auf einer Seite des Marktes Liquidität angeboten wird, was in der Regel durch eine Liquiditätslücke auf den Charts mit niedrigerem Zeitrahmen in derselben Preisspanne bestätigt wird. Der Preis kann eine "Lücke" bilden, um ein buchstäbliches Vakuum im Handel zu schaffen, was zu einer tatsächlichen Preislücke führt. Fair-Value-Lücken werden am häufigsten von Price-Action-Händlern verwendet, um Ineffizienzen oder Ungleichgewichte auf dem Markt z
FREE
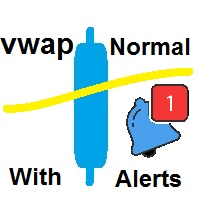
Dies ist ein einfacher VWAP, aber wir haben Benachrichtigungen eingebaut, die darüber informieren, wenn der Preis die VWAP-Linie erreicht oder durchbricht. Dieser Indikator ist ein traditioneller VWAP-Indikator für MetaTrader 4 (MT4). Die Standardeinstellungen entsprechen denen des normalen VWAP, aber Sie haben die Möglichkeit, die VWAP-Berechnung und das Beste daran zu ändern: Wenn der Preis die VWAP berührt oder durchbricht, werden Sie durch Alarme, Handybenachrichtigungen, E-Mails oder Tonsig
FREE
Der Indikator ermöglicht es Ihnen, den aktuellen Trend anhand der Farbe und der FIBO-Ebenen sofort zu bestimmen. Höhere Zeitrahmen das Panel zeigt den aktuellen Trend der höheren Perioden, helfen, die Stärke des Trends zu bestimmen. Handeln Sie mit dem Trend, wenn sich die Farbe der Kerzen ändert, oder handeln Sie gegen den Trend, wenn der Preis die extremen Niveaus des FIBO Trend PRO Indikators erreicht. Vorteile des FIBO Trend PRO
Der Indikator färbt sich nie neu und ändert seine Werte nicht

IX Power: Markteinblicke für Indizes, Rohstoffe, Kryptowährungen und Forex Überblick
IX Power ist ein vielseitiges Tool zur Analyse der Stärke von Indizes, Rohstoffen, Kryptowährungen und Forex-Symbolen. Während FX Power die höchste Präzision für Währungspaare bietet, indem es alle verfügbaren Paardaten einbezieht, konzentriert sich IX Power ausschließlich auf die Marktdaten des zugrunde liegenden Symbols. Dies macht IX Power zu einer hervorragenden Wahl für Nicht-Forex-Märkte und zu einem zuv

The official release price is $65 only for the first 10 copies, ( only 2 copies left ). Nächster Preis: $125 Gold Scalper System ist ein multifunktionales Handelssystem, das eine Ausbruchsstrategie für wichtige Liquiditätsniveaus mit Bestätigung und einem eingebauten Smart DOM Pro Modul für die Markttiefenanalyse kombiniert . Das System identifiziert Zonen für die Akkumulation von Limit-Orders, verfolgt die Aktivität auf Unterstützungs- und W

Der Indikator ist ein Handelssystem für den kurzfristigen Handel.
Scalper Assistant hilft, die Richtung der Transaktion zu bestimmen, und zeigt auch die Einstiegs- und Ausstiegspunkte an.
Der Indikator zeichnet zwei Linien (mögliche Punkte für die Eröffnung von Positionen).
Im Moment des Durchbruchs der oberen Linie nach oben (und wenn alle Handelsbedingungen erfüllt sind), erscheint ein Aufwärtspfeil (ein Kaufsignal), sowie 2 Ziele.
Im Moment des Durchbruchs der unteren Linie nach unten (und w

Candle Binary Scalper ist ein technisches Analyseprodukt für Devisen und binäre Optionen.
Enthält mehrere technische Indikatoren, die in einem Handelssystem zusammengefasst sind.
Geeignet für den manuellen Handel innerhalb eines Trends, für Scalping und binäre Optionen. Funktioniert für alle Zeitrahmen und Handelsinstrumente.
Empfohlene Zeitrahmen für den Handel M15, M30, H1 und H4, M5 und M1 sollten bei hoher Volatilität verwendet werden. Es gibt verschiedene Arten von Warnungen.
So verwenden

DERZEIT 20% RABATT!
Die beste Lösung für jeden Newbie oder Expert Trader!
Dieser Indikator ist ein erschwingliches Handelsinstrument, da wir eine Reihe von proprietären Funktionen zusammen mit einer neuen Formel integriert haben.
Der Advanced Accumulated Currency Volume Indicator ist spezialisiert auf die 28 wichtigsten Forex-Paare und funktioniert auf allen Zeitrahmen. Es handelt sich um eine neue Formel, die auf einem einzigen Chart das gesamte Währungsvolumen (C-Volumen) von AUD, CAD, CHF

Auf welchen Indikator schauen Sie bei Ihren MT4-Charts am häufigsten? Ich glaube nicht, dass die Standard-Gitterlinien auf MT4-Charts - die Sie wahrscheinlich hunderte oder tausende Male sehen - mit der Absicht entwickelt wurden, dem Benutzer zu helfen, zu gewinnen. Aus diesem Grund verwenden MT4-Benutzer verschiedene Indikatoren und gehen durch Versuch und Irrtum. Da es sich um ein Diagramm handelt, auf das Sie jeden Tag schauen, muss es zuverlässige Informationen liefern, die wir Menschen int

Special offer : ALL TOOLS , just $35 each! New tools will be $30 for the first week or the first 3 purchases ! Trading Tools Channel on MQL5 : Join my MQL5 channel to update the latest news from me Der Volumetrische Orderblock Multi Timeframe Indikator ist ein leistungsstarkes Werkzeug für Trader, die tiefere Einblicke in das Marktverhalten suchen, indem sie Schlüsselpreisbereiche identifizieren, in denen bedeutende Marktteilnehmer Aufträge ansammeln. Diese Bereiche, bekannt als vo
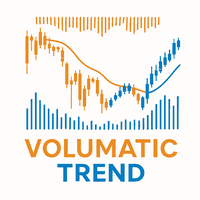
Volumatic Trend ist ein leistungsfähiger, trendfolgender Indikator, der Richtungsanalysen mit Echtzeit-Volumenverhalten verbindet. Durch die Kombination von adaptiver Trendlogik und Volumen-Overlays bietet er Händlern eine detaillierte Momentaufnahme der Marktüberzeugung und potenzieller Wendepunkte. Von der sofortigen Erkennung von Trendwechseln bis hin zu volumengewichteten Kerzendarstellungen bietet dieses Tool einen tieferen Kontext für die Preisbewegung. MT5-Version - https://www.mql5.com/e
FREE

BinaryIndicator ist ein hochpräziser Indikator für den Handel mit binären Optionen. Er zeigt hervorragende Ergebnisse beim Scalping. Dieser Indikator basiert auf einer multifaktoriellen Analyse von Trendindikatoren sowie Bestätigungsoszillatoren, was letztendlich zu einer erhöhten Genauigkeit der Signale führt.
Vorteile des Indikators Erhöhte Genauigkeit der Signale. Hervorragende Ergebnisse beim Handel mit binären Optionen mit einer kurzen Ablaufzeit von M30 bis M1 . Funktioniert auf jedem Zei
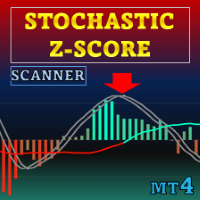
Sonderangebot : ALLE TOOLS , nur $35 pro Stück! Neue Tools kosten $30 in der ersten Woche oder für die ersten 3 Käufe ! Trading-Tools-Kanal auf MQL5 : Tritt meinem MQL5-Kanal bei, um die neuesten Nachrichten von mir zu erhalten Stochastic Z-Score ist ein Momentum-Oszillator, der den Preis mit einem Z-Score normalisiert, ihn per stochastischer Logik begrenzt und mit HMA glättet; ALMA liefert Langfristkontext. Optionale Elemente sind ein Histogramm, dynamische Bänder und Umkehr-Label
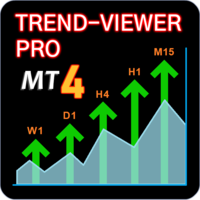
ERKENNEN SIE DEN TREND IN JEDEM ZEITRAHMEN. DER INTELLIGENTE INDIKATOR LIEST DIE PREISBEWEGUNG, UM ECHTE MARKTZYKLEN UND TRENDS ZU ERKENNEN. Dieser fortschrittliche Multi-Währungs- und Multi-Time-Frame-Indikator zeigt den Trend in Echtzeit an , sodass Sie immer die Trends der Märkte kennen, mit denen Sie handeln möchten.
Trend-Viewer Pro wurde speziell entwickelt, um den Trend für jeden Zeitrahmen und jeden Markt gleichzeitig zu erkennen. Das macht es für Sie viel einfacher, Märkte mit Zeitrahm

Hydra Trend Rider ist ein nicht nachzeichnender Trendindikator für mehrere Zeitrahmen, der präzise Kauf-/Verkaufssignale und Echtzeitwarnungen für Handels-Setups mit hoher Wahrscheinlichkeit liefert. Mit seiner farbkodierten Trendlinie, dem anpassbaren Dashboard und den mobilen Benachrichtigungen ist er perfekt für Händler, die Klarheit, Vertrauen und Konsistenz im Trendhandel suchen. Einrichtung & Anleitung: MT5-Version hier herunterladen . Um zu lernen, wie man den Indikator benutzt: Indikator
Speed Trend Matrix Ultimate (Version 5.10) Die Speed Trend Matrix (STM) ist ein umfassendes Handelssystem, das in einem einzigen Indikator gekapselt ist. Im Gegensatz zu Standardoszillatoren, die lediglich Überkauft- oder Überverkauft-Zustände anzeigen, analysiert der STM die „Geschwindigkeit“ der Preisbewegung im Verhältnis zur Marktvolatilität (ATR). Er identifiziert nicht nur die Trendrichtung, sondern auch die Stärke hinter der Bewegung und filtert Perioden geringer Dynamik (die „FlatZone“ )
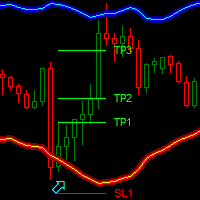
Dark Bands ist ein Indikator für den Intraday-Handel. Dieser Indikator basiert auf der Counter Trend Strategie, nutzt aber auch die Volatilität. Mit diesem Indikator können wir bei guten Preisen einsteigen, um die Umkehrungen des aktuellen Instruments zu verfolgen.
Wichtigste Vorteile
Leicht sichtbare Take-Profit/Stop-Loss-Linien Zuverlässige Bandlinien mit futuristischen Farben und intuitiven Richtungspfeilen Nützliche Statistiken , die die Gewinnrate der Signale anzeigen Plus-Paket verfügb
FREE

Support And Resistance Screener ist ein Level-Indikator für MetaTrader, der mehrere Tools innerhalb eines Indikators bietet. Die verfügbaren Werkzeuge sind: 1. Marktstruktur-Screener. 2. Bullische Pullback-Zone. 3. Bärische Pullback-Zone. 4. Tägliche Pivot-Punkte 5. wöchentliche Pivots-Punkte 6. monatliche Pivots-Punkte 7. Starke Unterstützung und Widerstand basierend auf harmonischem Muster und Volumen. 8. Zonen auf Bankebene. ZEITLICH BEGRENZTES ANGEBOT: HV Support and Resistance Indicator ist

ICT, SMC, SMART MONEY CONCEPTS, SMART MONEY, Smart Money Concept, Support and Resistance, Trend Analysis, Price Action, Market Structure, Order Blocks, BOS/CHoCH, Breaker Blocks , Momentum Shift, Supply&Demand Zone/Order Blocks , Strong Imbalance, HH/LL/HL/LH, Fair Value Gap, FVG, Premium & Discount Zones, Fibonacci Retracement, OTE, Buy Side Liquidity, Sell Side Liquidity, BSL/SSL Taken, Equal Highs & Lows, MTF Dashboard, Multiple Time Frame, BigBar, HTF OB, HTF Market Structure,
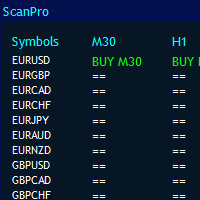
MT4 Universal Panel pro wurde für alle Indikatoren und Zeitrahmen entwickelt, einschließlich ex4-Dateien.
Es kann unbegrenzt Paare scannen, basierend auf der Leistung Ihres Computers und bis zu 10 Zeitrahmen. Die Größe des Panels wird automatisch angeordnet.
Sie können jeden Indikator durch Puffer aufrufen.
Es funktioniert für alle Standard- und benutzerdefinierten Indikatoren. Sie können es einfach für Heikan Ashi, Rsi, Parabolic, Renko, Fraktale, Unterstützungswiderstand, Angebotsnachfrag

Mein Indikator für den Intraday-Handel. SL Session Strength 28 Pair https://www.mql5.com/en/market/product/57585 Diese Strategie wird sogar von den Banken verwendet, um Gewinne zu erzielen. Sie nehmen eine starke Währung und setzen sie gegen eine schwache Währung. Mit diesem Indikator können Sie die versteckten Trends und Korrelationen zwischen den 8 am meisten gehandelten Währungen mit Hilfe eines einzigartigen Stärkemessers analysieren, der mehrere Charts in einem einzigen Fenster erstellt, d

ForexVitals Vital Trend Signals Ein trendfolgender Indikator, der klare Kauf-/Verkaufssignale ausgibt und Risikoniveaus direkt im Chart projiziert. Er wurde für Trader entwickelt, die einen sauberen visuellen Workflow möchten: Signal, Stop-Referenz, Zielprojektion und optionale On-Chart-Statistiken. Was du bekommst Kauf-/Verkaufspfeile im Chart, wenn die Trendbedingungen übereinstimmen Optionale TP/SL-Projektionslinien basierend auf der aktuellen Stop-Distanz und deinem TP_Ratio Optionales Dash
FREE

Entdecken Sie das Geheimnis des erfolgreichen Forex -Handels mit unserem benutzerdefinierten MT4 -Indikator!
Strategy with RangeBars https://youtu.be/jBaDCAPTtHc
Haben Sie sich jemals gefragt, wie Sie Erfolg auf dem Forex -Markt erzielen können und gleichzeitig Gewinne erzielen und gleichzeitig das Risiko minimieren können? Hier ist die Antwort, nach der Sie gesucht haben! Erlauben Sie uns, unseren proprietären MT4 -Indikator vorzustellen, der Ihren Handelsansatz revolutionieren wird.
Einzigart

Der Area of Interest (AOI)-Indikator ist ein leistungsfähiges Instrument, das Händlern hilft, wichtige Marktzonen zu identifizieren, in denen Preisreaktionen sehr wahrscheinlich sind. Dieser Indikator hebt insbesondere zwei kritische Zonen hervor: Verkäufer-AOI (Area of Interest) : Diese Zone stellt Bereiche dar, in denen Verkäufer wahrscheinlich in den Markt eintreten werden und oft als Widerstand wirken. Wenn sich der Kurs dieser Zone nähert oder sie berührt, signalisiert dies, dass ein poten
FREE

Der Währungsindex-Indikator ermöglicht es Händlern, einen beliebigen Index der acht wichtigsten Währungen anzuzeigen. Er verwendet eine spezielle Berechnung, die bestimmte Währungspaare und deren Gewichte berücksichtigt.
Die Standardgewichte basieren auf den Ergebnissen der dreijährlichen Zentralbankumfrage der BIZ. Dank dieses Vorteils kann der Händler die wahre Stärke und Schwäche jeder Währung erkennen.
Hinweis: Wenn der Indikator im Strategy Tester (Demoversion) verwendet wird, beachten S

Supply Demand Analyzer ist ein fortschrittlicher Handelsindikator, der sorgfältig für die präzise Identifizierung, Analyse und Verwaltung von Angebots- und Nachfragezonen entwickelt wurde. Durch die Integration von Echtzeitdaten und fortschrittlichen Algorithmen ermöglicht dieses Tool Händlern, Marktphasen, Preisbewegungen und strukturelle Muster mit unvergleichlicher Genauigkeit zu erkennen. Es vereinfacht die komplexe Marktdynamik in umsetzbare Erkenntnisse und ermöglicht es Händlern, das Mark

Auto Optimized RSI: Professionelle Marktanpassung Die meisten Trader scheitern, weil sie statische Werkzeuge in einem dynamischen Markt verwenden. Die Verwendung fester RSI-Level wie 70/30 auf jedem Chart ist ein mathematischer Fehler. Wenn Sie nach einem "magischen Pfeil" ohne Logik suchen, ist dieses Tool nicht für Sie geeignet. Dieses Werkzeug wurde für diejenigen entwickelt, die verstehen, dass Optimierung der einzige Schlüssel zum Überleben im Trading ist. Standard-Indikatoren berücksichtig
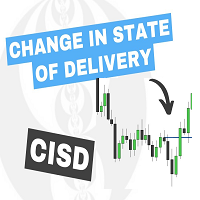
Der Indikator Change In State Of Delivery (CISD) erkennt und zeigt die Änderung des Lieferzustands an, ein Konzept, das sich auf die Marktstrukturen bezieht.
Der Benutzer kann zwischen zwei verschiedenen CISD-Erkennungsmethoden wählen. Außerdem gibt es verschiedene Filteroptionen, um weniger bedeutende CISDs herauszufiltern.
ANWENDUNG Abbildung 2 Ein Change in State of Delivery (CISD) ist ein Konzept, das eng mit Marktstrukturen verwandt ist, bei dem der Preis ein interessantes Niveau dur

Übersicht über das kostenlose, aber fortschrittliche Produkt Turbo Trend ist ein leistungsstarker Indikator, der Händlern hilft, Markttrends zu identifizieren und darauf zu reagieren. Er nutzt eine Kombination aus fortschrittlichen gleitenden Durchschnitten und Volumenanalyse, um klare Signale für die Trendrichtung zu liefern. Turbo Trend vereinfacht die Entscheidungsfindung, indem er Marktbedingungen in drei unterschiedliche Zustände unterteilt: Aufwärtstrend , Abwärtstrend und neutralen Trend
FREE

MT4-Erkennungsanzeige für Auftragsblöcke mit mehreren Zeitrahmen.
Eigenschaften
- Vollständig anpassbar auf dem Diagrammbedienfeld, bietet vollständige Interaktion.
- Verstecken und zeigen Sie das Bedienfeld, wo immer Sie möchten.
- Erkennen Sie OBs in mehreren Zeiträumen.
- Wählen Sie die anzuzeigende OB-Menge aus.
- Verschiedene OBs Benutzeroberfläche.
- Verschiedene Filter an OBs.
- OB-Näherungsalarm.
- ADR High- und Low-Leitungen.
- Benachrichtigungsdienst (Bildschirmwarnungen | P

Dieser Indikator identifiziert die beliebtesten Harmonic Patterns , die Marktumkehrpunkte vorhersagen. Diese harmonischen Muster sind Kursformationen, die sich auf dem Devisenmarkt ständig wiederholen und auf mögliche zukünftige Kursbewegungen hindeuten / Free MT5 Version
Darüber hinaus verfügt dieser Indikator über ein eingebautes Markteintrittssignal sowie über verschiedene Gewinnmitnahmen und Stop-Losses. Es ist zu beachten, dass der Harmonische Muster-Indikator zwar eigenständig Kauf-/Verk
FREE

Der Indikator zeigt das horizontale Volumenprofil im angegebenen Bereich (BOX) und das maximale Volumen (POC) an.
Produktmerkmale. 1. Sie können Ticks oder nur den Preis verwenden. 2. Adaptiver Rasterabstand (M1-MN). 3. Adaptiver Suchschritt für hohes Volumen (Median) abhängig von der Boxgröße. 4. Automatische Chamäleonfarbe für Rahmenlinien und Schaltflächen. 5. Mehrere Boxen, einfach zu erstellen und zu löschen. 6. 70 % Volumenbereich (in den Einstellungen aktivieren). 7. Es gibt eine Warnung

MT5 version | Owl Smart Levels Indikator | Owl Smart Levels-Strategie | FAQ
Der Fractals Indikator ist eines der Elemente der Handelsstrategie des Autors von Bill Williams . Es wird verwendet, um nach Preisumkehrpunkten auf dem Preisdiagramm und folglich nach Unterstützungs- und Widerstandsniveaus zu suchen. Der Full Fractals Indikator ist ein verbesserter Fractals, der im Toolkit fast aller Handelsterminals verfügbar ist. Der einzige Unterschied besteht darin, dass wir zum Erstellen ei
FREE
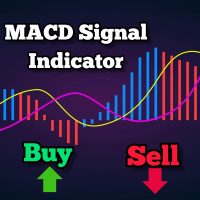
Dies ist ein Trendfolgeindikator basierend auf MACD, der Kaufsignale liefert, wenn über dem 200 MA und Verkaufssignale, wenn darunter. Das Signal wird generiert, wenn der MACD die Nulllinie kreuzt. Der Indikator zeigt auch ein Support- und Resistance-Level an, das als Stop-Loss verwendet werden kann. Einstellbare Parameter umfassen MA-Periode, MACD Fast EMA, Slow EMA und das Support-Resistance-Intervall. Es wird auf den niedrigsten und höchsten Punkten der aktuellen Kerzen dargestellt. Standardm
FREE

Die Average Daily Range zeigt die durchschnittliche Pip-Range eines Forex-Paares, gemessen über eine bestimmte Anzahl von Perioden. Händler können die ADR verwenden, um potenzielle Kursbewegungen außerhalb der durchschnittlichen täglichen Bewegung zu visualisieren. Wenn die ADR über dem Durchschnitt liegt, bedeutet dies, dass die tägliche Volatilität höher als üblich ist, was bedeutet, dass das Währungspaar möglicherweise über seine Norm hinausgeht.
Unser ADR-Analysator besteht aus 5 Hauptfunk
Ist Ihnen bekannt, warum der MetaTrader Market die beste Plattform für den Verkauf von Handelsstrategien und technischer Indikatoren ist? Der Entwickler braucht sich nicht mit Werbung, Programmschutz und Abrechnung mit Kunden zu beschäftigen. Alles ist bereits erledigt.
Sie verpassen Handelsmöglichkeiten:
- Freie Handelsapplikationen
- Über 8.000 Signale zum Kopieren
- Wirtschaftsnachrichten für die Lage an den Finanzmärkte
Registrierung
Einloggen
Wenn Sie kein Benutzerkonto haben, registrieren Sie sich
Erlauben Sie die Verwendung von Cookies, um sich auf der Website MQL5.com anzumelden.
Bitte aktivieren Sie die notwendige Einstellung in Ihrem Browser, da Sie sich sonst nicht einloggen können.