Technische Indikatoren für den MetaTrader 4 - 42
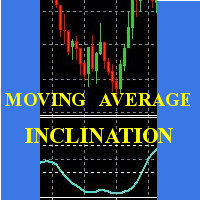
Scalp mit dem Verhalten eines kurzen gleitenden Durchschnitts, gibt der Indikator die Steigung und identifiziert die "hyper" Momente.
Operative Ratschläge:
M1-Chart verwenden. Periode 20 : Kaufen Sie nach zwei steigenden Tiefs; verkaufen Sie nach zwei maximalen Abwärtsbewegungen; vermeiden Sie gegenläufige Eröffnungen; wenn die Linie flach wird, setzen Sie einen Stopp beim Eröffnungskurs. Vermeiden Sie Aktionen in Zeitfenstern mit geringer Volatilität. Wenn die Kurve, die das Minimum / Maximu
FREE

Unterstützende Datei (1 von 2) für T3 Cloud MA
Trendindikator, abgeleitet aus gleitenden T3-Durchschnitten. Die Wolke wird durch eine schnelle T3- und eine langsame T3-Linie begrenzt. Kauf-/Verkaufsmöglichkeiten oberhalb/unterhalb der Wolke. Die schnellen und langsamen T3 MA-Linien können auch als dynamische Unterstützung/Widerstand für aggressivere Einstiege verwendet werden. Verwenden Sie die Standardwerte für die besten Einstellungen. Die Anzahl der Rückblick-Balken ist benutzerdefiniert. Di
FREE
WONNFX iSTATS - Informationsindikator, der Gewinn/Verlust auf Ihrem MT4-Konto anzeigt (Pips, Lots, Währung, Prozentsatz) aktueller Gewinn Gewinn für heute Gewinn für die laufende Woche Gewinn für den laufenden Monat Gewinn für das laufende Quartal Gewinn für das laufende Jahr
Ein praktisches Format für die Anzeige von Statistiken Ihres Handelskontos in Echtzeit. (der Indikator kann auf jedem MT4-Terminal-Chart installiert werden)
FREE

Von Tradingview konvertiertes Tool. Ein einfacher Indikator, der die Differenz zwischen 2 gleitenden Durchschnitten aufzeichnet und Konvergenz/Divergenz in einem farbkodierten Format darstellt.
Alles <= 0 ist rot und zeigt einen Abwärtstrend an, während > 0 grün ist und einen Aufwärtstrend anzeigt .
Stellen Sie die Eingabeparameter wie folgt für Ihren bevorzugten Zeitrahmen ein:
4-Std: Exponential, 15, 30
Täglich: Exponential, 10, 20
Wöchentlich: Exponential, 5, 10
FREE
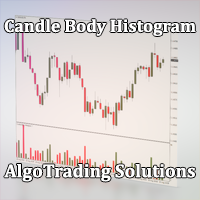
Indikator Kerze Körper Histogramm wird in einem separaten Fenster angezeigt und zeigt die Größe des Körpers jeder Kerze in Form eines Histogramms an. Je nachdem, ob die Kerze im Chart steigt oder fällt, ändert das Histogramm seine Farbe. Unregelmäßige Kerzen, die den gleichen Eröffnungs- und Schlusskurs haben, werden im Histogramm ebenfalls in einer anderen Farbe angezeigt. Da der Indikator auf dem Nullwert aufbaut, können Sie die Kerzenkörper visuell miteinander vergleichen. Sie können Ebenen a
FREE

A. Dieser Pivot-Indikator zeigt die Tage des Pivot-Preises an.
B. Sie zeigt auch den Widerstand R0.5, R1, R1.5, R2, R2.5 und R3
Es zeigt auch die Unterstützung S0.5, S1, S1.5, S2, S2.5 und S3
EINGANG:
Unter Eingabe sehen Sie 3 Variablen
1.ExtFomula. Hier können Sie Ihren bevorzugten Ausgang bei einem Widerstand oder einer Unterstützung im Diagrammfenster auf höchstens 1 oder 2 oder 3 einstellen. 1 steht für einen Austritt am Widerstand oder Träger 1. 2 steht für einen Austritt am Widerstand
FREE
Dieser Indikator hilft Ihnen, Symbole zu scannen , die sich im Marktbeobachtungsfenster befinden (in der Demo max. 15 Symbole) und Trends mit Warnungen herauszufiltern. Er basiert auf dem beliebtesten Indikator "Bollinger Bands" , der von vielen Händlern für den Handel verwendet wird: Wenn die Farbe der Box auf "Grün " oder "Rot " wechselt, weist sie Sie auf einen Trendwechsel hin, der einen Long- oder Short-Einstieg ermöglicht. Außerdem werden Sie auf dem Bildschirm benachrichtigt. Wenn die Far
FREE
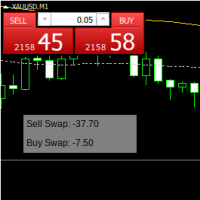
howSwap ist ein einfacher Indikator. zeigt SWAP auf der Instrumentenkarte für dieses Instrument an. Sie können die Magic angeben, wenn 0, dann alle. sowie die Koordinaten des Indikatorfelds auf der Grafik. Beim Devisenhandel können SWAPs je nach Zinsdifferenz zwischen den beiden am Handel beteiligten Währungen entweder positiv oder negativ sein. Händler können SWAPs entweder erhalten oder bezahlen, je nachdem, ob sie eine Position über einen bestimmten Zeitpunkt hinaus (normalerweise am Ende des
FREE
Werden Sie ein konstant profitabler 5-Sterne-Forex-Händler!
Wir bieten Ihnen einige Indikatoren, die Sie dabei unterstützen, den Markt zu verstehen und zu analysieren! Mit unseren Strategien werden Sie Ihr Handelssystem verbessern und zu einem Experten werden...
Wir haben Indikatoren für die Trendrichtung, die Marktrichtung und andere... für mehrere Zeitrahmen und die alle Majors oder Ihre bevorzugten Handelssymbole abdecken! Einige von ihnen bieten anpassbare Berechnungsparameter... oder Gra
FREE
Ich habe diesen kostenlosen Indikator erstellt, um Ihnen zu helfen, Ihren BUY / SELL Average und BEP Level in Ihrem Chart darzustellen. Ziehen Sie ihn einfach auf Ihr Diagramm, und Sie können das Niveau sehen und Ihren Handel besser planen. Es ist nützlich, wenn Sie eine Durchschnittsposition oder sogar eine Absicherungsposition haben, so dass Sie Ihren Handel besser planen können und nicht erneut manuell berechnen müssen. Verwenden Sie es kostenlos, und bitte hinterlassen Sie einen Kommentar, w
FREE

Ich war auf der Suche nach einem mageren Symbolwechsler. Ich konnte keinen finden. Normalerweise verbergen andere Produkte viel Platz auf dem Bildschirm. Also habe ich einen sehr schlanken Symbolwechsler entwickelt Klicken Sie einfach auf die 2 Währungen, die Sie kombinieren möchten. Die Reihenfolge spielt keine Rolle. Wenn Sie einige Paare vermissen, können Sie bis zu 5 eigene Symbole hinzufügen. Bitte stellen Sie sicher, dass Ihr Broker Ihre eigenen Symbole unterstützt. Ziehen Sie das Panel mi
FREE

Dieser Indikator ist ein Histogramm, das den Trend auf der Grundlage von 3 verschiedenen gleitenden Durchschnitten anzeigt. Wenn alle Durchschnitte in aufsteigender Reihenfolge eingestellt sind, ist der Indikator grün, wenn sie in absteigender Reihenfolge sind, ist er rot. Wenn die Durchschnitte keinen Trend zeigen, ist die Farbe gelb. Außerdem kann jeder Durchschnitt unterschiedliche Einstellungen haben, z. B. Modus-MA und Preis-MA. Sie können auch einen Alarm einstellen und Benachrichtigungen
FREE
The MA in Color_PRT Indicator offers valuable insights into market trends by displaying moving averages in different colors based on their direction. Green indicates an uptrend, red for a downtrend, and yellow for a consolidation phase. Traders can use this indicator to easily identify potential entry and exit points in their forex trades. When the lines change color, it can signal a change in market direction, giving traders an opportunity to adjust their strategy accordingly. Additionally, th
FREE

Der Indikator zeigt auf dem Diagramm eine Karte an, auf der Marker die aktuelle Handelssitzung anzeigen, sowie einen Text. Der Indikator bietet zwei Arten der Hintergrundanzeige: weiß und schwarz. Der Indikator wird als Hintergrund angezeigt und behindert nicht die Verfolgung der aktuellen Marktsituation.
Parameter: GMT - die Zeitdifferenz zwischen dem Terminal und GMT. Hintergrund - Auswahl des Hintergrunds - schwarz oder weiß.
FREE

Session Average Date Range: Analysieren Sie die Höchst- und Tiefstwerte bestimmter Handelssitzungen innerhalb benutzerdefinierter Datumsbereiche und bilden Sie den Durchschnitt. So erhalten Sie Einblicke in die Kursbewegungen und das Marktverhalten in ausgewählten Zeiträumen. Das Tool "Session Average Date Range" ist ein fortschrittliches Analysetool, das Händlern und Analysten die Möglichkeit bietet, die Höchst- und Tiefstwerte bestimmter Handelssitzungen innerhalb eines benutzerdefinierten Dat
FREE

Der Fractal Divergence Channel basiert auf den fraktalen Divergenzmustern und stellt diese in Form eines Kanals dar, dessen Grenzen sich ändern, sobald das nächste Muster erscheint. Die obere Grenze des Kanals entspricht dem oberen Teil des zuletzt gefundenen bärischen fraktalen Divergenzmusters. Der untere Rand des Kanals ist der untere Teil des zuletzt gefundenen bullischen Musters (siehe Screenshot 1). Im Vergleich zum FractalDivergence_Patterns-Indikator hat die Channel-Version die gleichen
FREE

Dieser Indikator bildet den Preisübergang mit dem einfachen gleitenden Durchschnitt (SMA) für jede Kerze ab. Funktioniert wie ein SMA, hat aber die Eigenschaft, sich nicht neu zu malen. Wie zu verwenden: Wie bereits erwähnt, funktioniert dieser Indikator wie ein SMA. Verwenden Sie ihn, um den Trend zu bestimmen. Wenn der Kurs über dieser Linie liegt, wird ein Aufwärtstrend erwartet (ein Abwärtstrend, wenn der Kurs unter dieser Linie liegt). 2 dieser Indikatoren (mit unterschiedlichen Perioden) k
FREE

Dies ist ein unverzichtbares Tool für jeden Trader, denn dieser Indikator versorgt das Scoreboard mit den wichtigsten Basisinformationen für den Handel. Er zeigt die aktuelle Serverzeit, die verbleibende Zeit des aktuellen Balkens, ein berechnetes Lot für das angegebene Risiko und die freie Marge, charakteristische Balkengrößen und Spreads an. Wenn der Indikator auf einem Chart platziert wird, erzeugt er ein Textlabel in der oberen rechten Ecke mit den folgenden Informationen: -17:50 [70%] 11:42
FREE

RCCMA ist ein allgemeiner gleitender Durchschnittsindikator, der mit ReviewCandleChart funktioniert. Das Original ist "Custom Moving Average", bereitgestellt von MetaQuotes Software Corp. Basierend auf diesem Quellcode, habe ich ReviewCandleChart angepasst.
Vorteile Wenn ReviewCandleChart eingeschaltet ist, wird rechts von der vertikalen Referenzlinie keine Linie angezeigt. Wenn ReviewCandleChart eingeschaltet ist und Sie eine Taste wie "Z" oder "X" drücken, wird die MA gezeichnet. Wenn ReviewC
FREE
Der MAS-Indikator kann für alle Währungspaare und jeden Zeitrahmen verwendet werden, er eignet sich für jede Handelsgeschwindigkeit. Darüber hinaus ist es relativ einfach, mit dem MAS-Indikator zu handeln. Dieser Indikator erzeugt zwei Signale: KAUF-Signal: Pfeil tief himmelblau VERKAUFSSIGNAL: roter Pfeil
Parameter des Indikators MA-Methode - Typ des gleitenden Durchschnitts MA Shift - Verschiebung des gleitenden Durchschnitts Schnell - gleitender Durchschnitt mit schneller Periode Langsam - g
FREE
Dieser Indikator vereinfacht die Erstellung von Chartvorlagen, indem er es Ihnen ermöglicht, die aktuellen Charteinstellungen mit nur einem Klick auf eine Schaltfläche in einer Vorlage zu speichern. Der Indikator fügt eine Schaltfläche direkt in das Diagramm ein, die automatisch die Vorlage mit einem bestimmten Namen und Präfix speichert, was die Organisation und Verwendung von Vorlagen erleichtert.
Die Hauptfunktionen des Indikators sind:
Erstellung einer Vorlage des aktuellen Charts mit ein
FREE

FIBO DASHBOARD Dieses Dashboard listet die Fibonacci-Levels mehrerer Währungen auf, sobald der Kurs das Level erreicht. Es zeichnet ein Fibonacci-Retracement auf Basis des täglichen Zeitrahmens. Es zeichnet Pfeile und sendet Pop-up-Warnungen, wenn der Kurs die Fibonacci-Levels überschreitet. Dieses Tool ist nützlich für Benutzer, die mit Fibonacci handeln. Für die kostenpflichtige Version klicken Sie hier .
EINGABE ON Alert: Wenn diese Option auf true gesetzt wird, erscheint ein Pop-up-Alarm, s
FREE
Binary Options Assistant (BOA) FLAME Signals Indicator liefert Signale, die auf der Kombination von: RSI, MACD & Stochastik-Indikatoren
Verpassen Sie keine Trades mehr, springen Sie nicht mehr von Chart zu Chart auf der Suche nach Handels-Setups und erhalten Sie alle Signale auf 1 Chart! Verwenden Sie jeden der BOA Signals Indikatoren mit dem Binary Options Assistant (BOA) Multi Currency Dashboard .
Alle Einstellungen des BOA Signalindikators sind anpassbar, um Ihnen mehr Strategiekombinatio
FREE

Der Velvet RSI-Indikator ist für die Verwendung mit dem fortgeschrittenen Velvet-Ordering-Layer vorgesehen. Es handelt sich um eine modifizierte Version des RSI-Indikators von Metaquotes, und alle von ihm angezeigten Daten sind genau und verifiziert, wenn sie vom Order-Layer erkannt werden. Um mit dem Velvet RSI-Indikator Orders zu platzieren, muss der Order-Layer installiert sein und laufen. Um mit dem Velvet RSI-Indikator Orders zu platzieren, muss der Velvet-Ordering-Layer (hier zu finden ),
FREE

Unterstützende Datei (2 von 2) für T3 Cloud MA
Trendindikator, abgeleitet aus gleitenden T3-Durchschnitten. Die Wolke wird durch eine schnelle T3- und eine langsame T3-Linie begrenzt. Kauf-/Verkaufsmöglichkeiten oberhalb/unterhalb der Wolke. Die schnellen und langsamen T3 MA-Linien können auch als dynamische Unterstützung/Widerstand für aggressivere Einstiege verwendet werden. Verwenden Sie die Standardwerte für die besten Einstellungen. Die Anzahl der Rückblick-Balken ist benutzerdefiniert. Di
FREE

RaysFX Markttrend-Histogramm Das RaysFX Markttrend-Histogramm ist ein maßgeschneiderter Indikator für die MetaTrader 4 Handelsplattform, der den Commodity Channel Index (CCI) nutzt, um Markttrends zu identifizieren und diese Informationen in einem intuitiven Histogramm darzustellen. Hauptmerkmale: Trenderkennung: Der Indikator berechnet den CCI für jede Zeitperiode und verwendet ihn, um festzustellen, ob sich der Markt in einem Aufwärts- oder Abwärtstrend befindet. Intuitive Visualisierung: Das
FREE

Der Indikator ermöglicht Ihnen den Handel mit binären Optionen. Der empfohlene Zeitrahmen ist М1 und die Verfallszeit ist 1 Minute. Der Indikator ist für den automatischen und manuellen Handel geeignet. Ein mögliches Signal wird als ein Pfeil über/unter einer Kerze angegeben. Sie sollten warten, bis die Kerze geschlossen ist! Die Pfeile werden nicht neu gezeichnet Handelssitzungen: Londoner und New Yorker Abschnitt Währungspaare: EUR/GRB Arbeits-Zeitrahmen: M1 Verfallszeit: 1 Minute Der Indikat
FREE
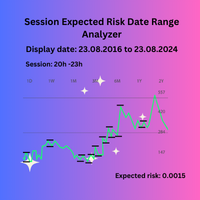
Session Expected Risk Date Range Analyzer: Analysiert Kursdaten über bestimmte Datumsbereiche, um detaillierte Einblicke in das finanzielle Risiko und die Volatilität zu erhalten, wobei die Kursmetriken jedes Balkens für eine genaue Risikobewertung verwendet werden.
Der Session Expected Risk Date Range Analyzer ist ein hochentwickeltes Tool, das Händlern und Analysten detaillierte Einblicke in das erwartete finanzielle Risiko über bestimmte Datumsbereiche hinweg bietet. Im Gegensatz zur tradit
FREE

Der Indikator ist so implementiert, dass er den klassischen Kursbewegungskanal bestimmt, der an den großen Börsen verwendet wird. Er wird nicht neu gezeichnet Das blaue Niveau ist ein Unterstützungsniveau Das rote Niveau ist ein Widerstandsniveau Die weiße Ebene ist eine Pivot-Ebene. Einstellungen Periode_SEC - Geben Sie den Periodenwert ein. Hinweis: Der Indikator definiert Levels nur bei fünfstelligen Kursen! Handelsmethode: Die Eröffnung von Positionen erfolgt von den Niveaus aus, genau auf i
FREE

TUMA MT4 Light Indikator Ein einfacher und bequemer Indikator zur Verfolgung der Kreuzung von zwei gleitenden Durchschnitten (EMA).
Eine leichtgewichtige Schnittstelle direkt auf dem Chart ermöglicht es Ihnen, die Perioden der beiden MAs schnell zu ändern, ohne das Einstellungsfenster zu öffnen. Hauptmerkmale: Anzeige von zwei EMAs auf dem Chart. Einfache Bearbeitung der Parameter direkt im Chart. Signalpfeile, wenn sich die MAs kreuzen: KAUFEN (grüner Pfeil nach oben) VERKAUFEN (rote
FREE
TradingDesk Demo - Leistungsanalyse MT4 Dies ist eine Demo-Version des TradingDesk-Indikators, die nur den EURUSD anzeigt. Die Vollversion finden Sie hier: https://www.mql5.com/en/market/product/40189
TradingDesk analysiert die historischen Daten des MetaTrader 4 nach Symbol, Magic Number, Trade oder Kommentar. Alle diese Auswertungen werden in Echtzeit in Ihrem MetaTrader 4 Chartfenster angezeigt.
Alle diese Informationen werden in den folgenden Dashboards angezeigt: Kontoinfo Allgemeine Inf
FREE

Ein einfacher Indikator, der die Größe des Spreads zum aktuellen Zeitpunkt, das Maximum für den Tag und das Maximum für die gesamte Laufzeit des Indikators anzeigt.
Es wird auch eine Tagesstatistik des maximalen Spreads angezeigt, die den Zeitpunkt angibt, zu dem dieser Spread festgelegt wurde.
Die Stelle, an der die empfangenen Informationen angezeigt werden, kann je nach Wunsch geändert und an einer beliebigen Stelle des Bildschirms positioniert werden.
Es besteht die Möglichkeit, Warnunge
FREE
Es ist der einfachste Indikator, den es gibt. Er hat nur eine einzige Funktion: die Anzeige der seit dem Ende der letzten Minute verstrichenen Sekunden auf sehr bequeme Weise, mit einem Etikett, das im Chart verschoben werden kann, so dass der Händler sein Auge nicht von der sich bildenden Kerze nehmen muss. Er wird auf M1, aber auch in größeren Intervallen verwendet, wenn man daran interessiert ist, Positionen zum besten Zeitpunkt zu eröffnen oder zu schließen. Manchmal gibt eine intensive Bew
FREE
Der ARR-Indikator ist dem ATR-Indikator ähnlich, gibt aber die prozentuale Spanne im Verhältnis zum Eröffnungskurs des jeweiligen Balkens an. Er ist vor allem für Kryptowährungssymbole nützlich, bei denen ATR-Bereiche von vor Jahren nicht direkt mit aktuellen Werten verglichen werden können. Der erste Puffer (rote gepunktete Linie) stellt die prozentuale Spanne eines einzelnen Balkens dar und der zweite Puffer (weiße durchgezogene Linie) stellt den einfachen Durchschnitt der festgelegten Anzahl
FREE

Gleitender Indikator. Er ist so geschrieben, dass er keine Signale gibt, wenn sich zwei gleitende Durchschnitte kreuzen. Er ist einfach zu bedienen und hat sich bei europäischen und asiatischen Währungen bewährt. Er ist für den langfristigen und mittelfristigen Handel konzipiert. Indikator für gleitende Durchschnitte. Er ist so geschrieben, dass er ein Signal gibt, wenn sich zwei gleitende Durchschnitte kreuzen. Einfache Bedienung, gute Performance bei europäischen und asiatischen Währungen, für
FREE
Der Velvet MACD ist für die Verwendung mit dem erweiterten Velvet-Ordering-Layer vorgesehen. Es handelt sich um eine modifizierte Version des MACD-Indikators von Metaquotes, und alle von ihm angezeigten Daten sind genau und verifiziert, wenn sie vom Ordering-Layer erkannt werden. Um mit dem Velvet MACD-Indikator Orders zu platzieren, muss der Ordering-Layer installiert sein und ausgeführt werden. Um mit dem Velvet MACD-Indikator Orders zu platzieren, muss der Velvet-Ordering-Layer (zu finden hie
FREE
Hallo zusammen, meine Freunde, meine Freunde. Ich bin ein Händler, 20 Jahre Erfahrung. Ich möchte meinen Indikator demonstrieren. Der Indikator ist auf der Grundlage der engen Zusammenarbeit mit arrows_template Indikator erstellt. Dieser Indikator zeichnet AO (Awesom) Indikator auf dem Chart des Instruments (beliebig) oben. Sie können die AO selbst auf dem Chart sehen. Sehen Sie die Durchquerung der Nullzone, Untertasse und so weiter. Wenn es Hinweise, Berichtigungen werden. Schreiben Sie fett,
FREE

Chart Control ist ein Indikator, mit dem Sie schnell und bequem den Zeitrahmen und den Vermögenswert des Charts ändern können, so dass Sie alle Ihre Analysen auf nur einem Chart durchführen können, ohne mehrere öffnen zu müssen. Sie können auch zwischen hellen und dunklen Themen wählen, je nach Ihren Vorlieben.
MT5: https: // www.mql5.com/pt/market/product/109444
FREE

Langsamer T3 MA Trendindikator, der von gleitenden T3-Durchschnitten abgeleitet ist. Dieser Indikator ist Teil des T3 Cloud MA Indikators und wird hier als eigenständiger Indikator veröffentlicht. Kauf-/Verkaufsmöglichkeiten oberhalb/unterhalb der Linie. Die MA-Linie kann auch als dynamische Unterstützung/Widerstand für aggressivere Einstiege verwendet werden. Verwenden Sie die Standardwerte für die besten Einstellungen. Die Anzahl der Rückblick-Balken ist benutzerdefiniert. Dieser Indikator ka
FREE

(Google Übersetzer) Dieser Indikator wurde von John Welles Wilders Average True Range (ATR) inspiriert, jedoch mit einigen zusätzlichen Informationen. Auf ähnliche Weise wird der exponentielle gleitende Durchschnitt der wahren Spannweite berechnet, jedoch unter Verwendung der Standard-Alpha-Gewichtung anstelle von Wilders . Es berechnet auch die durchschnittliche Abweichung des Bereichsdurchschnitts und zeigt sie als Offset an. Dies hilft nicht nur, eine Änderung schneller zu erkennen, sondern a
FREE

Haben Sie sich jemals gefragt, wie hoch der XAU/XAG-Kurs ist oder wie der chinesische Yuan gegenüber dem russischen Rubel gehandelt wird? Dieser Indikator gibt Ihnen die Antworten. Er zeigt einen Kreuzkurs zwischen dem aktuellen Chart-Symbol und einem anderen, in den Parametern angegebenen Symbol an. Beide Symbole müssen eine gemeinsame Währung haben. Im Falle von XAUUSD und XAGUSD oder USDRUB und USDCHN ist beispielsweise der USD die gemeinsame Währung. Der Indikator versucht, den gemeinsamen T
FREE

Binäre Optionen Tester Trading-Panel, um Ihre Strategien nach den Regeln der binären Optionen zu testen. Umfang: Legen Sie den Prozentsatz der Gewinn aus der Transaktion. Legen Sie die Ablaufzeit in Sekunden. Legen Sie die Wette GrößeSetzen Sie den Einzahlungsbetrag. Machen Sie mehrere Geschäfte in einer Reihe. Behalten Sie den Überblick über die Zeit vor Ablauf. Die Tick-Chart mit Handel Ebenen wird auf ein zusätzliches Fenster für die Genauigkeit dupliziert. Es ermöglicht Ihnen, sowohl in der
FREE

Dieser Indikator hilft dem Händler, die endgültige Entscheidung zu treffen. Wenn Sie sich bereits entschieden haben, in welche Richtung sich der Preis entwickeln wird, bleibt es so genau wie möglich, die Umkehrung selbst zu bestimmen. Diese Aufgabe übernimmt der Konkov-Indikator. Der Indikator wird auf M1- und M5-Charts installiert. Parameter des Indikators: für M1-Chart zeit_rahmen1 5 zeit_rahmen2 5 zeit_rahmen3 5 zeit_rahmen4 1 EMA_Zeitrahmen 0 MACD_Zeitrahmen 0 Stochastik_Zeitrahmen 0 für M5-
FREE

Beim Handel geht es darum, auf den richtigen Zeitpunkt zu warten. Dieser Indikator wurde erstellt, um zu wissen, was auf unseren Charts passiert, ohne den Bildschirm mit Indikatoren abdecken zu müssen. Darüber hinaus hat es mehrere Arten von Warnungen, die es uns ermöglichen, unsere Zeit anderen Dingen zu widmen, bis etwas Interessantes passiert. Sie können mehrere Alarme gleichzeitig verwenden. Das ist kein Problem. Standardmäßig bietet uns AlterAlert Warnungen, wenn uns die folgenden Indikato
FREE

Shadow Height mt4 Schattenanzeige.
Zeigt die Größe der Kerzenschatten in Punkten als Histogramm an. Funktioniert in drei Modi, vom Benutzer wählbar. Beschreibung der Anzeigeeinstellungen Modus - Betriebsmodi des Indikators, drei Modi: erste Höhe - Anzeigemodus der oberen und unteren Kerzenschatten; zweiter Unterschied - der Modus der Anzeige des Unterschieds in den Kerzenschatten, der Unterschied zwischen den oberen und unteren Kerzenschatten; die dritte Überlegenheit ist die kumulierte Differ
FREE

Tibors Timer - Indikator zur Übersicht und Klarheit im Chart
Dieser Indikator wurde von mir geschrieben, da ich oftmals die wichtigsten Informationen während eines Trades bzw. im Chart mühevoll suchen musste. Bitte täglich neu in den Chart ziehen. Er zeigt folgendes an: - Akuteller Kurs - Aktuelles Handelspaar - Die Zeiteinheit - Die Restzeit zur nächsten Kerzenbildung - Die Nummer des Handelskontos - Die Frei Verfügbare Margin - Margin auf 1 Lot - Der Aktuelle Hebel - Der Aktuelle Spprea
FREE

UniversalFiboChannel ist ein universeller Indikator, der einen Handelskanal gemäß den Fibonacci-Levels bildet. Dieser Indikator ist eine vollwertige Channel-Handelsstrategie. Der Indikator wird auf die übliche Weise installiert und funktioniert mit jedem Trading-Tool. Optionen HelpBasisTF = "M: 43200; W: 10080; D1: 1440; H4: 240; H1: 60" ist ein Hinweis auf den Parameter BasisTF
BasisTF = 1440 - Basisperiode für die Berechnung der Fibonacci-Levels DisplayDecimals = 5 - die Anzahl der Dezimalst
FREE
RangePower Index ist ein MT4-Indikator, der die Stärke von Währungen, Indizes, Gold und Öl auf der Grundlage ihrer täglichen Schwankungsbreite genau misst. So wissen Sie sofort, welche Vermögenswerte eine echte Dynamik haben und welche im Gegenteil an Stärke verlieren.
Tägliche Analyse der Kursspanne (Hoch-Tief) für Währungen, Indizes, Gold und Öl Schnelle Visualisierung der stärksten und schwächsten Werte Mit RangePower Index verschaffen Sie sich einen klaren Wettbewerbsvorteil - handeln
FREE

Dieser Indikator warnt Sie, wenn die vom Indikator erstellten Linien vom Kurs "berührt" werden, Sie können das Intervall zwischen den Alarmen ändern. Sie können die Farben und Stile der Linien nach Belieben ändern. Die Linien müssen jedoch als "Upper" und "Lower" bezeichnet werden.
Es gibt eine leistungsfähigere PRO-Version .
Eingabeparameter WaitTime: Intervall zwischen den Alarmen.
Verwendung Platzieren Sie die Linien dort, wo Sie Alarme hinzufügen möchten.
FREE

Die Differenz zwischen dem arithmetischen und dem geometrischen Mittelwert im angegebenen Bereich. Je größer die Differenz zwischen den Werten ist, desto größer ist der resultierende Wert, d.h. der Indikator weist Volatilitätsschwankungen auf. The arithmetic mean of a certain number of values is the sum of the values divided by their number. Das geometrische Mittel ist die Wurzel aus der Potenz der Anzahl der Werte, die aus dem Produkt dieser Werte gezogen wird. Wenn alle Werte gleich sind,
FREE
Kaufen Sie einen Kaffee für Yuniesky Carralero Cuellar
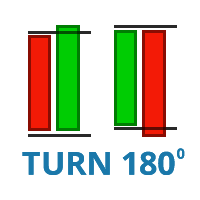
Dieser Indikator zeichnet das RED - GREEN und GREEN - RED Candlestick-Muster, die grünen Kerzen, die über ihrer vorherigen roten Kerze schließen, und die roten Kerzen, die unter ihrer vorherigen grünen Kerze schließen. h ttps:// www.youtube.com/shorts/MdJvatl_mng Eingabe-Parameter 1. ROT - GRÜN: Zeichnet die grünen Kerzen, die über der vorhergehenden roten Kerze schließen. 2. GRÜN - ROT: Zeichnen Sie die roten Kerzen, die unter ihrer vorhe
FREE
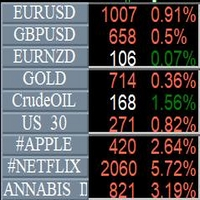
Info Symbol ist ein Indikator, mit dem Sie bis zu 9 verschiedene Märkte überwachen können. Geben Sie einfach den Namen der Symbole und die Anzahl der Dezimalstellen ein. Mit einem einzigen Klick können Sie von einem Markt zum anderen wechseln, bei einem Chart mit einem Experten sind zwei Klicks erforderlich. Mit diesem Indikator wissen Sie, wie viele Punkte oder Pips die überwachten Märkte seit Tagesbeginn gewonnen oder verloren haben, und Sie erhalten auch den Prozentsatz.
FREE

Dies ist ein Standard-Bollinger-Band-Indikator. Ich habe ein schnelles Bedienfeld in der unteren linken Ecke für ihn hinzugefügt. Wenn mehrere verschiedene Parameter dieses Indikators gleichzeitig aktiviert sind, kann das Bedienfeld schnell zwischen verschiedenen Parametern des Indikators wechseln, was die gleichzeitige Beobachtung mehrerer Indikatoren erleichtert. Zum Beispiel ist es möglich, schnell zwischen Beobachtungen zu wechseln, während man eine Periode von 20 und eine Periode von 30 kom
FREE

Dieser Indikator ist sowohl für Anfänger als auch für Profis geeignet. Dieser Indikator wird Ihnen helfen: die Anzahl der Fehler beim Eröffnen von Aufträgen zu reduzieren; die Kursentwicklung vorherzusagen (in Abwesenheit von wichtigen Nachrichten); profitable Trades nicht vorzeitig zu schließen und den Gewinn zu erhöhen; nicht voreilig in den Markt einzusteigen und auf "leichte Beute" zu warten: und die Rentabilität des Handels zu erhöhen. BUY- und SELL-Signale, ALARM und PUSH - https://www.mq
FREE
Future WPR - oder Backward WPR - ist eine spezielle Modifikation des WPR: Er verwendet die Standardformel, wendet sie aber in umgekehrter Richtung an. Der Indikator berechnet den WPR von rechts nach links, d.h. von der Zukunft zur Vergangenheit. Er "kennt" und verwendet die zukünftigen Kursbewegungen bei jedem Balken, bei dem die Geschichte auf der rechten Seite eine ausreichende Anzahl von "kommenden" Balken bietet, d.h. Balken einer Periode oder mehr. Zur Veranschaulichung ist auch die konvent
FREE

Nicht jeder kann einen Indikator schreiben. Aber jeder kann eine Idee haben. Der Indikator Universal Main Window Free , der als Eingabeparameter die Formel benötigt, nach der die Indikatorlinie gezeichnet werden soll, wird Ihnen bei der Umsetzung helfen. Dieser Indikator ist für die Verwendung im Hauptfenster des Charts vorgesehen.
Alle Indikatoren der Serie Universal :
Hauptfenster Separates Fenster Kostenlos MT4 Universal Hauptfenster Frei MT5 Universelles Hauptfenster Free MT5 MT4 Universal
FREE
MAs COMBO – Entdecken Sie einen einfachen, aber leistungsstarken Indikator für gleitende Durchschnitte in MT4!
Dieser benutzerdefinierte Indikator basiert auf einer intelligenten Kombination einfacher gleitender Durchschnitte – ideal, um mit minimalem Aufwand Trading-Setups mit hoher Erfolgswahrscheinlichkeit zu identifizieren.
Selbst Trading-Neulinge erkennen dank der einfachen Logik dieses Indikators schnell klare und profitable Handelssignale. Die Mustererkennung ist so intuitiv, dass sowo
FREE

Mein Konto Maklerdetails Dieser Indikator zeigt die Kontodaten und die Bedingungen des Brokers in Bezug auf seinen Betrieb an. Zum Beispiel den Namen des Brokers, die Kontonummer, den finanziellen Hebel, die Kontowährung, die automatische Handelsgenehmigung, das minimale Lot, den Lotschritt, die maximale Anzahl der Lots, den Margin Call, den Stop Out und viele andere wichtige Daten. Es ist einfacher, solche Daten mit einem Mausklick auf dem Chart anzuzeigen, als sie im Vertrag zu suchen oder den
FREE

Dieser Indikator mildert den Wert des RSI (Relative Strength Index) ab und reduziert seine Volatilität. Sie können diesen Indikator in Ihren Expert Advisors, Indikatoren und Strategien verwenden. Mit diesem Indikator müssen Sie nicht zwei Indikatoren gleichzeitig auf dem Chart haben. Zum Beispiel einen RSI-Indikator und einen Indikator für den gleitenden Durchschnitt. Wenn Sie Fragen oder Bedenken haben, kontaktieren Sie mich.
FREE

Der Indikator zeichnet Linien zu den Kurshöchst- und -tiefstständen. Der Durchbruch durch den Höchst- oder Tiefststand deutet in der Regel auf eine Trendänderung (oder -fortsetzung) hin. Sobald der Kurs eine Linie durchbricht und die Kerze schließt, zeichnet der Indikator einen entsprechenden Pfeil (Sie können auch Warnungen aktivieren). Ein Handel sollte in der Durchbruchsrichtung sofort oder nach einem leichten Rollback durchgeführt werden. Es ist am besten, dem Trend folgend auf einem größere
FREE
Der Pappye-Indikator verwendet das Bolinger-Band, um sein Signal auszulösen, und enthält eine Pappye-Animation für die Warnung vor Handelssignalen. dieser Alarm ist nicht fortlaufend für den gleichen Pfeil, sondern wird nur 2 mal abgespielt und kann für jedes Paar und jeden Zeitrahmen verwendet werden Ich persönlich ziehe es vor, einen Handel zu eröffnen, wenn sich der Pfeil nach einem Kursausbruch auf horizontaler Ebene befindet. aber Sie können Ihren Weg wählen, nachdem Sie die Demokopie auf I
FREE

RSI-Scanner, mehrere Symbole und Zeitrahmen, grafische Benutzeroberfläche Ein Indikator, der mehrere von der Marktbeobachtung hinzugefügte Symbole und Zeitrahmen scannt und das Ergebnis in einem grafischen Panel anzeigt. Merkmale: Mehrere Symbole Mehrere Zeitrahmen Alarme und Benachrichtigungen Live-Überwachung Sortier-Modi Ein Klick zum Wechseln von Symbol und Zeitrahmen Eingaben für RSI und Scanner-Einstellungen
FREE
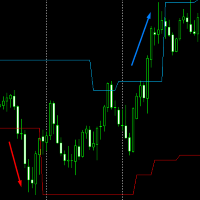
Volatility Channel von JagzFX hilft Ihnen, Ausbrüche zu finden , indem ein Kanal auf dem Preisdiagramm angezeigt wird. Volatility Channel ist einfach zu bedienen - es gibt keine Parameter - und funktioniert auf jedem Zeitrahmen. GRUNDLEGENDE VERWENDUNG von Volatilitätskanälen Der Kanal kann als "No Trade Zone" verwendet werden: Sie handeln nicht, wenn sich der Kurs innerhalb des Kanals befindet. Allerdings:
Wenn der Kurs über den Kanal ausbricht: Gehen Sie Long. Wenn der Kurs unter den Kanal bri
FREE

Geglätteter DeMarker-Oszillator (xDeM) Indikator
Eingabeparameter: Periode - Mittelungszeitraum Arbeitsweise
Der Indikator berechnet den technischen Standardindikator DeMarker Oscillator neu (mittelt die erhaltenen Werte zweimal). Die Mittelungsperiode des Indikators entspricht der doppelten Periode des Standard DeMarker Oscillators . Zum Beispiel : xDeM mit Mittelungsperiode 7 entspricht DeM mit Periode 14. Der Indikatorpuffer wird nicht neu gezeichnet.
FREE

ReviewCandleChart ist ein einzigartiges Produkt, das vergangene Kursschwankungen anhand von Candlestick-Charts nachweisen kann. Dieser Indikator reproduziert genau die Marktpreisschwankungen in der Vergangenheit und kann Handelsentscheidungen (Einstiege, Gewinne, Verlustschnitte) viele Male treffen, so dass Sie den Handel schneller lernen können. ReviewCandleCahrt ist der beste Indikator zur Verbesserung der Handelsfähigkeiten. ReviewCandleCahrt richtet sich sowohl an Anfänger als auch an fortge
FREE

Einfach. Informativ. Sofort auf Ihrem Chart sichtbar. Alwinson Active Trades Info (MT4 Version) ist ein leichtgewichtiger, benutzerdefinierter Indikator, der eine Echtzeit-Zusammenfassung Ihrer aktuell offenen Trades anzeigt - direkt auf Ihrem Chart. Sie müssen nicht mehr zwischen verschiedenen Tabs wechseln, um zu sehen, welche Paare aktiv sind und wie viel Lotgröße im Spiel ist.
Alwinson Active Trades Info ist auch für die MetaTrader 5 (MT5) Version verfügbar (bitte schauen Sie sich meine and
FREE

Denken umfasst einen Fluss von Ideen und Assoziationen , der zu logischen Schlussfolgerungen führen kann. Obwohl Denken eine Tätigkeit von existenziellem Wert für den Menschen ist, besteht noch immer kein Konsens darüber, wie es angemessen definiert oder verstanden wird. Das Denken ermöglicht es dem Menschen, die Welt, die er erlebt, zu verstehen, zu interpretieren, darzustellen oder zu modellieren und Vorhersagen über diese Welt zu treffen. Es ist daher für einen Organismus mit Bedürfnissen, Zi
FREE

Signale und Warnungen für den Accelerator/Decelerator-Indikator basierend auf diesen MQL5-Beiträgen: Accelerator Oscillator und Signale des Indikators Accelerator Oscillator . Hinweis : Dieses Tool basiert auf dem Code des Accelerator Indikators, der von MetaQuotes Software Corp. entwickelt wurde.
Merkmale Die Signale werden beim Schließen des letzten Balkens/bei der Eröffnung eines neuen Balkens ausgelöst; Jede Art von Warnungen kann aktiviert werden: Dialogfeld, E-Mail-Nachricht, SMS-Benachri
FREE

GM Reverse Indicator arbeitet auf Basis von Fibonacci und einigen anderen Optimierungen
-> Er ist so programmiert, dass er bei Marktschwankungen zu 100% automatisiert. Diesen Indikator verwende ich, um Unterstützungspunkte zu finden. Er funktioniert wirklich und ich möchte ihn mit Ihnen teilen.
-> Hängen Sie den GM Reversal Indicator einfach an einen beliebigen Chart an. Je größer der Zeitrahmen, desto besser die Signalqualität (Sie sollten mit dem Zeitrahmen von H4 verwenden) -> Dies ist mei
FREE

Der Kerzengrößen-Oszillator ist ein einfach zu bedienendes Werkzeug, um die Kerzengröße vom höchsten bis zum niedrigsten Preis jeder Kerze zu ermitteln. Es ist ein leistungsstarkes Tool für Preisaktionsanalysten, insbesondere für diejenigen, die mit Intraday-Charts arbeiten, und auch ein perfektes Tool für kurzfristige Swing-Trader. Bitte beachten Sie, dass Sie die Bullish- und Bearish-Kerzen auch mit verschiedenen Farben bearbeiten können.
#Tags: Kerzengröße, Oszillator, Preisaktion, Preisspann
FREE
MetaTrader Market - der einzige Shop, in dem man Handelsroboter als Demoversion herunterladen und testen sowie anhand historischer Daten optimieren kann.
Lesen Sie die Beschreibung und Bewertungen anderer Kunden über das gewünschte Produkt, laden Sie es direkt ins Terminal herunter und erfahren Sie, wie man einen Handelsroboter vor dem Kauf testet. Nur bei uns können Sie ein Programm testen, ohne dafür zu bezahlen.
Sie verpassen Handelsmöglichkeiten:
- Freie Handelsapplikationen
- Über 8.000 Signale zum Kopieren
- Wirtschaftsnachrichten für die Lage an den Finanzmärkte
Registrierung
Einloggen
Wenn Sie kein Benutzerkonto haben, registrieren Sie sich
Erlauben Sie die Verwendung von Cookies, um sich auf der Website MQL5.com anzumelden.
Bitte aktivieren Sie die notwendige Einstellung in Ihrem Browser, da Sie sich sonst nicht einloggen können.