Technische Indikatoren für den MetaTrader 4 - 8

Oder M Oving A verage S upport R eständigkeit Bands.
Der MASR-Bänder-Indikator ist ein gleitender Durchschnitt, der von zwei Bändern umgeben ist, die als Unterstützungs- und Widerstandsniveaus zusammenarbeiten. Statistisch enthalten MASR-Bänder in 93% der Fälle Preiskerzen. So wird es in Schritten berechnet: 1. Der erste Schritt besteht darin, das höchste Hoch (HHV) und das niedrigste Tief (LLV) für einen Zeitraum von X zu berechnen.
2. Der zweite Schritt besteht darin, HHV durch LLV zu teil
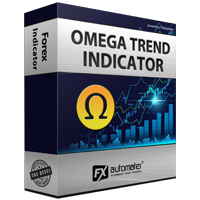
Der Omega-Trend-Indikator ist ein fortschrittliches Instrument, das speziell entwickelt wurde, um Markttrends frühzeitig zu erkennen und ihnen effizient zu folgen. Der Indikator zeichnet zwei Linien. Die Haupttrendlinie (dicker) stellt die mutmaßliche untere oder obere Volatilitätsgrenze des aktuellen Markttrends dar. Ein Bruch der Haupttrendlinie deutet auf eine mögliche Umkehr oder Verschiebung der Trendbewegung hin. Die Trendlinie zeigt auch den besten Punkt für die Platzierung einer Stop-Los
FREE
Produkttitel ZigZag Colored (MT4)
See also >> Smart ZigZag Pro , Smart ZigZag (free)
Kurzbeschreibung Zwei‑farbiger ZigZag für MT4, der die Ein‑Farben‑Beschränkung einer Linie löst und EA‑fähige Puffer mit Wert und Richtung des aktuellen Legs je Kerze bereitstellt. Überblick Stellt den klassischen ZigZag als zwei getrennte, farbcodierte Linien dar; Werte pro Kerze verfügbar für EAs/Indikatoren. Hauptfunktionen Zwei‑farbige Legs; EA‑Puffer ZigZag Up , ZigZag Down , ZigZag Per Bar ; native
FREE

Royal Wave ist ein Trend-Power-Oszillator, der so programmiert wurde, dass er risikoarme Ein- und Ausstiegszonen findet und signalisiert. Sein Kernalgorithmus analysiert den Markt statistisch und erzeugt Handelssignale für überkaufte, überverkaufte und wenig volatile Bereiche. Durch den Einsatz eines gut durchdachten Warnsystems erleichtert dieser Indikator die Entscheidung, wo man einsteigen und wo man aussteigen sollte. Merkmale Trend-Power-Algorithmus Einstiegs- und Ausstiegszonen mit geringe

Dieses Dashboard ist ein Warntool zur Verwendung mit dem Indikator für die Umkehrung der Marktstruktur. Sein Hauptzweck besteht darin, Sie auf Umkehrmöglichkeiten in bestimmten Zeitrahmen und auch auf die erneuten Tests der Warnungen (Bestätigung) aufmerksam zu machen, wie es der Indikator tut. Das Dashboard ist so konzipiert, dass es auf einem eigenen Chart sitzt und im Hintergrund arbeitet, um Ihnen Benachrichtigungen zu Ihren ausgewählten Paaren und Zeitrahmen zu senden. Es wurde entwickelt,

Ich habe einen Indikator vorbereitet, der die KAUF- und VERKAUFSwahrscheinlichkeit anzeigt, indem er höhere Zeitrahmen überprüft... Es ist schnell, einfach zu lesen, und kostenlos. Viel Spaß, und lassen Sie mich wissen, wie es Ihren Handel steigert! Sie können die Kauf-/Verkaufswahrscheinlichkeiten des Indikators an Ihren persönlichen Handelsstil anpassen, indem Sie die Gewichtung des Zeitrahmens , die Glättung und den Einfluss von Unterstützung/Widerstand verändern. Behalten Sie sowohl die Char
FREE
Anzeige der Zeit bis zum Ende der Kerze. Zeigt die Zeit bis zum Ende der Kerze sowie die Serverzeit an. Text kann den Trend oder die Richtung der Kerze anzeigen, akustische Benachrichtigungen sind integriert Besonderheiten:
Zeigt die Zeit bis zum Ende der aktuellen Kerze sowie andere Zeitrahmen an, die bei Bedarf angepasst oder deaktiviert werden können AW Candle Time kann die Richtung der aktuellen Kerze oder des Trends mit dem AW Super Trend Indikator auswählen Die Trendstrategie wird in der
FREE
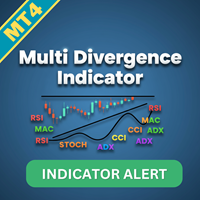
Multi-Divergenz-Indikator für MT4 - Benutzerhandbuch Einführung Überblick über den Multi-Divergenz-Indikator und seine Möglichkeiten zur Erkennung von Divergenzen bei mehreren Indikatoren.
Bedeutung der Divergenzerfassung für die Verbesserung von Handelsstrategien und Entscheidungsfindung.
Liste der Indikatoren RSI
CCI
MACD
STOCHASTIC
AWSOME
MFI
ACCELERATOR
OSMA
MOMENTUM
WPR( Williams %R)
RVI Indikator-Merkmale
Indikatorauswahl: Aktivieren/Deaktivieren bestimmter Indikatoren (RSI, CCI, MACD usw
FREE
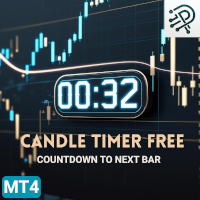
Candle Timer Countdown zum nächsten Bar MT4 Free von DigitalPrime Ein zuverlässiger, leichtgewichtiger Candle Timer, der die genaue verbleibende Zeit bis zum nächsten Bar anzeigt - jetzt kostenlos mit Kernfunktionalität erhältlich. Wird von Hunderten von Händlern genutzt und vertraut - über 800 Downloads! Hauptmerkmale Echtzeit-Countdown bis zum nächsten Kerzenschluss (nur für M1, M15 und H1) Aktualisierungen unabhängig von der Tick-Aktivität des Marktes Minimale CPU-Belastung - funktioniert re
FREE
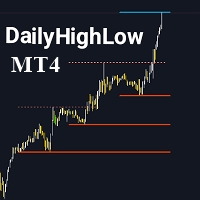
Bitte vergessen Sie nicht, den Indikator zu bewerten, um mir bei der Sichtbarkeit zu helfen. Der DailyHighLow Indikator ist für die MetaTrader 4 (MT4) Plattform entwickelt und hilft Tradern, tägliche Preisbewegungen zu überwachen. Dieser Indikator zeichnet automatisch Trendlinien basierend auf den Höchst- und Tiefstwerten eines bestimmten Zeitraums und bietet so visuelle Einblicke in den Markt. Hauptmerkmale: Anpassbare Trendlinien: Passen Sie die Farbe, den Stil und die Breite der Trendlinien n
FREE

Ich stelle Ihnen Order Blocks Breaker vor, eine brandneue Methode zur Identifizierung und Nutzung von Orderblöcken in Ihrer Handelsstrategie. Nachdem ich mehrere Orderblock-Tools mit einzigartigen Konzepten entwickelt habe, bin ich stolz darauf, dieses Tool zu präsentieren, das die Dinge auf die nächste Stufe hebt. Im Gegensatz zu früheren Tools identifiziert Order Blocks Breaker nicht nur Orderblöcke, sondern hebt auch Breaker Order Blocks hervor - Schlüsselbereiche , in denen der Preis nach ei

Advanced Reversal Hunter Pro (ARH) ist ein leistungsstarker, innovativer volatilitätsbasierter Momentum-Indikator, der entwickelt wurde, um wichtige Trendumkehrungen genau zu erkennen. Er wurde mit einem speziellen Algorithmus entwickelt, der eine klare Konstruktion der durchschnittlichen Volatilitätsspanne bietet, ohne deren Werte neu zu zeichnen und sie nicht zu verändern. Der Indikator passt sich jeder Marktvolatilität an und passt die Breite des Bandes je nach den aktuellen Marktbedingungen

SIE KÖNNEN JETZT KOSTENLOSE VERSIONEN UNSERER KOSTENPFLICHTIGEN INDIKATOREN HERUNTERLADEN. ES IST UNSERE ART DER RÜCKGABE AN DIE GEMEINSCHAFT! >>> HIER GEHT'S ZUM DOWNLOAD
Dieses System ist ein Heiken Ashi System basierend auf RSI Berechnungen. Das System ist ein kostenloses Open-Source-Skript, das ursprünglich auf TradingView von JayRogers veröffentlicht wurde. Wir haben uns die Freiheit genommen, das Kiefer-Skript in einen Mq4-Indikator zu konvertieren. Wir haben auch eine neue Funktion hinz
FREE
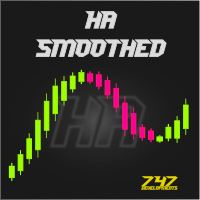
Der KOSTENLOSE Heiken Ashi Smoothed-Indikator ist vollständig anpassbar, einfach zu bedienen und bietet die Möglichkeit, über die iCustom-Funktion auf den Indikator zuzugreifen , sodass Sie ihn in Ihrer eigenen Handelssoftware verwenden können. Der Indikator kann auch Warnungen anzeigen, wenn sich das Signal ändert, oder Push-Benachrichtigungen senden. Für die Metatrader 5 Version klicken Sie hier: https: //www.mql5.com/en/market/product/70825 Für detaillierte Informationen klicken Sie: >>HIER<
FREE

FOLGEN SIE DER LINIE DIE VOLLVERSION ERHALTEN SIE HIER: https://www.mql5.com/en/market/product/36024 Dieser Indikator gehorcht der beliebten Maxime, dass: "DER TREND IST DEIN FREUND". Er malt eine GRÜNE Linie für KAUFEN und eine ROTE Linie für VERKAUFEN. Er gibt Alarme und Warnungen aller Art aus. Er wiederholt sich nicht und kann für alle Währungspaare und Zeitrahmen verwendet werden. Ja, so einfach und simpel ist das. Selbst ein Neuling kann damit großartige und zuverlässige Geschäfte machen.
FREE

Multi Anchor VWAP Pro MT4 - Rein verankerter VWAP | Adaptive σ-Bänder | Smart Alerts Präzise VWAP-Verankerung, speziell für MetaTrader 4 entwickelt. Ein-Klick-Anker, dynamische σ-Bänder oder %-Bänder und sofortige Multi-Channel-Warnungen - ideal für Scalper, Intraday- und Swing-Trader, die ein Fair-Value-Mapping in institutioneller Qualität benötigen. Vollständiges Benutzerhandbuch - Brauchen Sie MT5? Klicken Sie hier WARUM PROFESSIONELLE TRADER MULTI-ANKER-VWAP PRO WÄHLEN VWAP ist die instituti
NYXORA SIGNAL - Präzisions-Scalping-Power für XAUUSD (M1) NYXORA SIGNAL ist ein fortschrittlicher Scalping-Indikator, der exklusiv für XAUUSD (Gold) auf dem M1-Zeitrahmen entwickelt wurde.
Er erkennt automatisch potenzielle Umkehrzonen und verfeinert sie zu einer präzisen 30-Pip-Zone , die Händlern einen schnellen und präzisen Einstieg in den extrem volatilen Goldmarkt ermöglicht. Wichtigste Merkmale Automatische Erkennung von Umkehrzonen - Intelligenter Algorithmus, der potenzielle Umkehrzonen
FREE

Gold Channel ist ein volatilitätsbasierter Indikator, der mit einem speziellen Timing-Algorithmus für das Paar XAUUSD entwickelt wurde, der darin besteht, mögliche Korrekturen auf dem Markt zu erkennen.
Dieser Indikator zeigt zwei äußere Linien, eine innere Linie (Retracement-Linie) und ein Pfeilzeichen, wobei die Theorie des Kanals darin besteht, überkaufte und überverkaufte Bedingungen auf dem Markt zu erkennen.
Der Marktpreis wird im Allgemeinen zwischen den Grenzen des Kanals fallen. Wenn

Bermaui Bands (BB) ist ein technisches Analysetool, das dabei hilft, zwischen Bereichs- und Trendkursbewegungen zu filtern. Die Idee hinter diesem Indikator lässt sich in den nächsten Schritten erklären: Berechnen Sie die Standardabweichung als Oszillator, der sich zwischen 0 und 100 bewegt. Ich nenne sie Bermaui-Abweichung in Prozent (BD %). Wenn "BD %" nahe Null ist, ist die Volatilität am höchsten. Außerdem ist die Volatilität sehr gering, wenn "BD %" nahe 100 liegt. Hohe Volatilität bedeutet

Nas100 Killer V2 (Siehe Video, wie wir den Indikator live testen) Der Indikator erscheint zu 1000% auf der aktuellen Kerze und wird nicht neu gezeichnet. Zeitrahmen: M5, M15, M30, H1, H4. Funktioniert bei Paaren wie (NAS100, US30, SPX500 und Gold) Der Indikator ist ausschließlich für Scalping nicht halten Trades für zu lange. Orange Pfeile suchen nach Verkaufsgelegenheiten. Hellblaue Pfeile suchen nach Kaufgelegenheiten.
Der Opening Range Breakouts Indikator ist ein sitzungsbasiertes Handelstool für Händler, die institutionelle Handelskonzepte wie ICT (Inner Circle Trader), Smart Money Concepts (SMC) und volumen- oder auftragsflussbasierte Strategien verfolgen. Dieser Indikator stellt wichtige Eröffnungsspannen der Sitzung dar und ermöglicht es Händlern, potenzielle Liquiditäts-Sweeps, Ausbruchszonen, Fakeouts und wichtige Intraday-Levels in den wichtigsten globalen Forex-Sitzungen zu ide

Hinweis: Das Problem des langsamen Ladens des Indikators wurde behoben. Diese neue Version lädt schnell und verlangsamt die Plattform nicht.
Version 1.3 : Wir haben den Indikator aktualisiert und eine Option zum Scannen historischer Balken hinzugefügt. Anstatt alle Balken in der Historie zu scannen (was den Indikator manchmal langsam machen kann), können Sie die maximale Anzahl von Balken auswählen, die gescannt werden können, was die Leistung erhöhen und den Indikator schneller machen kann.
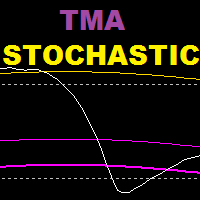
TMA Stochastic ist ein Indikator, der auf einem stochastischen Oszillator und einem TMA-Band-Indikator basiert. Dieser Indikator basiert auf einer Umkehrstrategie.
Empfohlener Zeitrahmen: 15 und älter
Empfohlene Einstellungen: niedrigere Werte für Scalping, höhere Werte für Swing Trading
=============================================== =====================
Parameter:
TMA-Verlauf: Wie viele Balken zurück, um TMA-Bänder auf der Stochastik anzuzeigen
K-Periode (Stochastik)
D-Periode (Stocha
FREE
Signal King: Ihr oberster Trendindikator Fühlten Sie sich jemals verloren im Lärm des Marktes? Der "Signal King"-Indikator durchbricht das Chaos und liefert Ihnen klare Kauf- und Verkaufssignale mit hoher Wahrscheinlichkeit direkt auf Ihrem Chart. Dies ist nicht einfach nur ein weiterer Trendindikator, sondern ein leistungsstarkes Tool, das Ihnen einen Vorteil verschafft, indem es den robusten Supertrend mit einem zuverlässigen EMA-Filter kombiniert. Der Supertrend zeichnet sich dadurch aus, das
FREE

Ein Fibonacci-Indikator lässt sich am besten mit anderen Indikatoren wie Pivots, Support/Resistance usw. kombinieren. Der Kurs neigt dazu, Fibo-Ebenen als Unterstützungs- oder Widerstandslinien zu nutzen. Dieser Indikator ist also sehr nützlich, um zu wissen, wann der Kurs umkehren könnte, oder ob der Kurs den Trend fortsetzen könnte, wenn ein Niveau überschritten wird. Auch um die besten Take-Profit- und Stop-Loss-Linien zu finden. Verwenden Sie den Fibo-Indikator nicht allein für den Handel, d
FREE

DTFX Algo Zones sind automatisch generierte Fibonacci-Retracements, die auf Marktstrukturverschiebungen basieren.
Diese Retracement-Levels sollen als Unterstützungs- und Widerstandslevels verwendet werden, an denen der Preis abprallen kann, um die Richtung zu bestätigen.
ANWENDUNG Abbildung 1 Da die Retracement-Levels nur aus identifizierten Marktstrukturverschiebungen generiert werden, sind die Retracements darauf beschränkt, nur aus Bereichen zu ziehen, die aufgrund des technischen Brea
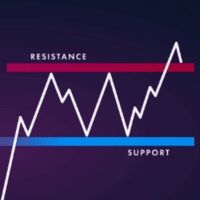
MT4-Version: https://www.mql5.com/en/market/product/157679 MT5-Version: https://www.mql5.com/en/market/product/157680
Support & Resistance – Intelligente Marktstruktur-Levels
Ein übersichtlicher, intelligenter und hochzuverlässiger Support- und Resistance-Indikator, entwickelt für professionelle Trader und automatisierte Systeme.
Support & Resistance erkennt mithilfe eines fortschrittlichen Clustering-Algorithmus, der Fraktale, ATR-basierte Preissegmentierung und Multi-Timeframe-Analyse komb
FREE

SMT (Smart Money Technique) Divergence bezieht sich auf die Preisdivergenz zwischen korrelierten Vermögenswerten oder deren Verhältnis zu umgekehrt korrelierten Vermögenswerten. Durch die Analyse von SMT Divergence können Händler Einblicke in die institutionelle Struktur des Marktes gewinnen und erkennen, ob Smart Money Vermögenswerte akkumuliert oder verteilt. Jede Preisfluktuation sollte durch Marktsymmetrie bestätigt werden, und jede Preisasymmetrie deutet auf eine SMT Divergence hin, die ein

Super Trend Pro Es ist einfach. Wie Sie im Produktbild sehen, können Sie herausfinden, wie es funktioniert. Wir verwenden mehrere MA und verwenden Statistik und Wahrscheinlichkeit innerhalb des Codes, um schöne, große und reine Trend-Erkennung zu zeichnen. Mögen Sie es? Ja, mir auch Hier, Super-Trend-Profi mit 100% non-repainting Indikator
Die Eingabeparameter sind klar und einfach.
Eingaben Periode 1 --------------------------->>>> Verwendung für mathematische Berechnungen
Periode 2 ----------
FREE

Das Elliot-Dreieck ist eines der 13 Muster der Elliot-Wellen-Theorie, die besagt, dass das Verhalten der Gesellschaft oder der Menschenmenge dazu neigt, sich in erkennbaren Mustern umzukehren, und die ein strukturelles Muster offenbaren, das sowohl in der Natur als auch in der Massenpsychologie der Handelsteilnehmer auftritt. Daraus hat er verschiedene identifizierbare Muster entwickelt, die in den Marktpreisen auftauchen. Eines dieser Muster habe ich Elliot's Triangle genannt.
Dieses dreiecki
FREE
AP VWAP Bands Pro (MT4) Volumengewichteter Durchschnittspreis mit ±σ-Bändern für klare Intraday-Bias, Mittelwert-Umkehrzonen und dynamische Unterstützung/Widerstand. Funktioniert bei Kryptowährungen (inkl. BTC), FX, Indizes und Metallen. Verwendet das Tick-Volumen, wenn das reale Volumen nicht verfügbar ist.
Was es zeigt VWAP-Linie (volumengewichteter Durchschnittspreis).
Zwei Hüllkurven um den VWAP (standardmäßig ±1σ und ±2σ) zur Hervorhebung des Gleichgewichts gegenüber der Ausdehnung.
Mod
FREE
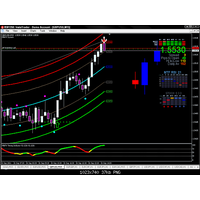
Gravity Timing Indicator -GTI-
Der GTI-Indikator ist der bisher einfachste und genaueste Indikator. Er nutzt Unterstützung und Widerstand auf Schwerkraftbasis. Die Arbeit daran ist so einfach, dass er aus 7 Linien besteht, von denen die stärksten die niedrigste und die höchste Linie sind Der Indikator erholt sich, es ist die beste Zeit für einen Einstieg.
es funktioniert bei allen Paaren ohne Ausnahme
Für den Zeitrahmen bevorzuge ich kleine Zeitrahmen wie 5 Minuten und 15 Minuten für das S
FREE

Volumen gibt der Preisaktion Tiefe! Volume Critical kann die günstigsten Bereiche für die Platzierung von Trades genau lokalisieren. Steigen Sie so früh wie möglich in Umkehrbewegungen ein, um die besten Risiko-Ertrags-Setups zu erhalten!
Merkmale Aggressiver Algorithmus, der Umkehrungen vorhersagt Volumen-Klassifizierungen Graue Histogramme - Normales Volumen, durchschnittliche Marktaktivität Orange Histogramme - Trending Volume, erhöhte Marktaktivität Rosa Histogramme - Überkauftes Volumen, w

Dieser Indikator ist ein interaktives Elliott-Wellen-Beschriftungstool für MetaTrader 4 und 5.
Er ermöglicht es dem Benutzer, Wellenbeschriftungen direkt im Chart manuell zu platzieren, indem er Größe, Farbe und Wellentyp (ABC-Korrekturen, 5-Wellen-Impulse oder WXY-Strukturen) über ein Chart-Menü auswählt.
Mit einem einzigen Klick im Chart platziert der Indikator die passenden Wellenbeschriftungen sequenziell zum gewählten Preis und Zeitpunkt und hilft Tradern dabei, Elliott-Wellen-Strukturen vi
FREE
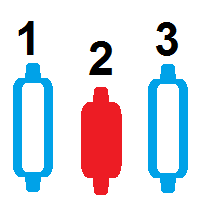
Candlestick-Zähler dieser Indikator zählt Kerzen, die sich auf dem Chart eines beliebigen Zeitrahmens befinden eine kostenlose Bartheke, die Sie auf mt4 herunterladen können der Candlestick-Zähler zählt, wie viele Kerzen sich in einem größeren Chart befinden mit diesem Kerzenzähler können Sie die automatische Kerzenzählung durchführen kostenloser Candlestick-Zählindikator zum automatischen Herunterladen und Zählen von Balken bar counter to count the bars count candle counter indicator mt4 count
FREE

Forex Gunslinger ist ein KAUF/VERKAUF-Umkehrsignalindikator, der auf der Idee basiert, Unterstützung/Widerstand, Überkreuzungen und Oszillatoren im MTF-Modus zu kombinieren. Wenn alles ausgerichtet ist, generiert der Indikator ein KAUF- oder VERKAUFSsignal. Obwohl der Indikator auf der MTF-Idee basiert, ist der Algorithmus sehr stabil und generiert zuverlässige Umkehrsignale. Dies ist ein Indikator vom Typ MTF, bei dem ein höherer oder niedrigerer Zeitrahmen zur Berechnung der Signale für Ihr ak

Im Handelssystem "Masters of Risk" bezieht sich eines der wichtigsten Konzepte auf Orte, an denen die Märkte ihre Richtung ändern. In der Tat ist dies eine Änderung der Priorität und eine Verletzung der Trendstruktur an den Extremen des Marktes, wo angeblich gibt es oder wäre Stop-Losses von "smart" Teilnehmer, die außerhalb der Grenzen der Akkumulation von Volumen sind. Aus diesem Grund nennen wir sie "Reversal Patterns" - Orte mit viel Gewicht für den Beginn eines neuen und starken Trends. Ein

Divergenz und Konvergenz sind wichtige Vorboten von Umschwüngen an den Aktienmärkten.
Der Indikator Divergence Sync wurde entwickelt, um automatisch nach Divergenzen bei einer großen Anzahl von Indikatoren mit unterschiedlichen Parametern zu suchen.
Die Suche nach Divergenzen wird bei diesen Indikatoren durchgeführt: (CCI, CHO, DeMarker, MACD, MFI, Momentum, OBV, OsMA, RSI, Stochastic, WPR, Awesome Oscillator ).
Um nach Divergenzen zu suchen, können Sie einen technischen Indikator verwenden od

Dieser Indikator basiert auf dem berühmten fraktalen Indikator, bietet jedoch viele Anpassungsmöglichkeiten und Flexibilität.
Dies ist ein leistungsstarkes Tool zur Identifizierung von Trendumkehrungen und zur Maximierung Ihres Gewinnpotenzials.
Mit seinen erweiterten Funktionen und der benutzerfreundlichen Oberfläche ist es die ultimative Wahl für Händler aller Erfahrungsstufen. MT5-Version: Ultimate Fractals MT5 Merkmale :
Anpassbare Anzahl fraktaler Kerzen. Umkehrlinien. Anpassbare Eins
FREE

HiLoTren IQ7 – Intelligente Marktgrenzen und Pivot-Mapping Definieren Sie Ihre Handelsebenen mit KI-Präzision.
HiLoTren IQ7 ist ein intelligenter , pivotbasierter Indikator , der Pivot-Punkte , Widerstands- (R1–R3) und Unterstützungszonen (S1–S3) automatisch direkt in Ihr Diagramm einzeichnet.
Es bietet einen klaren visuellen Rahmen zur Identifizierung von Marktgrenzen, Umkehrzonen und Trendfortsetzungsniveaus – alles in Echtzeit berechnet. Hauptmerkmale Auto-Pivot-Engine
FREE

ZU GUTER LETZT! Ein stochastischer Indikator für MT4, der mehrere Zeitrahmen auf einem Chart anzeigt! Zeigen Sie sofort die tatsächliche Position der Haupt- und Signalleitungen in 4 verschiedenen Zeitrahmen an, um fundierte Handelsentscheidungen zu treffen.
Ein echter stochastischer MTF-Indikator für Händler, die visuell sehen müssen, was der Indikator ihnen in mehreren Zeitrahmen sagt, keine Pfeile, die nur nach oben oder unten zeigen oder Zahlen anzeigen. Kein Wechseln mehr zwischen den Zeit
FREE

Ichimoku Trend Alert ist der Ichimoku Kinko Hyo Indikator mit Alerts und Signalfiltern.
Ichimoku Trend Alert Funktionen: Optionale Überprüfung von Ichimoku-Wolke, Tenkan sen (Umkehrlinie), Kijun sen (Basislinie), Senkou-Spanne A, Senkou-Spanne B und Chikou-Spanne relativ zum Preis und mehr. Popup-, E-Mail- und Telefon-Benachrichtigungen für ausgewählte Symbole und Zeitrahmen.
Es gibt 9 klassische Ichimoku-Trendfilter, die Sie in den Einstellungen aktivieren/deaktivieren können: Preis/Wolkenauf
FREE
Der AX Forex Indicator MT4 ist ein hochentwickeltes Handelsinstrument, das Händlern eine umfassende Analyse mehrerer Währungspaare bietet. Dieser leistungsstarke Indikator vereinfacht die komplexe Natur des Forex-Marktes und macht ihn sowohl für Anfänger als auch für erfahrene Trader zugänglich. AX Forex Indicator verwendet fortschrittliche Algorithmen zur Erkennung von Trends und Mustern und ist ein unverzichtbares Werkzeug für Händler, die ihre Leistung im Devisenhandel verbessern möchten. Mi

Pivot Point Fibo RSJ ist ein Indikator, der die Unterstützungs- und Widerstandslinien des Tages mithilfe von Fibonacci-Kursen verfolgt.
Dieser spektakuläre Indikator erzeugt bis zu 7 Unterstützungs- und Widerstandsebenen durch Pivot Point unter Verwendung von Fibonacci-Kursen. Es ist fantastisch, wie die Preise jedes Niveau dieser Unterstützung und dieses Widerstands respektieren, wo es möglich ist, mögliche Einstiegs- / Ausstiegspunkte einer Operation zu erkennen.
Merkmale Bis zu 7 Unterstü
FREE
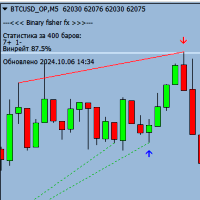
Binary Fisher FX ist ein leistungsstarker Indikator für binäre Optionen, der in jedem Zeitrahmen und mit jedem Währungspaar funktioniert. Dieser Indikator dient zur Identifizierung von Trendbewegungen und zeigt Einstiegspunkte in Form eines Pfeils vor dem Schließen der aktuellen Kerze an.
Hauptmerkmale des Indikators:
Funktioniert in jedem Zeitrahmen (M1, M5, M15, M30, H1, H4, D1) Unterstützt alle Währungspaare Ablauf von 1 bis 3 Kerzen (Standard 1 Kerze) Zeigt Einstiegspunkte in Form eines P
FREE
Trading Sessions 3: Visualisieren Sie die globale Marktaktivität Trading Sessions 3 ist ein intuitiver MQL5-Indikator, der entwickelt wurde, um die wichtigsten Intraday-Handelssitzungen klar anzuzeigen: Asien, London und New York . Verschaffen Sie sich ein klares Verständnis der globalen Marktaktivität und identifizieren Sie Perioden erhöhter Volatilität für strategische Handelsentscheidungen. Hauptmerkmale: Globale Sitzungs-Visualisierung: Identifizieren Sie ganz einfach die aktiven Handelszeit
FREE
HTF MACD - Trendorientierte Signale (ein Teilfenster, Pfeile im Chart) Was er tut
Dieser Indikator hält Sie beim Handel mit dem Trend im höheren Zeitrahmen, während er MACD-Kreuzungen für präzise Einstiege nutzt. In einem einzigen Unterfenster zeigt er an: HTF-Trendhistogramm - grün = Aufwärtstrend, rot = Abwärtstrend (der neutrale Bereich ist für eine bessere Übersicht ausgeblendet) MACD-Linien - blau = MACD-Hauptlinie, orange = MACD-Signal Pfeile auf dem Preisdiagramm , wenn ein gültiges, tre
FREE
Dieses Programm macht die Analyse mehrerer Zeitrahmen bequemer.
Es hilft, alle Diagramme in einem anderen Zeitrahmen zu synchronisieren, um dasselbe Symbol anzuzeigen. denselben bestimmten Zeitraum und synchronisieren Sie Zeichnungsobjekte, die auf allen Diagrammen gleichzeitig angezeigt werden
Objektsynchronisationsunterstützung: Vertikale/Horizontale Linie, Trendlinie, Rechteck, Pfeil, Fibo-Retracement
Zusätzliches Feature: Trendlinien-Alarm
Wie man es benutzt >> https://youtu.be/NEHUW7v1
FREE

Hintergrund : Forex Swing Trading ist eine kurz- bis mittelfristige Strategie, die darauf abzielt, von Kursschwankungen (kurzen Aufwärts-/Abwärtstrends) innerhalb größerer Marktbewegungen zu profitieren.
Es handelt sich um ein einfaches System, das auf die Ablehnung eines vorangegangenen Swing-Hochs/Tiefs setzt. Das System ist nicht repaint und einfach zu bedienen. Bitte verwenden Sie mit Diskretion, es gibt eine anständige Genauigkeit und würde definitiv verbessern Sie Ihre Trades. Sie können
FREE

Mit diesem Tool können Sie die Unterstützungs- und Widerstandsniveaus der Pivot-Punkte sowie die täglichen Eröffnungs-, wöchentlichen und monatlichen Schlussniveaus auf Ihrem Diagramm anzeigen lassen und dabei ein hohes Maß an Anpassungsfähigkeit erreichen.
Pivot-Punkte sind wichtige horizontale Unterstützungs- und Widerstandsniveaus, die anhand des Höchst-, Tiefst- und Schlusskurses der vorangegangenen Periode (z. B. D1) berechnet werden. Bei diesem Indikator können Sie zwischen stündlichen u
FREE
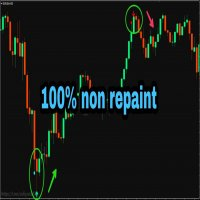
BITTE BEACHTEN SIE : Sie können die Einstellungen des K_period-Wertes, des überverkauften und des überkauften Wertes individuell anpassen . Die Genauigkeit wird sich entsprechend Ihren Einstellungen ändern.
100% Non-Repaint-Indikator
Vorwarnsignale
Non-Delay-Anzeigen
24/7-Signale
100% No Lag
Keine Neuberechnung Die Pfeile werden nicht neu gezeichnet, auch wenn das Signal fehlschlägt oder Sie mt4 aktualisieren oder neu starten. Der Indikator basiert auf einer einfachen Crossover-Strategie der Ha
FREE

Multicurrency und Multitimeframe Modifikation des ZigZag Indikators. Zeigt die aktuelle Richtung des Marktes, die Höhe der letzten Bewegung, die Anzahl der Balken in dieser Bewegung und den Bruch des vorherigen Punktes des ZigZag (horizontale Linie) an. Dies ist ein MTF-Scanner, Sie können tatsächlich die Angebots- und Nachfrageebenen sehen.
Sie können alle gewünschten Währungen und Zeitrahmen in den Parametern angeben. Außerdem kann das Panel Benachrichtigungen senden, wenn die ZigZag-Linie i

- Real Preis ist 200$ - 50% Rabatt (Es ist 99$ jetzt) - Es ist für 4 Käufe aktiviert. Kontaktieren Sie mich für zusätzliche Bonus (Gann Trend Indikator ), Anleitung oder Fragen! - Nicht nachgemalt, keine Verzögerung - Ich verkaufe nur meine Produkte in Elif Kaya Profil, alle anderen Websites sind gestohlenen alten Versionen, also keine neuen Updates oder Unterstützung. - Lifetime Update kostenlos Gann Gold EA MT5 Einführung Die Theorien von W.D. Gann zur technischen Analyse faszinieren Trader s

Universal Swing Arrows ist ein pfeilbasierter Indikator, der entwickelt wurde, um Swing-Trading-Signale bereitzustellen. Es kann für jedes Handelspaar und jeden Handelszeitrahmen verwendet werden. DIE PFEILE ERSCHEINEN AUF DER AKTUELLEN (0) KERZE. DIE SIGNALE NICHT NEU LACKIEREN! Der Indikator kann als eigenständiges Handelssystem oder als Teil Ihrer persönlichen Handelsstrategie verwendet werden. Der Pfeil des Indikators ist nicht nur ein Signal, sondern auch Ihr mögliches Stop-Loss-Level. Der

Der VWAP-Level-Indikator ist ein technisches Analyseinstrument, das den gewichteten Durchschnittspreis für das gehandelte Volumen eines bestimmten Vermögenswerts berechnet. Der VWAP liefert Händlern und Anlegern den Durchschnittspreis eines Vermögenswerts über einen bestimmten Zeitraum.
Er wird häufig von Anlegern verwendet, um Daten zu "passiven" Handelsgeschäften wie Pensionsfonds und Investmentfonds zu vergleichen, aber auch von Händlern, die überprüfen wollen, ob ein Vermögenswert zu einem
FREE
** Alle Symbole x Alle Zeitrahmen scannen nur durch Drücken der Scanner-Taste ** *** Kontaktieren Sie mich , um Ihnen eine Anleitung zu schicken und Sie in die "M W Scanner-Gruppe" aufzunehmen, damit Sie Ihre Erfahrungen mit anderen Nutzern austauschen und sehen können. Einführung: Double Top (M) und Double Bottom (W) ist eine sehr wiederkehrende gemeinsame Art von Preisumkehrmuster. Double Top ähnelt dem M-Muster und zeigt eine bärische Umkehrung an, während Double Bottom dem W-Muster ähnelt un
Der Candle_Timer_and_Spread-Indikator zeigt auf einem Diagramm die Zeit bis zum Ende der Kerze und den Prozentsatz der Preisänderung zusammen mit dem Spread für die ausgewählten Symbole an.
Der Timer für die Zeit bis zum Ende der Kerze im aktuellen Zeitrahmen und die Preisänderung in Prozent relativ zum Eröffnungspreis des Tages befindet sich standardmäßig in der oberen rechten Ecke des Diagramms. Das Panel zeigt den Spread und die prozentuale Änderung des aktuellen Preises relativ zur Tageser
FREE

Der fehlende Vorteil, den Sie brauchen, um Ausbrüche wie ein Profi zu fangen. Folgen Sie einem Schritt-für-Schritt-System, das die stärksten Ausbrüche erkennt!
Entdecken Sie Marktmuster, die auf der Grundlage einer bewährten und getesteten Strategie massive Gewinne generieren.
Entriegeln Sie Ihren seriösen Vorsprung
Wichtige Informationen hier www.mql5.com/en/blogs/post/723208
Die zuverlässige Expert Advisor Version
Automatisieren Sie Breakout EDGE Signale mit "EA Breakout EDGE" Hier klick

Dieser Indikator wurde entwickelt, um die wahrscheinlichen Umkehrpunkte des Symbolpreises zu finden. Er arbeitet mit einem kleinen Candlestick-Umkehrmuster in Verbindung mit einem Extremwertfilter. Der Indikator wird nicht neu gezeichnet! Wenn der Extremum-Filter deaktiviert ist, zeigt der Indikator alle Punkte an, die ein Muster aufweisen. Wenn der Extremum-Filter aktiviert ist, funktioniert die Bedingung - wenn die Historie Vorherige Balken 1 Kerzen zurück enthält höhere Kerzen und sie sind we
FREE
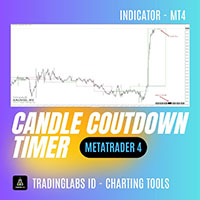
Candle Timer Countdown (CTC) - Minimalistischer & präziser Kerzen-Timer Candle Timer Countdown (CTC) ist ein leichtgewichtiger und nicht aufdringlicher MetaTrader-Indikator, der die verbleibende Zeit der aktuellen Kerze in Ihrem Chart anzeigt. Dieses Tool wurde mit Blick auf Einfachheit und Klarheit entwickelt und hilft Händlern, sich über Kerzenabschlüsse im Klaren zu sein, ohne den Chart zu überladen. Hauptmerkmale: Kerzen-Countdown in Echtzeit
Sie wissen immer, wie viele Sekunden bis zur Schl
FREE

Beschreibung: Dieser Indikator zeichnet die ZigZag-Linie in mehreren Zeitrahmen und sucht auch nach harmonischen Mustern vor der Fertigstellung des Musters.
Merkmale: Fünf Instanzen des ZigZag-Indikators können für jeden gewünschten Zeitrahmen und Input konfiguriert werden. Zeichnen Sie Harmonic-Muster vor dem Abschluss des Musters. Anzeige der Fibonacci-Retracement-Verhältnisse. Konfigurierbare Fibonacci-Retracement-Ratios. Zeichnen Sie AB=CD basierend auf dem von Ihnen definierten Fibonacci
FREE
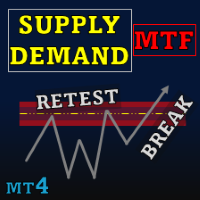
Special offer : ALL TOOLS , just $35 each! New tools will be $30 for the first week or the first 3 purchases ! Trading Tools Channel on MQL5 : Join my MQL5 channel to update the latest news from me Supply Demand Retest and Break Multi Timeframe , dieses Tool zeichnet Angebots- und Nachfragezonen basierend auf starken Momentum-Kerzen und ermöglicht es Ihnen, diese Zonen über mehrere Zeitrahmen hinweg mit der Funktion timeframe selector zu identifizieren. Mit Retest- und Break-La
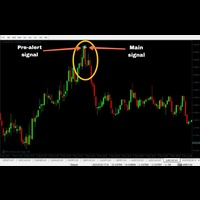
100% nicht nachgemalter MT4 Indikator mit Vorwarnung
Empfohlener Kerzenzeitrahmen M15
Handelsablauf 15 Minuten
Call-Puffer 0
Put-Puffer 1
Intrabar
Vorteile Neuronales Netzwerk Fortschrittliche Preisaktionsalgorithmen Fortgeschrittene Algorithmen zur Trendfilterung Vorgezogener Konsolidierungsfilteralgorithmus
Vorwarnsignale
Non-Delay-Anzeigen
Auto-Trading unterstützt
100% Non Repaint
100% No Lag
Keine Neuberechnung
Lizenz auf Lebenszeit
Nachteile Sehr wenige Signale
Anweisungen zur Verwendu
FREE
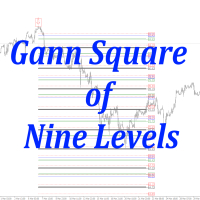
Der einzige Square 9 Indikator seiner Art, der der realen Situation auf Gannzilla entspricht! Der Indikator berechnet die Kursniveaus nach Square 9 und die Termine nach Square 9. Alle Preis- und Zeitniveaus stimmen zu 100% mit der Lage auf Square 9 (Gannzila) überein. Dieses Tool ist eine großartige Lösung zur Bestimmung der Preis- und Zeitebenen nach den Methoden des legendären Händlers William Delbert Gann.

Der Pips Stalker ist ein Long-Short-Pfeil-ähnlicher Indikator, der Trader aller Niveaus hilft, bessere Entscheidungen beim Markthandel zu treffen. Der Indikator übermalt nie neu und verwendet RSI als Hauptsignallogik; sobald ein Pfeil gegeben ist, wird er nie neu lackiert oder zurückgestrichen und die Pfeile sind nicht verzögert.
MERKMALE DES PIPS STALKER-PFEILS :
STATISTIK-PANEL ein einzigartiges Info-Dashboard, das die Gesamtgewinnquote und nützliche Statistiken wie maximale Siege und verlo

Der Block Master Pro-Indikator wurde entwickelt, um visuell Bereiche auf dem Chart zu identifizieren, in denen sich wahrscheinlich bedeutende Volumina von großen Marktteilnehmern konzentrieren. Diese Bereiche, die als Orderblöcke bezeichnet werden, stellen Preisbereiche dar, in denen große Marktteilnehmer ihre Orders platzieren und damit möglicherweise eine Preisumkehr und eine Bewegung in die entgegengesetzte Richtung signalisieren. Hauptmerkmale:
Identifizierung von Orderblöcken: Block Master

Trend Hunter ist ein Trendindikator für die Arbeit am Forex-Markt. Ein Merkmal des Indikators ist, dass er sich selbstbewusst mit dem Trend bewegt, ohne das Signal zu ändern, wenn der Preis die Trendlinie leicht durchbricht. Der Indikator zeichnet nicht neu, das Signal zum Eintritt in den Markt erscheint, nachdem der Balken geschlossen wurde.
Trend Hunter ist ein fairer Indikator. Fahren Sie mit der Maus über das Indikatorsignal, um den potenziellen Gewinn des Signals anzuzeigen.
Für den Hand

Änderung der staatlichen Zustellung (CiSD). Überblick: Der Change in State Delivery (CiSD) ist ein Mikrostrukturindikator, der kritische Wendepunkte identifiziert, an denen der Markt (Preislieferungsalgorithmus) seinen Richtungsfokus von der Suche nach Liquidität auf der einen Seite des Marktes auf die andere Seite verlagert. Insbesondere signalisiert er den Übergang von der kauforientierten Liquidität zur verkaufsorientierten Liquidität. CiSD markiert den genauen Eröffnungskurs, der eine grund
FREE

Extreme Value Sniper ist ein detrendierter Preisindikator Der Indikator findet die potentiellen Umkehrniveaus, indem er Wertbereiche und Preiszyklen überprüft. MT5 Version des Produkts : https://www.mql5.com/en/market/product/114550
Der Indikator zeigt die überkauften und überverkauften Niveaus anhand der durchschnittlichen Spanne an. Überkaufte Levels liegen zwischen 4 und 10 Überverkaufte Niveaus liegen zwischen -4 und -10
Diese Niveaus können als Umkehrniveaus verwendet werden.
Extreme Va

Dieser Indikator ist für Live-Charts und nicht für den Tester vorgesehen. Der PRO Trend Divergence Indikator ist ein fortschrittliches Analysewerkzeug, das Trendfortsetzungs-Divergenzen erkennt – ein Signal, das darauf hinweist, dass der aktuelle Trend voraussichtlich anhalten wird. Im Gegensatz zu herkömmlichen Indikatoren, die auf Trendwenden abzielen, hilft dieser Indikator dabei, Marktphasen zu identifizieren, in denen der Trend trotz kurzfristiger Rücksetzer oder kleiner Korrekturen stark
MetaTrader Market - der einzige Shop, in dem man Handelsroboter als Demoversion herunterladen und testen sowie anhand historischer Daten optimieren kann.
Lesen Sie die Beschreibung und Bewertungen anderer Kunden über das gewünschte Produkt, laden Sie es direkt ins Terminal herunter und erfahren Sie, wie man einen Handelsroboter vor dem Kauf testet. Nur bei uns können Sie ein Programm testen, ohne dafür zu bezahlen.
Sie verpassen Handelsmöglichkeiten:
- Freie Handelsapplikationen
- Über 8.000 Signale zum Kopieren
- Wirtschaftsnachrichten für die Lage an den Finanzmärkte
Registrierung
Einloggen
Wenn Sie kein Benutzerkonto haben, registrieren Sie sich
Erlauben Sie die Verwendung von Cookies, um sich auf der Website MQL5.com anzumelden.
Bitte aktivieren Sie die notwendige Einstellung in Ihrem Browser, da Sie sich sonst nicht einloggen können.