Technische Indikatoren für den MetaTrader 4 - 21

Ein Indikator, der Ihren Kontostand und Ihr Eigenkapital anzeigt. Wirklich einfach zu bedienen, keine besonderen Anforderungen für die Installation. Sie können ihn jedoch nach Ihren eigenen Wünschen konfigurieren.
Das Panel hat 4 Schaltflächen. Nur die aktuelle Schaltfläche zeigt die Informationen des Charts an, mit dem Sie den Indikator verknüpft haben. Wenn diese Option abgewählt ist, werden die Informationen des gesamten Kontos angezeigt. Nur Käufe zeigt nur die KAUF-Aufträge an und Nur Verk
Magic Channel ist ein Kanalindikator für das MetaTrader 4 Terminal. Dieser Indikator ermöglicht es, die wahrscheinlichsten Trendumkehrpunkte zu finden. Im Gegensatz zu den meisten Channel-Indikatoren wird Magic Channel nicht neu gezeichnet. Das Alarmsystem (Alerts, E-Mail und Push-Benachrichtigungen) hilft Ihnen, mehrere Handelsinstrumente gleichzeitig zu überwachen. Hängen Sie den Indikator an ein Diagramm an, und der Alarm wird ausgelöst, sobald ein Signal auftaucht. Mit unserem Alarmsystem ve

Optimale Strategie
Seien Sie Ihr Handelsassistent MT Merit Candle Count :
Der Indikator wurde für den Handel mit binären Optionen entwickelt und zählt die Anzahl der bullishen oder bearishen Candlesticks. Er eignet sich sowohl für Martingale- als auch für Standard-Handelsstrategien.
Er ist ideal für erfahrene Händler und für den Forex-Handel geeignet, da er hilft, das Volumen abzuschätzen und Trends oder potenzielle Umkehrungen im Chart zu erkennen. Indikator für Trader, die den manuellen Hand
FREE

wurde entwickelt, um die visuelle Darstellung von Finanzdiagrammen in MetaTrader 4 zu verbessern, indem die Farben verschiedener Diagrammelemente, einschließlich Candlesticks, Balken, Liniendiagrammen und Volumenbalken, dynamisch geändert werden. Sein Hauptzweck ist es, die Intuition und das Engagement des Händlers während der Marktanalyse zu verbessern, indem sanfte, zyklische Farbübergänge eingeführt werden, die Momentumverschiebungen, Trends oder Volatilität hervorheben können, ohne die Anze
FREE
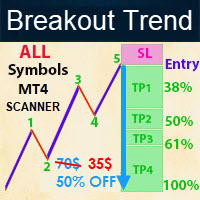
- Real Preis ist 70$ - 50% Rabatt (Es ist 35$ jetzt) Kontaktieren Sie mich für Anleitungen, alle Fragen! - Lebenslanges Update kostenlos - Nicht nachgemalt - Ich verkaufe nur meine Produkte in Elif Kaya Profil, alle anderen Websites sind gestohlenen alten Versionen, also keine neuen Updates oder Unterstützung. Einführung Breakout Trend Scanner Indikator arbeitet auf der Grundlage der Elliott-Welle in der technischen Analyse beschreibt Preisbewegungen auf dem Finanzmarkt, die mit Veränderungen i

Einführung in den universellen Segmentierungsindikator: Die universelle Liniensegmentierung basiert auf zwei ineinander verschlungenen Durchschnittswerten, die sich an der goldenen und der toten Gabel als Standard orientieren, wobei die Hoch- und Tiefpunkte auf beiden Seiten der goldenen und der toten Gabel miteinander verbunden sind, um sich zu einer Liniensegmentierung zu öffnen. Dieser Indikator kann auf verschiedene Parameter der Multi-Level-gestapelt verwenden eingestellt werden. Das Prinz
FREE
AP Tag-Woche-Monat Hoch-Tief MT4
Leichtes Overlay, das die Höchst-/Tiefstwerte des Vortags, der Woche und des Monats auf einem beliebigen Chart anzeigt. Hervorragend geeignet für die Planung von Sitzungen, Zusammenflüsse und Warnungen, wenn der Kurs zu wichtigen Swing-Levels zurückkehrt.
Was es kann Zeichnet 6 Linien: Höchst-/Tiefstkurs des Tages, Höchst-/Tiefstkurs der Woche, Höchst-/Tiefstkurs des Monats (aus den letzten abgeschlossenen Sitzungen).
Berührungs- und Annäherungswarnungen, wen
FREE

Entfesseln Sie Ihr Handelspotenzial mit dem Goldenen Fraktalkreuz Sind Sie es leid, Ihre Trades immer wieder in Frage zu stellen? Hätten Sie gerne ein klares, zuverlässiges System, das Sie bei Ihren Entscheidungen unterstützt? Wir stellen Ihnen den Goldenen Fraktal-Kreuz vor - einen leistungsstarken und benutzerfreundlichen Indikator, der Ihnen hilft, Handelsmöglichkeiten mit hoher Wahrscheinlichkeit zu erkennen. Es handelt sich hierbei nicht um einen weiteren Durchschnittsindikator, sondern um
FREE

Wie verwendet man die Pair Trading Station? Die Pair Trading Station wird für den H1-Zeitrahmen empfohlen und Sie können sie für alle Währungspaare verwenden. Um Kauf- und Verkaufssignale zu generieren, befolgen Sie die folgenden Schritte, um die Pair Trading Station auf Ihrem MetaTrader-Terminal anzuwenden. Wenn Sie die Pair Trading Station auf Ihren Chart laden, wird die Pair Trading Station die verfügbaren historischen Daten auf Ihrer MetaTrader-Plattform für jedes Währungspaar auswerten. Auf

Heiken Ashi Toggle - Sofortige Kontrolle des Chartmodus für MT4 Heiken Ashi Toggle (auch Heikin Ashi genannt) ist ein kleiner Hilfsindikator für MetaTrader 4, der Heiken Ashi-Kerzen darstellt - mit einem entscheidenden Vorteil: sofortige EIN/AUS-Steuerung direkt im Chart . Anstatt ständig Indikatoren hinzuzufügen, zu entfernen oder neu zu laden, ermöglicht dieses Tool Händlern, mit einem einzigen Klick zwischen der Standard-Candlestick- und der Heiken Ashi-Darstellung zu wechseln. Was dieser Ind
FREE

BeST_Gann Swing Oscillator ist ein MT4-Indikator, der auf der entsprechenden Arbeit von Robert Krausz basiert, der ihn in seinem Buch " A.W.D Gann Treasure Discovered " vorstellte .
Der Gann Swing Oscillator ist ein bereichsbegrenzender technischer Indikator, der zwischen +1 und -1 oszilliert und somit die Marktschwankungen beschreibt.
Im Allgemeinen beschreibt der Gann Swing Oscillator, wenn sich der Markt in einem Aufschwung befindet, diesen als 2 höhere Hochs mit dem Wert von +1, während nac

Der Multi-Trendlinien-Indikator zeichnet automatisch die dominanten Trendlinien auf dem aktuellen Chart. Der Indikator sucht nach den 5 besten Aufwärtstrends und den 5 besten Abwärtstrends zum aktuellen Kurs und zeichnet jede Trendlinie, wenn die Filterbedingungen erfüllt sind. Die Trendlinien werden mit "Trendline "+[Richtung]+Symbol()+TrendlineSequenceNumber Zum Beispiel: Die zweite Aufwärtstrendlinie auf einem EURUSD-Diagramm würde "TrendlineUpEURUSD2" heißen. Um ihren aktuellen Wert zu erhal
FREE

Heiken Ashi-Schaltfläche Heiken-Ashi , oft auch Heikin-Ashi geschrieben, ist ein japanisches Wort und bedeutet "Durchschnittsbalken". Der Heiken-Ashi-Ansatz kann in Verbindung mit Candlestick-Charts verwendet werden, um Markttrends zu erkennen und künftige Kurse vorherzusagen. Er ist nützlich, um Candlestick-Charts leichter lesbar zu machen und Muster zu analysieren. Mit Hilfe von Heiken-Ashi-Diagrammen können Händler bestimmen, wann sie bei einem anhaltenden Trend im Handel bleiben und bei ein
FREE
Benutzerdefinierte Kerze - Multi-Timeframe-Visualisierung Die Analyse mehrerer Timeframes ist für präzise Handelsentscheidungen unerlässlich, aber der Wechsel zwischen den Charts kann unbequem und ineffizient sein. Der Custom Candle-Indikator löst dieses Problem, indem er Kerzen mit höherem Zeitrahmen (HTF) direkt in Ihren Chart mit niedrigerem Zeitrahmen (LTF) einblendet. So können Sie das Gesamtbild auf einen Blick sehen, sich am übergeordneten Trend orientieren und die Handelsgenauigkeit verb
FREE
STOCH UND RSI ALERT https://www.mql5.com/en/users/earobotkk/seller#products (Ich habe ein Dashboard von diesem Produkt erstellt, bitte schauen Sie es sich an, indem Sie hier klicken) (Ich habe auch einen EA von diesem Produkt erstellt, JETZT kann der Benutzer zur Automatisierung übergehen, klicken Sie hier ) P/S: Wenn Ihnen dieser Indikator gefällt, bewerten Sie ihn bitte mit 5 Sternen in der Bewertungssektion, dies wird seine Popularität erhöhen, so dass andere Benutzer von seiner Verwendung pr
FREE
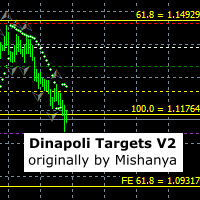
Dieser Indikator setzt Stopp-, Start- und Zielniveau 1, 2 und 3 auf der Grundlage von erkannten Marktschwankungen auf mehreren Zeitrahmen. Er wurde ursprünglich von Mishanya geschrieben und von Ramoletane aktualisiert, um sich mit dem Preis zu bewegen und die Levels automatisch zu aktualisieren. Ein Handel kann platziert werden, wenn der Preis die weiße Startlinie überschritten hat, und der Stop-Loss kann auf der roten Stop-Linie platziert werden. Die Losgröße kann beim grünen Ziel-1-Niveau, bei
FREE

Wenn die Preise ausbrechen Widerstandsniveaus sind mit Larry Williams' Percentage Range "WPR" Oszillator kombiniert bricht aus seiner historischen Widerstandsniveaus dann Wahrscheinlichkeit entsteht, um weitere Preise zu erfassen. Es wird dringend empfohlen, Preisausbruch mit Oszillator Ausbruch zu bestätigen, da sie vergleichbare Auswirkungen auf den Preis brechen Unterstützungs-und Widerstandsniveaus haben; sicherlich, kurze Trades wird die gleiche Wahrnehmung haben. Das Konzept basiert darauf
FREE
Fractals Direction ST Patterns MT4 ist eine Abwandlung des Fractals-Indikators von Bill Williams, bei dem Sie eine beliebige Anzahl von Balken für die Ermittlung eines Fraktals angeben können. In den Einstellungen kann auch die Anzahl der Punkte zur Bestimmung der Trendrichtung festgelegt werden. Die Aufwärtsrichtung wird bestimmt, wenn das letzte obere Fraktal höher ist als das vorletzte obere Fraktal. Die Abwärtsrichtung wird festgelegt, wenn das letzte untere Fraktal niedriger ist als das vor
FREE

Informativer & optimierter Zickzackkurs, kumuliertes Volumen, Preisänderung Eine Neufassung des traditionellen Zickzack-Tools mit neuen Zusätzen. Eigenschaften:- Optimierter Code Anzeige des kumulierten Volumens zwischen den Spitzenwerten Zeigt die Preisveränderung zwischen den Spitzenwerten an Verwendung:- Erkennen von Trendschwankungen Identifizierung von Schwankungen mit hohem Volumen Vergleichen von Preisänderungen zwischen Schwankungen Zeichnen des Fibonacci-Tools bei starken Preisänderunge
FREE
Es ist ein Werkzeug für die technische Analyse. Es erlaubt Ihnen, Messungen durchzuführen: Fibo, einschließlich der Suche nach Clustern Fibo Ebenen (durch die DiNapoli-Methode) Überschreitung des Gleichgewichts Trendlinie Auswahl der S/D-Levels
Eingabeparameter Trend_Color - Farbe der Trendlinie Trend_Width - Breite der Trendlinie Trend_info - wenn true, werden neben der Trendlinie zusätzliche Informationen angezeigt (low, high, medium der Trendlinie) Trend_info_color_up_dn - Farbe des Textes,

aktualisiert versteckte Markt Unterstützung und Widerstand. Dieser Indikator ist für neue aktuelle Markt, die neue Unterstützung und Widerstand, dass einige Händler kämpfen zu sehen hat gemacht. Der Indikator funktioniert auf allen Zeitrahmen von der 1-Minuten-Zeitrahmen, um die monatliche Ein Trading-Tipp zur Verwendung Wenn sich der Kurs am Widerstand befindet und der Indikator erscheint, warten Sie auf den Abschluss einer bärischen Kerze und handeln Sie dann mit einem Verkauf. Das Gleiche
FREE
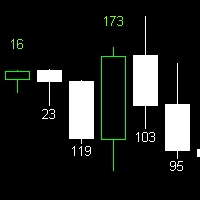
Indikator für Kerzengröße Erforschen Sie die Kerzengröße mit diesem praktischen Indikator. Er funktioniert in verschiedenen Zeitrahmen und liefert wertvolle Erkenntnisse für die technische Analyse. Hauptmerkmale: Zeigt die Größe der Kerze nach der Konfiguration des Indikators an. Kompatibel mit allen Timeframes. Die Kerzengröße ist eine wichtige Kennzahl in der technischen Analyse, die Aufschluss über die Marktstärke und die Volatilität gibt. Dieser Indikator ermöglicht eine klare und genaue Vis
FREE

Der MACD ist ein bekannter Indikator, der immer noch zur Vorhersage der Kursentwicklung in den nächsten Minuten, Stunden oder sogar Wochen verwendet werden kann. Mit farbigen bar von Macd, Ihre Augen können leicht zu fangen, wenn die Farbe geändert wird, was Marktpreis Bewegung zu finden, eine frühe Trend auf dem Markt. Hier sind die Parameter des Indikators: TF_MACD , Standard ist 1 Stunde , dies bedeutet, dass Sie MACD von 1 Stunde TimeFrame auf Lower TimeFrame deutlich sehen können. InpPrice
FREE

Erkennen Sie Muster sofort mit unserem fortschrittlichen Handelsindikator Möchten Sie wichtige Candlestick-Muster wie Engulfing, Doji, Marubozu, Harami, Hanging Man, Shooting Star, Evening Star, Hikkake, Dark Cloud Cover oder Black Crow sofort erkennen, wenn sie sich bilden? Mit diesem leistungsstarken Indikator können Sie alle 28 Währungspaare in Echtzeit überwachen und erhalten sofortige Warnungen, sobald eines dieser entscheidenden Muster erkannt wird. Hauptmerkmale: Echtzeit-Warnungen: Sie w
FREE

Der Indikator TwoMA Crosses zeigt Pfeile an, die darauf basieren, ob der kurzfristige gleitende Durchschnitt über oder unter dem langfristigen gleitenden Durchschnitt kreuzt. Ein gleitender Durchschnitt sagt nicht die Kursrichtung voraus. Stattdessen definiert er die aktuelle Richtung. Trotzdem verwenden Anleger gleitende Durchschnitte, um das Rauschen herauszufiltern. Händler und Investoren neigen dazu, den EMA-Indikator zu verwenden, vor allem in einem sehr volatilen Markt, da er empfindliche
FREE

Der Indikator basiert auf dem klassischen CCI-Indikator. Ich empfehle, meinen Berater zu beobachten - Night Zen EA Zeichnet seine Signale nicht neu. Es gibt Alarme für das eingehende Signal. Er enthält 2 Strategien: Eintritt der CCI-Linie in die überkaufte Zone (für Kauftrades ) / in die überverkaufte Zone (für Verkaufstrades ) Ausstieg der CCI-Linie aus dem überkauften Bereich (für Verkaufstrades) / aus dem überverkauften Bereich (für Kauftrades)
Einstellungen: Name Einstellung Beschreibung Ze
FREE

Merkmale:
1- Erhalten Sie OB/OS Levels von Golden MA Levels
2- Warten Sie auf Buy/Sell Start Level Cross
3- Optional: Sollte der Preis das Mid Level in früheren Bars kreuzen
4- Optional: Crossing bar High/Medium Volume
5- Optional: MA Stacked zur Überprüfung des Auf-/Abwärtstrends für die aktuelle TF
6- Optional: NRTR höhere Zeitrahmen ausgerichtet Check
Detaillierter Blogbeitrag erklärt: https://www.mql5.com/en/blogs/post/758457
Levels mit Puffern sind hier verfügbar: Golden MA Levels Indika
FREE

Basierend auf dem berühmten und nützlichen Indikator - Super Trend, fügen wir einige Funktionen hinzu, um diesen Indikator viel einfacher zu benutzen und leistungsfähiger zu machen. Einfaches Erkennen des Trends in jedem Chart. Sowohl für Scalping als auch für Swing geeignet Besser geeignet für den Einsatz in trendigen Märkten Seien Sie vorsichtig in Seitwärtsmärkten, er könnte einige falsche Signale liefern Einstellung : ATR-Multiplikator ATR-Zeitraum ATR Max Bars (Max 10.000) UP/DOWN-Knoten an
FREE

Der Indikator "Yesterday High Low" für die Handelsplattform MetaTrader 4 (MT4) ist ein leistungsstarkes Tool, das Händlern hilft, die wichtigsten Kursniveaus des vorangegangenen Handelstages zu identifizieren. Dieser Indikator bietet eine visuelle Darstellung der Höchst- und Tiefstkurse, der Hoch-/Tiefstpreis-Durchschnittswerte und der mittleren Durchschnittswerte auf dem Chart.
Dieser Indikator wird in erster Linie von institutionellen und professionellen Händlern verwendet und bietet einen s
FREE
Beherrschen Sie den Markt mit dem Laguerre Edge Signal Indicator! Hören Sie auf zu raten und fangen Sie an, mit Vertrauen zu handeln! Unser Laguerre Edge-Indikator ist Ihr ultimatives Werkzeug, um Einstiegspunkte mit hoher Wahrscheinlichkeit zu erkennen. Dieser Indikator kombiniert die Stärke zweier klassischer Analysemethoden - gleitende Durchschnitte für die Trendrichtung und den Laguerre RSI für die Erkennung von Umkehrpunkten - die alle durch die solide EMA 200 Trendlinie gefiltert werden.
FREE

Der Indikator zeigt den Nulldurchgang des gleitenden Durchschnitts des Oszillators (OsMA) in Form von Pfeilen an. Der Indikator benachrichtigt über ein Signal durch ein Pop-up-Alarm-Fenster oder durch das Senden einer Benachrichtigung per E-Mail.
Parameter Schneller EMA Zeitraum - schneller EMA. Dies ist ein exponentieller gleitender Durchschnitt eines Preises mit einer kurzen Periode. Langsamer EMA Zeitraum - langsamer EMA. Hierbei handelt es sich ebenfalls um einen exponentiell gleitenden Dur
FREE

Advanced indicator of a professional trader - ist ein professioneller Indikator, der auf dem beliebten Stochastik Oszillator basiert. Advanced indicator of a professional trader ist ein Oszillator mit dynamischen überkauften und überverkauften Niveaus, während diese Niveaus beim Standard-Stochastik-Oszillator statisch sind und sich nicht verändern. Dies ermöglicht es dem Advanced indicator of a professional trader, sich an den sich ständig verändernden Markt anzupassen. Wenn ein Kauf- oder Verk
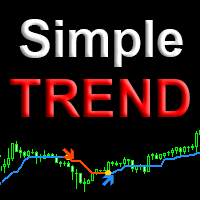
Simple Trend ist eine professionelle Version des Trendindikators und der Einstiegspunkte. Er verwendet Preisaktionen und einen einzigartigen Filteralgorithmus, um den Trend zu bestimmen. Zeigt die Änderung der Richtung der Preisbewegung bei beliebigen Währungspaaren an, ohne das Ergebnis neu zu zeichnen. Geeignet für die Bestimmung von Einstiegspunkten für Scalping und Swing, sowie für Intraday, mittelfristigen Handel. Merkmale Markiert Orte und Richtungen von Trendwenden. Geeignet für alle Art

Tägliche Pivot-Punkte sind beim Handel relativ wichtig. Dieser Indikator verfügt über Optionen zur Auswahl von 5 häufig verwendeten Pivotpunktberechnungen. Benutzereingabe Wählen Sie die Pivotpunkt-Berechnung (Methode Classic, Methode Camarilla, Methode TomDeMark, Methode Fibonacci oder Methode Woodies ) . Wählen Sie den angewandten Zeitrahmen für die Berechnung (M5, M15, H1, H4, D1, W1 usw.) Kann mit jedem Zeitrahmen verbunden werden Wählen Sie die Farbe des Pivot-Punktes Für die MT5 Version, b
FREE

Dieser Trend-Scanner-Indikator verwendet zwei Hauptindikatoren, um Trends zu erkennen. Zunächst die EMAs, die einen Überblick über das Bullish/Bearish-Momentum geben. Wenn der kürzere EMA (berechnet auf der Grundlage aktuellerer Kursbewegungen) den langsameren EMA (berechnet auf der Grundlage längerer Kursbewegungen) kreuzt oder darüber liegt, deutet dies darauf hin, dass sich der Markt in einem Aufwärtstrend befindet. Zweitens der Stochastik RSI: Wenn der RSI < 20 ist, gilt er als überverkauft
FREE

Touch VWAP ist ein Indikator, der es Ihnen ermöglicht, einen volumengewichteten Durchschnittspreis (VWAP) zu berechnen, indem Sie einfach die Taste "w" auf Ihrer Tastatur drücken und dann auf die Kerze klicken, die Sie berechnen möchten. Wenn Sie unter der Kerze klicken, wird der VWAP auf der Grundlage des Tiefstpreises mit dem Volumen berechnet, Wenn Sie auf den Kerzenkörper klicken, wird der VWAP auf der Grundlage des Durchschnittspreises und des Volumens berechnet, und wenn Sie auf die Kerze
FREE

Suchen Sie nach einem Einstieg mit geringem Risiko für den Handel mit dem Lisek Waves Indicator. Mit dem Lisek Waves Indicator können Sie Ihre Handelsleistung verbessern. In seiner einfachsten Form erleichtert dieses Trading-Tool die Suche nach einem Einstieg mit geringem Risiko und die Verwaltung Ihres Handels und Risikos. Die Lisek-Wellen-Analyse basiert auf der Vorstellung, dass Märkte bestimmten Mustern folgen, die als Wellen bezeichnet werden und das Ergebnis eines natürlichen Rhythmus der
FREE
Wie die meisten Dinge, die beim Handel funktionieren, ist es wirklich einfach. Es ist jedoch eines der leistungsstärksten Instrumente, die mir zur Verfügung stehen und die den Einstieg in viele Systeme sehr viel präziser machen.
Im Wesentlichen misst es die jüngste Volatilität im Vergleich zum mittelfristigen Durchschnitt. Wie funktioniert das? Die Märkte neigen zu starken Trendbewegungen, wenn die relative Volatilität niedrig ist, und zu einer Mittelwertumkehr, wenn die relative Volatilität ho
FREE

Es ist nun nicht mehr notwendig, die Volatilität auf Websites von Drittanbietern zu überprüfen, um die durchschnittliche Bewegungswut eines bestimmten Währungspaares zu ermitteln. Der Indikator Truly Volatility dient zur Bestimmung der Volatilität für den angegebenen Zeitraum und wird in einem separaten Fenster als Histogramm und Linie angezeigt. Wenn der Indikator an ein Diagramm mit dem Zeitrahmen Н1 angehängt ist, zeigt er die durchschnittliche Kursbewegung für jede Stunde (von 0 bis 23) auf
FREE

Der BinaryFortune-Indikator wurde speziell für den Handel mit kurzfristigen binären Optionen entwickelt und angepasst. Der Algorithmus des Indikators analysiert zahlreiche Faktoren, bevor er ein Signal erzeugt. Der Indikator wird auf herkömmliche Weise installiert. Der Indikator besteht aus einem Informationsfenster, in dem der Name des Handelsinstruments, die Unterstützungs- und Widerstandsniveaus sowie das Signal selbst (KAUFEN , VERKAUFEN oder WARTEN ) angezeigt werden. Ein Signal wird von ei
FREE
Level Box Tool ist ein leistungsstarker und benutzerfreundlicher Indikator für Händler, die technische Analysetools wie Rechtecke und Trendlinien verwenden , um wichtige Unterstützungs-, Widerstands- und Preiszonen zu identifizieren. Dieses Tool vereinfacht und beschleunigt den Prozess der Markierung von Chart-Levels und bietet mit seinem vollständig anpassbaren Panel sowohl visuelle Klarheit als auch Präzision und umfasst jetzt auch Preis-Cross-Warnungen - damit Sie nie wieder ein wichtiges Lev
FREE

Wollten Sie schon immer einmal einen Trend genau dann erkennen, wenn er beginnt? Dieser Indikator versucht, die Höchst- und Tiefststände eines Trends zu ermitteln. Er verwendet integrierte Indikatoren und untersucht deren Umkehrmuster. Er kann nicht allein verwendet werden, sondern benötigt die Stochastik(14) zur Bestätigung des Signals. Rot für Verkauf, Blau für Kauf. Es sind keine Parameter erforderlich, einfach an ein Diagramm anhängen und es ist bereit zu gehen. Sehen Sie sich andere großart
FREE
Hören Sie auf, Trends zu verfolgen, und fangen Sie an, Umkehrungen zu erkennen: Der Stochastic Sniper stellt sich vor Haben Sie es satt, seitwärts laufende Märkte zu handeln oder von falschen Ausbrüchen überrascht zu werden? Der Stochastic Sniper Indikator wurde für einen präzisen Einstieg entwickelt. Er kombiniert die Volatilitätskanäle der Keltner-Bänder mit dem Momentum-Timing des Stochastik-Oszillators , um extreme Preisumkehrungen mit hoher Genauigkeit zu erkennen. Stellen Sie sich vor, Si
FREE
MA Kreuzungsindikator (Auto-Optimizing MA)
Dieser Indikator wählt automatisch die besten Zeiträume für gleitende Durchschnitte (MA) und zeigt die profitabelsten Kombinationen direkt im Chart. Signale:
• Kauf: Schnelle MA kreuzt die langsame von unten nach oben.
• Verkauf: Schnelle MA kreuzt die langsame von oben nach unten. Hauptfunktionen:
• Automatische Optimierung der MAs.
• Klare Gewinnanzeige an den Kreuzungspunkten.
• Spart Zeit und liefert sofort handelbare Signale. Mit diesem Indikator
FREE
Hochgradig konfigurierbarer Bollinger Bands Indikator. Merkmale: Hochgradig anpassbare Alarmfunktionen (bei Levels, Kreuzen, Richtungsänderungen per E-Mail, Push, Sound, Popup) Multi-Timeframe-Fähigkeit Farbanpassung (bei Niveaus, Kreuzen, Richtungswechseln) Option für lineare Interpolation Funktioniert im Strategie-Tester im Multi-Timeframe-Modus (auch am Wochenende ohne Ticks) Parameter:
Bollinger Bands Timeframe: Sie können den unteren/höheren Zeitrahmen für Bollinger Bands festlegen. Bollin
FREE
Klassische ZigZag-Formel. Aber keine Lags und Repaints. Sie können auf den Screenshots sehen, dass es Werte zwischen den Spitzen zeigt und es ist nützlich, um Strategien zu testen, die auf dem Indikator basieren. Denn manchmal finden die Leute eine gute Idee, verstehen aber nicht, dass bei Repainting-Indikatoren einige Dinge zu beachten sind. Die Parameter sind die gleichen wie beim ursprünglichen ZigZag-Indikator: Tiefe, Abweichung und Rückschritt.
FREE
Das Skript versucht, die Gesamtrichtung des Marktes zu bestimmen, indem es geglättete Heiken Ashi-Kerzen verwendet. Das Einfärbesystem (mit hellen und dunklen Farben) ist ein Versuch, starke und schwache Marktbedingungen zu erkennen. Das Skript verfügt auch über einen Oszillator
Dies sind die Merkmale: Alarmbedingungen Funktionen: Sie können jetzt Alarme im Alarm-Dialog für Ereignisse wie Trendwechsel, Trendverstärkung und -abschwächung einstellen; sowohl für Bullen- als auch für Bären-Trends.
FREE

BeST_Darvas Boxes ist ein MT4-Indikator, der auf der Handelsmethode basiert, die in den 50er Jahren von dem Ungarn Nicolas Darvas entwickelt wurde. BeST_Darvas Boxes Indikator zeichnet das Top und das Bottom jeder Darvas Box, die auf dem aktuellen Chart bestätigt werden kann. zeichnet Kauf- und Verkaufspfeile für jeden bestätigten Ausbruch nach oben oder unten aus den oben genannten Levels. zeichnet immer erst nach dem Bar-Closing und ist somit nicht repainting oder backpainting .
Hinweis : Je
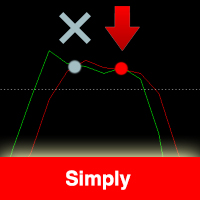
Der Indikator basiert auf dem Stochastik-Indikator. I also recommend to see my EA Night Zen Strategie: Er enthält eine Strategie für das Kreuzen der K- und D-Linien im überkauften (für Verkäufe) und überverkauften (für Käufe) Bereich. Der Indikator gibt ein Signal beim zweiten Schnittpunkt.
Die Signale werden nicht neu geschrieben, sondern erscheinen nach der Bestätigung des Schnittpunkts der K- und D-Linien.
Einstellungen: Einstellungen des Stochastik-Indikators Zeitraum des Indikators Eins
FREE
Mit diesem Indikator können Sie ganz einfach den Trend verfolgen und mit ihm handeln. Die Trendrichtung wird durch einen Kreis und eine Linie angezeigt. Hervorragend geeignet für Kanäle. Verfügt über eine Warnfunktion.
Der Parameter TrendPeriod kann nach Ihren Wünschen geändert werden. Wie zu verwenden: Einfach an ein beliebiges Diagramm anhängen. Blauer Kreis plus blaues Linienkreuz unter dem Kurs = Kaufen. Roter Kreis plus rotes Linienkreuz über dem Preis = Verkaufen. Die besten Ergebnisse erz
FREE

Dieser Indikator zeigt ein komplettes Tick-Chart mit zwei optionalen gleitenden Durchschnitten an und macht die Beachtung von Sub-M1-Kursdaten wirklich einfach. [ Installationsanleitung | Update-Anleitung | Fehlerbehebung | FAQ | Alle Produkte ] Preisspitzen leicht erkennen Die blaue Linie ist der Briefkurs Die rote Linie ist der Geldkurs Der Indikator verliert keine Tickdaten, wenn er neu geladen wird Er implementiert zwei optionale gleitende Durchschnitte Der Indikator wird nicht neu gezeichne
FREE

Was ist G Force Trend? G Force Trend ist ein Indikator für die technische Analyse, der für die Plattform MetaTrader 4 entwickelt wurde. Er analysiert die Kursbewegungen, um die Trendrichtung zu erkennen und generiert Kauf-/Verkaufssignale. Der Indikator erstellt einen dynamischen Kanal, um das Preisverhalten innerhalb des Kanals zu verfolgen und Trendänderungen zu visualisieren. Was macht er? Trend-Erkennung : Bestimmt, ob sich der Kurs in einem Aufwärts- oder Abwärtstrend befindet. Kauf-/Verkau
FREE
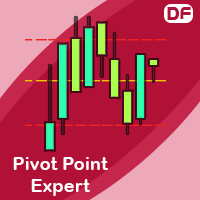
Dieser Indikator berechnet Unterstützungs- und Widerstandskurse in Multi-Timeframe mit unterschiedlicher Formulierung und zeichnet sie auf dem Chart, den Sie wählen. Und wenn Sie wollen, kann der Indikator Sie warnen, wenn der aktuelle Preis diese Pivot-Levels erreicht. Formulierungen: Classic, Camarilla, Woodie, Demark, Floor, Fibonacci
Alarmoptionen: Mobil Nachricht senden, E-Mail senden, Nachricht anzeigen, akustische Warnung
Levels: PP, S1, S2, S3, S4, S5, R1, R2, R3, R4, R5, TC, BC und Midd
FREE

Ich empfehle Ihnen, den Blog des Produkts (Handbuch) von Anfang bis Ende zu lesen , damit von Anfang an klar ist, was der Indikator bietet . Dieser Indikator mit mehreren Zeitrahmen und Symbolen identifiziert doppelte Top/Bottom-, Kopf-Schulter- , Wimpel/Dreieck- und Flaggenmuster. Es ist auch möglich, Alarme nur dann einzurichten, wenn ein Nackenlinie-/Dreieck-/Flaggenpol-Ausbruch stattgefunden hat (Nackenlinie-Ausbruch = bestätigtes Signal für Top/Bottom und Head & Shoulder). Der Indikator ka
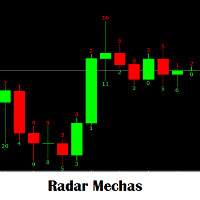
Indikator, der dazu dient, die Größe des Dochts zu sehen, der die Kerzen entsprechend der Größe verlässt, die eine Warnung zur manuellen Eingabe erzeugt. Nutzen Sie es maximal aus, dass eine Strategie Lücken in der Größe des Dochts der vorherigen Kerze oder derselben aktuellen Kerze aufwirft. eingeben, um zu kaufen und zu verkaufen. Es ist ein Indikator, der für jede Analyse erforderlich ist, die für einen neuen Eintrag vorgenommen wird. Es wird Ihr Lieblingswerkzeug sein.
FREE
Der MACD 2-Linien-Indikator ist eine leistungsstarke, aktualisierte Version des klassischen Moving Average Convergence Divergence (MACD)-Indikators.
Dieses Tool ist die Verkörperung von Vielseitigkeit und Funktionalität und kann sowohl Anfängern als auch fortgeschrittenen Händlern umfassende Markteinblicke liefern. Der MACD 2-Linien-Indikator für MQL4 bietet eine dynamische Perspektive der Marktdynamik und -richtung durch klare, visuell überzeugende Charts und Echtzeitanalysen.
Metatrader5 Vers
FREE

Der Candle-GAP- Indikator ist ein unverzichtbares Tool für Händler, die Gap-Trading-Strategien nutzen, da er automatisch Candle-Gaps für jeden Wochentag identifiziert. Eine Lücke bezieht sich auf einen Preisniveauunterschied zwischen dem Schluss- und Eröffnungskurs zweier aufeinanderfolgender Tage. Dieser Indikator erkennt vier Arten von Lückenmustern: Häufig, Abbruch, Fortsetzung und Erschöpfung. Durch die Integration dieses Indikators in jedes Diagramm können Händler ihre Signale valid
FREE

Symmetrical Triangle Pattern Indikator - Trend-Erkennung in MetaTrader meistern Nutzen Sie die Möglichkeiten der Trenderkennung mit dem "Symmetrical Triangle Pattern" Indikator für MetaTrader. Dieses innovative Tool vereinfacht die Erkennung von symmetrischen Dreiecksmustern und liefert Händlern klare Signale für eine mögliche Trendfortsetzung oder -umkehr. Verbessern Sie Ihre Handelsstrategien mit diesem MQL-Angebot. Hauptmerkmale : Genaue Mustererkennung : Der Symmetrical Triangle Pattern Indi
FREE

Indikator-Übersicht Der Final Gold Cup ist ein komplettes Handelssystem, das die technische Analyse vereinfacht. Er kombiniert die leistungsstärksten Handelsinstrumente in einem benutzerfreundlichen Paket, das Ihnen einen kristallklaren Blick auf das Kursgeschehen ermöglicht und Ihnen hilft, fundierte Handelsentscheidungen zu treffen. Der Indikator arbeitet effizient über alle Vermögenswerte und Zeitrahmen hinweg. [ Illustratives Bild des Indikators auf dem Chart ] Hauptmerkmale Dynamische Unte

MT5-Version Überblick
Der Lowess-Channel-Indikator ist ein geglättetes Trendfolge-Tool, das Händlern helfen soll, die Trendrichtung zu identifizieren, flache oder schwankende Märkte zu erkennen und Ausbrüche aus Konsolidierungszonen zu erkennen. Er erzeugt eine zentrale geglättete Linie mit oberen und unteren Kanalgrenzen, die sich den Marktgeräuschen anpasst und dabei klar bleibt. Wie funktioniert er? Der Indikator bildet einen Kanal um eine geglättete Kurslinie. Die zentrale Linie spiegelt d
FREE

Session Killzone Indikator
Indikator, der Ihnen hilft, die Killzone-Zeiten der Londoner und New Yorker Sitzungen zu identifizieren, die in der Regel die Zeiten hoher Volatilität und des Liquiditätsentzugs auf dem Markt sind. Die Killzone-Zeiten sind über die Indikatorparameter konfigurierbar. Der Indikator passt den Bereich der Killzones auf der Grundlage der täglichen Handelsspanne an.
FREE

Die kostenlose Version des Hi Low Last Day MT4 Indikators . Der Hi Low Levels Last Day MT4 Indikator zeigt das Hoch und das Tief des letzten Handelstages . Sie haben die Möglichkeit , die Farbe der Linien zu ändern . Testen Sie die volle Version des Hi Low Last Day MT4 Indikators , in welche zusätzliche Indikator Funktionen verfügbar sind : Anzeige des Minimums und des Maximums des vorletzten letzten Tages Anzeige des Minimums und des Maximums der vorangegangenen Woche Ton Alarm beim Überschreit
FREE

Volume Footprint Analysis ist ein präzisionsgefertigter, volumenbasierter Indikator, der das rohe Marktvolumen in ein intuitives, farbcodiertes Signalsystem umwandelt. Dieses Tool, das auf Konzepten der Volume Spread Analysis (VSA) und Smart Money-Prinzipien basiert, macht Schluss mit dem Rätselraten bei der Interpretation des Volumens und liefert Händlern klare, umsetzbare Erkenntnisse darüber, wann sie kaufen oder verkaufen sollten - auf jedem Zeitrahmen und für jedes Handelsinstrument. MT5-Ve
Drawdown-Warnungen Kostenlos! Meta Trader 4 Indikator. Bitte hinterlassen Sie eine Bewertung zu diesem Produkt, damit andere Benutzer davon profitieren können. Dieser Drawdown Alerts Indikator zeigt den Drawdown-Prozentsatz in Echtzeit an und warnt Sie, wenn das von Ihnen festgelegte Limit erreicht ist. Die Berechnung des Drawdowns hängt von der Höhe des Handelssaldos ab. Sie können Drawdown Alerts anpassen für Ecke - Links , Rechts , Oben , Unten X Y Farbe Anzahl der Dezimalstellen Popup-Meldu
FREE
Bleiben Sie dem Marktmomentum voraus mit dem Pip Movement Alert MT4, einem vielseitigen Mehrwährungsindikator, der entwickelt wurde, um präzise Pip-Bewegungen über mehrere Symbole hinweg zu verfolgen und Trader zu benachrichtigen, ideal für den Handel mit Forex, Aktien, Kryptowährungen und Rohstoffen. In Handelsgemeinschaften wie Forex Factory und Reddit’s r/Forex gefeiert und in Diskussionen auf Investopedia und TradingView für seine Fähigkeit, plötzliche Marktveränderungen zu erkennen, hervorg
FREE

Dieser Indikator ist die Grundlage für einen Expert Advisor, den man fast als "Gral" bezeichnen kann. Details siehe unten. Dieser Indikator zeigt die Projektion des Renko-Charts auf den Kurschart an. Diese Projektion wird als gestufte Linie dargestellt, nicht als "Ziegelsteine" (Rechtecke). Siehe Folien 1 und 2. abgekürzter Name des Indikators: LRC - Line of Renko on the price Chart . Das Prinzip seiner Konstruktion ist sehr einfach. Zunächst wird ein Raster aus horizontalen Linien (Levels) mit
FREE

Fraktalindikator für mehrere Zeitrahmen, der den Fraktalpunkt des höheren Zeitrahmens auf den niedrigeren Zeitrahmen anzeigt.
Parameter Fraktal_Zeitrahmen : Sie können die höheren Timeframes für Fraktale festlegen. Maxbar : Sie können die maximale Anzahl von Kerzen für die Berechnungen festlegen. Auf_Fraktal_Farbe, Auf_Fraktal_Symbol, Ab_Fraktal_Farbe, Ab_Fraktal_Symbol : Farb- und Stileinstellungen für die Fraktalpunkte. Linie_erweitern : Zeichnet eine horizontale Linie vom vorherigen Fraktalp
FREE
Erschließen Sie klügere Trades mit Candle Sync Pro! Haben Sie genug von widersprüchlichen Signalen in verschiedenen Zeitrahmen? Hätten Sie gerne einen klareren Überblick über die wahre Richtung des Marktes? "Candle Sync Pro" ist Ihr unverzichtbares Werkzeug, um sichere und fundierte Handelsentscheidungen zu treffen! Dieser leistungsstarke Indikator durchbricht das Rauschen und ermöglicht es Ihnen, das Gesamtbild zu sehen , indem er Kerzen mit höherem Zeitrahmen direkt auf Ihrem aktuellen Chart v
FREE
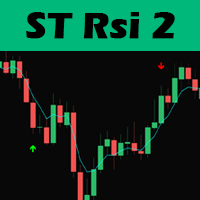
Hallo Trader, diese Handelsstrategie basiert auf der Larry Connors RSI-2 Strategie. Wir beginnen mit einer 200 Perioden EMA um die Richtung des Marktes zu finden. Dies ist wichtig, weil wir nur in der Haupttrendrichtung handeln.
Dann suchen wir nach Pull-Backs, indem wir den RSI mit einer Periode von 2 verwenden, um Einstiegssignale zu erhalten. Der Ausstieg aus dem Handel erfolgt dann anhand des 5 EMA.
Die Losgröße sollte mit 1% von 1 des ATR-Wertes berechnet werden und Positionen können hin
FREE

Dieser Indikator zeichnet automatisch die Unterstützungs- und Widerstandsniveaus (Key Levels) für Sie ein, sobald Sie ihn auf einem Chart abgelegt haben. So müssen Sie diese Niveaus nicht jedes Mal neu zeichnen, wenn Sie die Preise in einem Chart analysieren. Alles, was Sie tun müssen, ist, den Indikator auf ein Diagramm zu legen, die Einstellungen nach Ihren Wünschen anzupassen und ihn den Rest machen zu lassen.
Aber es kommt noch besser: Der Indikator ist absolut kostenlos! Für weitere Informa
FREE
MetaTrader Market bietet jedem Entwickler eine einfache und bequeme Plattform für den Verkauf von Programmen.
Wir unterstützen Sie bei der Veröffentlichung des Produkts und beraten Sie gerne, wie man eine Beschreibung für den Market vorbereitet. Alle Produkte, die im Market verkauft werden, sind durch eine zusätzliche Verschlüsselung geschützt und können nur auf dem Rechner des Kunden gestartet werden. Illegales Kopieren ist ausgeschlossen.
Sie verpassen Handelsmöglichkeiten:
- Freie Handelsapplikationen
- Über 8.000 Signale zum Kopieren
- Wirtschaftsnachrichten für die Lage an den Finanzmärkte
Registrierung
Einloggen
Wenn Sie kein Benutzerkonto haben, registrieren Sie sich
Erlauben Sie die Verwendung von Cookies, um sich auf der Website MQL5.com anzumelden.
Bitte aktivieren Sie die notwendige Einstellung in Ihrem Browser, da Sie sich sonst nicht einloggen können.