Technische Indikatoren für den MetaTrader 4 - 6

"Dieser Indikator erkennt Einträge basierend auf der Bystra-Muster-Theorie und liefert Einstiegswerte zur Platzierung von Limit-Orders mit Ziel- und Stopp-Levels. Dies ermöglicht es Ihnen, Ihr Risikoprozentsatz zu berechnen. Anmerkungen: Dieser Indikator verfügt über Puffer, die seine Verwendung in Expert Advisors (EAs) ermöglichen. Es ist wichtig, beim Arbeiten mit diesem Produkt eine gute Geldverwaltung zu praktizieren. Wenn Sie Ihren Zeitrahmen ändern, wird der Indikator die in Ihrer letzten
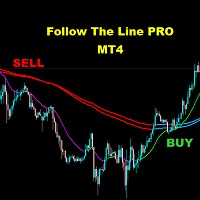
FOLLOW THE LINE (PRO VERSION) Dieser leistungsstarke Indikator ist die vollständige und komplette Version meines kostenlosen Indikators "Follow The Line". Er basiert auf der beliebten Maxime, dass: "THE TREND IS YOUR FRIEND" Er gibt Alarme und Warnungen aller Art aus. Er wiederholt sich nicht und kann für alle Währungspaare und Zeitrahmen verwendet werden.
VERMEIDET FALSCHE SIGNALE:
KAUFEN SIE NUR, wenn der Kurs über der grünen Linie schließt und die grüne Linie über dem blauen Kanal liegt.
VE
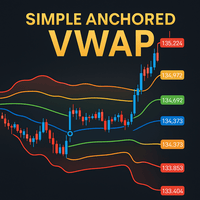
Simple Anchored VWAP ist ein leichtgewichtiges und dennoch leistungsstarkes Tool für Händler, die präzise volumengewichtete Werte ohne Komplexität wünschen.
Mit diesem Indikator können Sie den VWAP an einem beliebigen Punkt des Charts verankern und sofort sehen, wie der Kurs um die institutionellen Volumenbereiche herum reagiert. MT5 Version - https://www.mql5.com/en/market/product/155321/
Lernen Sie Markttiefe - https://www.mql5.com/en/channels/suvashishfx Mithilfe von VWAP-Bändern und dynamis
FREE

Dies ist der beste Unterstützungs- und Widerstandsindikator auf dem Markt, der sowohl bestätigte Unterstützungen und Widerstände als auch Wiederholungen anzeigt. Unterstützung und Widerstand: Die Unterstützung markiert den Punkt, an dem die Kaufnachfrage den Preisrückgang aufhält und als Sicherheitsnetz fungiert. Der Widerstand begrenzt den durch den Verkaufsdruck ausgelösten Preisanstieg. Händler nutzen diese Niveaus zur Vorhersage von Umschwüngen, zur Planung von Ein- und Ausstiegen und zur Ri
FREE

HINTERLASSEN SIE NACH DEM KAUF EINE NACHRICHT ODER BEWERTUNG, UND ICH SENDE IHNEN DEN BONUS-EA-HANDELSASSISTENT! Hypertrend ist ein sehr leistungsstarker visueller Indikator, der die Kerzen je nach Stärke des Trends einfärbt. KEINE NEUFARBE!
Funktioniert mit allen Paaren und Zeitrahmen! Sehen Sie sich die Screenshots (GIF) an!
Es werden spezielle Filter und Oszillatoren verwendet, um den Trend für Sie zu finden, sodass Sie nichts weiter tun müssen, als sich das Diagramm anzusehen!
Einstellun
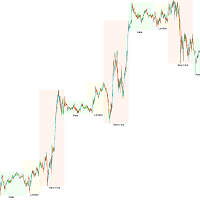
Trading Session KillZone — Entfesseln Sie die Kraft des Markt-Timings
Erfolgreiche Trader wissen: Timing ist alles. Jede Handelssitzung bringt unterschiedliche Aktivität, Volatilität und Chancen. Damit Sie diese Veränderungen klar erkennen und nutzen können, haben wir den Trading Session KillZone Indikator entwickelt. Dieser Indikator hebt die aktiven Zeiten der asiatischen, Londoner und New Yorker Sitzung hervor und gibt Ihnen ein vollständiges Bild, wann der Markt am lebendigsten ist. Sie kön
FREE

ENGLISH VERSION Buying the Dips – Marketing Description Buying the Dips is a professional oscillator designed to identify market extremes and trend-based pullbacks. Two adaptive quotient lines, visual trend clouds, and optional swing and scalping signals provide clear, non-repainting trading impulses. Suitable for traders who want to identify oversold dips and overbought zones across all markets and timeframes. Technical Description Buying the Dips is built on an advanced quotient engine using
FREE

MT5-Version | Trend Monitor VZ-Indikator | Owl Smart Levels-Indikator | Owl Smart Levels-Strategie | FAQ Die Elliott-Wellentheorie ist eine Interpretation von Prozessen an den Finanzmärkten, die auf einem visuellen Wellenmodell in den Preisdiagrammen beruht. Der Valable ZigZag Indikator zeigt die Wellenstruktur des Marktes an, auf die Sie sich verlassen können, um Handelsentscheidungen zu treffen. Der Valable ZigZag-Indikator ist stabiler und ändert seine Richtung nicht oft wie d
FREE
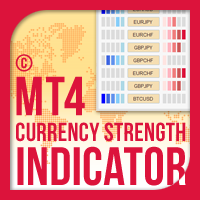
Currency Strength Indicator for MT4 ist eine innovative Lösung für jeden Anfänger oder erfahrenen Trader! Es hebt das Konzept der Währungsstärke auf eine ganz neue Ebene, da es es mit Price Action kombiniert und auf jedes Symbol/Paar angewendet werden kann, abgesehen von den üblichen 28 Kombinationen der 8 Hauptwährungen. Das bedeutet, dass Sie die Stärke oder Schwäche jedes Paares handeln können, einschließlich aller Währungen, Haupt-, Neben- und Exoten, Rohstoffe und Kryptos (keine Indizes).

Die Moving Average Convergence Divergence (MACD) Handelsstrategie ist ein beliebtes technisches Analysewerkzeug, das verwendet wird, um Änderungen im Momentum und in der Trendrichtung zu identifizieren. Der MACD wird berechnet, indem man den 26-Perioden-exponentiellen gleitenden Durchschnitt (EMA) vom 12-Perioden-EMA subtrahiert. Eine 9-Perioden-EMA, genannt "Signal Line", wird dann oben auf den MACD geplottet, um als Auslöser für Kauf- und Verkaufssignale zu fungieren. Der MACD wird als bullis
FREE

Der Nihilist 5.0 Indikator beinhaltet Forexalien und Nihilist Easy Trend Handelsstrategien und -systeme. Er besteht aus einem MTF Dashboard, wo Sie die verschiedenen Eingabemöglichkeiten jeder Strategie auf einen Blick analysieren können. Es verfügt über ein Alarmsystem mit verschiedenen Arten von konfigurierbaren Filtern. Sie können auch konfigurieren, welche TF Sie auf Ihrer Metatrader 4-Plattform und Ihrer mobilen Anwendung benachrichtigt werden möchten.
Der Indikator hat die Möglichkeit zu s
** Alle Symbole x Alle Zeitrahmen scannen nur durch Drücken der Scanner-Taste ** Nach 18 Jahren Erfahrung an den Märkten und in der Programmierung ist der Winner-Indikator fertig. Ich würde gerne mit Ihnen teilen! *** Kontaktieren Sie mich, um Ihnen den "Trend Finder Indikator " kostenlos zu schicken, eine Anleitung zu erhalten und Sie in die "M1 Signal Scanner Gruppe" aufzunehmen, damit Sie Ihre Erfahrungen mit anderen Nutzern teilen oder sehen können. Einführung: M1 Signal Scanner ist ein Ind

Der Algorithmus findet auf der Grundlage des Indikators UPD1 Trend Direction die Bereiche mit niedriger Volatilität und erstellt das maximale horizontale Volumen auf der Grundlage des Indikators UPD1 Volume Box . In der Regel tritt eine starke Trendbewegung auf, wenn Sie die Akkumulation verlassen. Wenn der Preis die Akkumulation verlassen hat, kann er sein maximales horizontales Volumen (POC) testen. Smart-Benachrichtigungen sind in den Einstellungen verfügbar.
Eingangsparameter.
Grundlegend
FREE
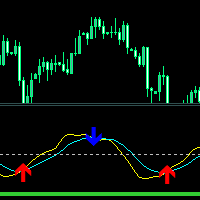
Crossing Line Indicator – Ein Indikator zur frühzeitigen Erkennung von Impulsbewegungen in Trendrichtung.
Enthält einen auf dem RVI-Indikator basierenden Oszillator mit Glättung und Verhaltensänderung. Bei zwei dünnen Linien kommt es an deren Kreuzung zu einer Preisänderung, deren Folge ein Impuls oder eine intensive Bewegung sein kann.
Der Indikator zur Bestimmung der Trendrichtung basiert auf gewichteten MA-Indikatoren. Dicke hellgrüne Linie: Liegt sie unter dem zentralen Niveau, ist der Tren
FREE

Divergence Pro Oscillator PRT is not repaint professional multi-oscillator divergence indicator designed for manual trading and Expert Advisor integration . The indicator detects Classic and Hidden Divergences using 19 built-in oscillators , supports confirmed non-repainting pivot logic , optional zero-line crossing signals , and advanced signal confirmation filtering . It is designed for traders who prefer structure, confirmation, and controlled risk , not repainting tricks.

Please contact us after your purchase and we will send you the complimentary indicators to complete the system Cycle Sniper ist kein heiliger Gral, aber wenn Sie ihn in einem System verwenden, das in den Videos erklärt wird, werden Sie den Unterschied spüren. Wenn Sie nicht bereit sind, sich auf die Charts zu konzentrieren, die mit Cycle Sniper und anderen kostenlosen Tools, die wir zur Verfügung stellen, entworfen wurden, empfehlen wir, diesen Indikator nicht zu kaufen. Wir empfehlen Ihnen, s

Wave Reversal Indicator - bestimmt die Richtung und Preisumkehrungen um die Bilanzlinie.
Der Indikator zeigt Wellenbewegungen und Trendanstiege. Er gibt Empfehlungen, wohin er dem Händler folgen soll, und hilft bei der Verfolgung der Handelsstrategie.
Es handelt sich um eine Ergänzung zu einer Intraday- oder mittelfristigen Strategie.
Fast alle Parameter werden für jeden Zeitrahmen ausgewählt und ändern sich automatisch. Der einzige Parameter, der manuell angepasst werden kann, ist die Wellenlän
FREE
Willkommen in der Welt von SMC (Smart Money Concepts) Trading, wo wir Händlern die Werkzeuge und das Wissen an die Hand geben, um intelligentere Handelsentscheidungen zu treffen. Unsere neueste Ergänzung zu unseren Handelswerkzeugen ist der SMC Trading Pro Indikator, Version 1.0. Hauptmerkmale: Identifizierung von großen Marktstrukturen mit BODY-Break. Orderblock muss sich im Major Swing befinden (nicht im Small Swing). Orderblock mit Fair Value Gap-Erkennung. Orderblock in der Zone Discount | P
FREE

Divergenzen sind schwierig zu finden und seltener anzutreffen. Sie sind eines der zuverlässigsten Handelsszenarien. Dieser Indikator sucht automatisch mit Ihrem bevorzugten Oszillator nach regelmäßigen und versteckten Abweichungen. [ Installationsanleitung | Update-Anleitung | Fehlerbehebung | FAQ | Alle Produkte ]
Einfach zu handeln
Findet regelmäßige und versteckte Abweichungen Unterstützt viele bekannte Oszillatoren Implementiert Handelssignale basierend auf Ausbrüchen Zeigt geeignete Sto

1.Angebot und Nachfrage sind eine der Kernstrategien im Handel. Es konzentriert sich auf die alten Gesetze von Angebot und Nachfrage, sowie die Trends der Preise in einem frei fließenden Markt. Grundlage dieser Strategie ist, dass die Menge der verfügbaren Werkzeuge und die Nachfrage nach Werkzeugen von Käufern den Preis bestimmen. Es markiert auf dem Diagramm die Bereiche, in denen die Nachfrage das Angebot überwältigt (Nachfrageregionen), die Preise nach oben treibt oder in denen das Angebot d
FREE

1. Zusammengesetzte Zeichnungen (1) Linienabschnitt mit Pfeil (2) Durchgehender Linienabschnitt (gestrichelte Linie) (3) Parallelogramm (4) Vieleck (5) Werkzeuge zur Messung der Gewinn- und Verlustquote
2. die Rückverfolgung mit der Z-Taste während des Zeichnens der Linie Linientypen, die das Backtracking mit der Z-Taste unterstützen: Kontinuierliche Liniensegmente (gestrichelte Linie) , Kanäle, Parallelogramme, Polygone und Fibo-Erweiterungen.
3. automatische Absorption (1) Klicken Sie auf

Im Demomodus wird das Datum verwendet, um zu arbeiten. In Version 13 wurde die Welle hinzugefügt.13.1 Histogramm und Triggerlinie können geändert werden. Welle kann 200-500 eingestellt werden. kann verschiedene Signale auf Welle 200 haben in der Version 14 wird das EMA verwendet, so dass man auch die Signale des Mountly-Charts sehen kann. Up-Down-Indikator ist kein repaint und arbeitet alle Paare und alle Zeitrahmen Charts. Es ist auch geeignet 1 m Charts für alle Paare. und halten lange Weg zu

Wir stellen vor Quantum Heiken Ashi PRO- Charts Die Heiken-Ashi-Kerzen wurden entwickelt, um klare Einblicke in Markttrends zu geben und sind bekannt für ihre Fähigkeit, Rauschen herauszufiltern und falsche Signale zu eliminieren. Verabschieden Sie sich von verwirrenden Preisschwankungen und begrüßen Sie eine glattere, zuverlässigere Diagrammdarstellung. Was den Quantum Heiken Ashi PRO wirklich einzigartig macht, ist seine innovative Formel, die traditionelle Candlestick-Daten in leicht

Marktstrukturverschiebungs- und Fair-Value-Gap (FVG)-Indikator für MT4 Dieser MT4-Indikator identifiziert Marktstrukturverschiebungen und Fair-Value-Gaps (FVGs) und bietet Händlern potenzielle Handelsmöglichkeiten. Er benachrichtigt Benutzer über diese Ereignisse per Mobiltelefon, sodass sie schnell auf sich ändernde Marktbedingungen reagieren können. Hauptmerkmale: Erkennung von Marktstrukturverschiebungen: Erkennt bullische und bärische Marktstrukturverschiebungen basierend auf Swing-Hoch/Tie
FREE
Das umstrittene 5-Schritte-System, das professionelle Händler verwenden, um den Erfolg im Handel zu sichern!
Reversal Pro kombiniert effektiv Preisaktionen, ideale Standorte und zuverlässige Statistiken in einem intelligenten Algorithmus. Wenn Sie den Markt aus dieser einzigartigen Perspektive verstehen, können Sie Umkehrungen professionell erkennen.
Entdecken Sie das Geheimnis der professionellen Trader
Sofortigen Zugang erhalten www.mql5.com/en/blogs/post/716077 Kopieren und Einfügen, was

The MA Bounce Strategy is a strategy that seeks to long FX pairs on a strong uptrend as they bounce off their MA support and shorting FX pairs on a strong downtrend as they bounce off MA resistance. The best suitable periods of moving averages for that strategy are 18, 30, 50. This indicator helps to identify and find place for potential market entry by MA bounce strategy. Read More information about MA Bounce Strategy . By default MA Bounce Strategy indicator is configured for trading of M15
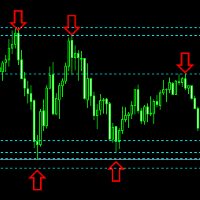
.....................................hi....................... ................für die Anzeige von Hochs und Tiefs sowie von Unterstützungen und Widerständen .....................wir haben eine Menge Möglichkeiten............................... es kann hilfreich sein, um Trends zu finden, höhere Hochs, höhere Tiefs, niedrigere Hochs, niedrigere Tiefs
.......................heute schreibe ich über eines davon.......................... ........................Sie können die Anzahl der letzten Unt
FREE

Free Market Struktur Zickzack zur Unterstützung des Price Action Trading die Screenshots beschreiben, wie zu verwenden und wie Muster zu erkennen die neue Version enthält Alarme, E-Mail-Benachrichtigungen und Push-Benachrichtigungen kann für alle Paare verwendet werden kann auf allen Zeitrahmen verwendet werden Sie können zusätzliche Bestätigungsindikatoren hinzufügen der Indikator zeigt Ihnen Ihre Höchst- und Tiefststände an sowie Ihre unteren Tiefs und unteren Hochs der Indikator macht die Pre
FREE
SL Curruncy-Impuls https://www.mql5.com/en/market/product/82593 SL Session Strength 28 Pair Flow dieser Intraday Asian London New York Sessions strength.SL Session Strength 28 Indikator am besten für Intraday Scalper. Markt starke Bewegung Zeit können Sie am besten Symbol zu fangen. weil Sie wissen, welche Währungen sind am besten zu diesem Zeitpunkt zu handeln. Kaufen Sie starke Währungen und verkaufen Sie schwache Währungen (divergierende Währungen). Empfohlene Zeitrahmen für den Handel: M5 -

Trendline Alert Pro ist ein MetaTrader 4-Indikator, der die von Ihnen erstellten Objekte wie Trendlinien, horizontale Linien, Rechtecke, Fibonacci-Levels überwacht und Sie sofort alarmiert, wenn der Preis mit ihnen interagiert.
Die MT5-Version finden Sie hier Senden Sie mir eine PM, um eine 7-tägige Testversion des Produkts zu erhalten.
Multi-Objekt-Überwachung Trendlinien, Kanäle und abgewinkelte Linien Horizontale und vertikale Linien Rechtecke (Unterstützungs-/Widerstandszonen) Fibonacci-

TR WALLMAP
Institutioneller Wall & Heatmap-Bestätigungsindikator (MT4) Was ist TR WALLMAP?
TR WALLMAP ist ein professioneller Marktreaktions- und Bestätigungsindikator , mit dem versteckte Liquiditätsmauern , Preisabsorption und hochwirksame Reaktionszonen visuell aufgedeckt werden können.
Dieses Tool ist kein Signalgenerator und kein Auto-Trader . Es arbeitet als Bestätigungsmaschine , die Händlern hilft, Eingaben mit Hilfe der Logik des institutionellen Verhaltens zu validieren.
Wen

Der Indikator « Identify Trend » („Trend erkennen“), bei dem relativ einfache, aber robuste Filtermethoden (basierend auf dem sich bewegenden Median - XM-Algorithmus und komplexer, vom Autor entwickelt, Algorithmen XC, XF, XS, vier Arten von gleitenden Durchschnitten ohne Verzögerung SMAWL, EMAWL, SSMAWL, LWMAWL ) verwendet werden, ermöglicht sehr genau und vor allem mit einer geringen Verzögerung (1) den Beginn der tatsächlichen Trendbewegung und (2) die Identifizierung der W
FREE

Der Indikator analysiert die Volumenskala und teilt sie in zwei Komponenten auf - Verkäufer- und Käufervolumen - und berechnet außerdem das Delta und das kumulative Delta. Der Indikator flackert nicht und wird nicht neu gezeichnet, seine Berechnung und Darstellung erfolgen relativ schnell, wobei die Daten der kleineren (im Vergleich zum aktuellen) Zeiträume verwendet werden. Die Betriebsmodi des Indikators können über die Eingangsvariable Modus umgeschaltet werden: Kaufen - zeigt nur die Käuferv
FREE

Eines der mächtigsten und wichtigsten IKT-Konzepte ist die Macht der 3. Es erklärt die IPDA-Phasen (Interbank Price Delivery Algorithm). PO3 bedeutet einfach, dass der Algorithmus des Marktmachers drei Dinge mit dem Preis macht:
Akkumulation, Manipulation und Verteilung
ICT erklärt uns, wie wichtig es ist, die wöchentliche Kerzenausdehnung zu erkennen und dann zu versuchen, oberhalb oder unterhalb der Tageseröffnung in die Richtung der wöchentlichen Ausdehnung einzusteigen.
Dieser praktische

Der ADR-Umkehrindikator zeigt Ihnen auf einen Blick, wo der Preis derzeit im Verhältnis zu seiner normalen durchschnittlichen Tagesspanne gehandelt wird. Sie erhalten sofortige Benachrichtigungen per Pop-up, E-Mail oder Push, wenn der Preis seine durchschnittliche Spanne und darüber liegende Niveaus Ihrer Wahl überschreitet, sodass Sie schnell in Pullbacks und Umkehrungen einsteigen können. Der Indikator zeichnet horizontale Linien auf dem Chart an den durchschnittlichen täglichen Range-Extreme
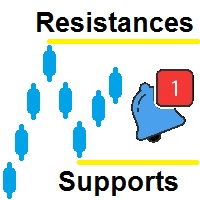
Supports and Resistances wurde entwickelt, um Ihnen dabei zu helfen, Hochs und Tiefs automatisch in mehreren verschiedenen Zeitrahmen zu identifizieren und diese Hochs und Tiefs auf dem aktuellen Chart darzustellen. Kommen wir zur Erklärung der Entstehung von Resistenzen Es gibt ein Regelfeld, in dem Sie definieren können, was oben und unten ist. Die obere Regel ist standardmäßig wie folgt festgelegt: H[ 0 ]<=H[ 1 ] and H[ 1 ]=>H[ 2 ]
Wo:
Element Beschreibung H bedeutet Hoch
[0] bedeutet
FREE
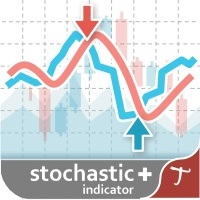
Tipu Stochastic ist die modifizierte Version des originalen Stochastic Oscillators, der hier von MetaQuotes veröffentlicht wurde.
Merkmale Wählen Sie zwischen drei Signaltypen (Umkehrsignale, Hauptsignal Cross und Overbought/Oversold Cross). Anpassbare Kauf-/Verkaufswarnungen, Push-Warnungen, E-Mail-Warnungen und visuelle Warnungen auf dem Bildschirm. Markierte überkaufte und überverkaufte Niveaus. Fügen Sie Tipu Panel hinzu ( hier zu finden) und schalten Sie die folgenden zusätzlichen Funktion
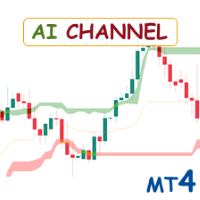
Special offer : ALL TOOLS , just $35 each! New tools will be $30 for the first week or the first 3 purchases ! Trading Tools Channel on MQL5 : Join my MQL5 channel to update the latest news from me Der AI Channels -Indikator nutzt rollende K-means-Klassifizierung —eine leistungsstarke Technik des maschinellen Lernens in der Clusteranalyse—um Echtzeit-Einblicke in die zugrunde liegenden Preistrends zu liefern. Dieser Indikator erstellt adaptive Kanäle basierend auf gruppierten Preis
FREE
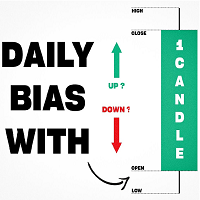
Inspiriert von TTrades Video über die tägliche Tendenz, zielt dieser Indikator darauf ab, eine Tendenz für einen höheren Zeitrahmen zu entwickeln und Daten über seine Erfolgsrate zu sammeln. Während in dem Video eine Handvoll Konzepte vorgestellt wurden, konzentriert sich dieser Indikator auf eine spezifische Methode, die frühere Hochs und Tiefs nutzt. In der folgenden Beschreibung wird die Funktionsweise des Indikators am Beispiel des täglichen Zeitrahmens erläutert, aber auch der wöchentliche
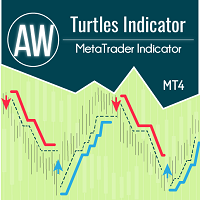
Der Indikator funktioniert nach dem Turtle-System und geht klassisch von einem Zeitintervall von 20 und 55 Kerzen aus. Ein Trend wird über ein bestimmtes Zeitintervall überwacht. Der Einstieg erfolgt zum Zeitpunkt des Durchbruchs des Unterstützungs- oder Widerstandsniveaus. Das Ausstiegssignal ist ein Preisausbruch in die entgegengesetzte Richtung des Trends im gleichen Zeitintervall. Vorteile:
Instrumente: Währungspaare, Aktien, Rohstoffe, Indizes, Kryptowährungen Zeitrahmen: Klassisch D1, au
FREE

Titel: HTF Candle Insight - Sehen Sie das große Bild auf einem Chart Einleitung: Hören Sie auf, ständig zwischen den Tabs zu wechseln! HTF Candle Insight ermöglicht Ihnen die Visualisierung von Higher Timeframe Preisaktionen direkt in Ihrem aktuellen Trading-Chart. Egal ob Sie Scalper, Daytrader oder Swingtrader sind, die Kerzenstruktur im "Big Picture" zu sehen, ist entscheidend für die Identifizierung von Trends, Umkehrungen und Schlüsselniveaus (Support/Resistance). Hauptmerkmale: Doppeltes

Kontaktieren Sie mich nach der Bezahlung , damit ich Ihnen das Benutzerhandbuch als PDF-Datei zusenden kann. Indikator zur Erkennung von Divergenzen mit einem speziellen Algorithmus. Die Verwendung von Divergenzen ist in Handelsstrategien sehr verbreitet. Aber es ist sehr schwierig, Gelegenheiten für den Handel mit den Augen zu finden, und manchmal verlieren wir diese Gelegenheiten. Der Indikator findet alle regelmäßigen und versteckten Divergenzen. (RD & HD) Er verwendet eine fortschrittliche

Der Indikator setzt Semaphore-Punkte auf das Maximum und Minimum einer höheren, mittleren und niedrigeren Periode. Er enthält A,B,C-Dreiecke zur leichteren Erkennung von Umkehr-Chartmustern, die sehr häufig auftreten und eine sehr hohe Erfolgsquote haben. Sowohl Semaphore als auch A,B,C Triangles verfügen über Alarme und Push-Benachrichtigungen an ein mobiles Gerät, wenn sie auf dem Chart auftreten. Diese Indikatoren sind sehr nützlich für den Ausbruchshandel und das Aufspüren von Unterstützung
Es ist ein Werkzeug für die technische Analyse. Es erlaubt Ihnen, Messungen durchzuführen: Fibo, einschließlich der Suche nach Clustern Fibo Ebenen (durch die DiNapoli-Methode) Überschreitung des Gleichgewichts Trendlinie Auswahl der S/D-Levels
Eingabeparameter Trend_Color - Farbe der Trendlinie Trend_Width - Breite der Trendlinie Trend_info - wenn true, werden neben der Trendlinie zusätzliche Informationen angezeigt (low, high, medium der Trendlinie) Trend_info_color_up_dn - Farbe des Textes,

Gute Nachrichten! Advanced Currency Meter ist jetzt noch genialer! Wenn Sie ein Fan der kostenlosen Version von Advanced Currency Meter waren, dann möchte ich Sie bitten, sich nicht entmutigen zu lassen, denn Sie werden bald feststellen, dass die neue kostenpflichtige Version jeden Cent wert ist. Im Gegensatz zur kostenlosen Version hat die neue kostenpflichtige Version von Advanced Currency Meter jetzt ein neu hinzugefügtes Panel namens "% Daily Range". Warum jetzt eine kostenpflichtige Version
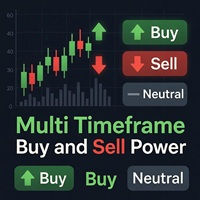
Multi Timeframe Buy und Sell Power MT4
Der Multi Timeframe Buy and Sell Power-Indikator für MetaTrader 4 ist ein vielseitiges Tool, das Händlern eine klare visuelle Darstellung des Marktdrucks über neun Standard-Zeitrahmen hinweg bietet, von M1 bis MN1. Durch die Aggregation von Kauf- und Verkaufsstärke-Prozentsätzen, die aus den jüngsten Kursbewegungen und dem Tick-Volumen abgeleitet werden, hilft der Indikator, potenzielle Trends, Umkehrungen und neutrale Bedingungen in Echtzeit zu erkennen.
FREE
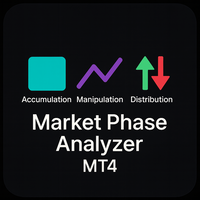
Beschreibung
Der Market Phase Analyzer ist ein fortschrittlicher Indikator, der entwickelt wurde, um die drei Hauptphasen des Marktes zu identifizieren: Akkumulation , Manipulation und Distribution .
Durch automatische Sitzungsanalyse zeichnet der Indikator die Asia Box , erkennt Sweep-Bewegungen über oder unter wichtigen Niveaus und bestätigt Umkehrsignale mit dem ATR-Filter , um Fehlsignale zu reduzieren. Hauptfunktionen Markierung der asiatischen Handelssitzung mit anpassbarem Rechteck. Auto
FREE

Auto Trendline Fibo Dow Theory - Automatisierte Preisaktions- und Strukturanalyse Überblick: Schluss mit dem manuellen Zeichnen von Trendlinien und Fibonacci-Retracements! Auto Trendline Fibo Dow Theory ist ein leistungsstarkes Preisaktionsprogramm zur Automatisierung Ihrer technischen Analyse auf der Grundlage der klassischen Dow-Theorie und der Fibonacci-Ratios . Dieser Indikator scannt die Marktstruktur mithilfe eines anpassbaren ZigZag-Algorithmus, um höhere Hochs und höhere Tiefs (Aufwärtst

Scalper Arrow x ist ein Kauf-Verkauf-Pfeil-Indikator, dessen Strategie auf dem MFI-Indikator mit Trendfilter und Halftrend-Formel basiert. Dieser Indikator kann allein oder in Kombination mit anderen Tools verwendet werden. HINWEIS: DIESER INDIKATOR MALT NICHT NEU UND SEINE PFEILSIGNALE SIND NICHT VERZÖGERT. ---------------------------------------------------------------
FREE

Buy Sell Signal Low TF gibt Kauf-/Verkaufssignale und warnt mit einem Aufwärts- und Abwärtspfeil bei einer möglichen Umkehr eines Pullbacks oder eines Trendfortsetzungsmusters in einem niedrigen Zeitrahmen. Dies ist ein Indikator, der Signale basierend auf dem Trend gibt => Er funktioniert am besten in Trendmärkten, wobei das Prinzip darin besteht, auf dem Trend zu reiten und nicht gegen den Trend zu handeln .
Die Komponenten des Buy-Sell-Signals Low TF: - Der Trend wird durch den SMMA 13, den
FREE
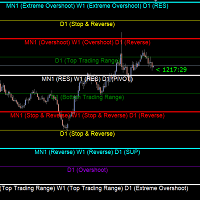
Gold Levels MTF - Dies ist ein ausgezeichneter technischer Indikator für Aktien. Der Algorithmus des Indikators analysiert die Preisbewegung des Vermögenswerts und zeigt die Preisniveaus der Unterstützung und des Widerstands in allen Zeitrahmen (TF) an, indem er die auf der Gann-Theorie basierende Murray-Methode verwendet. Der Indikator zeigt überkaufte und überverkaufte Bereiche an und gibt eine Vorstellung von möglichen Umkehrpunkten und gleichzeitig eine Vorstellung von der Stärke des aktuell
FREE

Advanced Stochastic Scalper - ist ein professioneller Indikator, der auf dem beliebten Stochastik Oszillator basiert. Advanced Stochastic Scalper ist ein Oszillator mit dynamischen überkauften und überverkauften Niveaus, während diese Niveaus beim Standard-Stochastik-Oszillator statisch sind und sich nicht ändern. Dadurch kann sich der Advanced Stochastic Scalper an den sich ständig verändernden Markt anpassen. Wenn ein Kauf- oder Verkaufssignal erscheint, wird ein Pfeil auf dem Diagramm gezeich
MTF Moving Averages ist ein nützlicher Indikator, der Ihnen Daten aus vollständig anpassbaren gleitenden Durchschnitten mit höherem Zeitrahmen auf Ihren Charts liefert. Sie können mehrere gleitende Durchschnitte hinzufügen, um noch mehr Daten zu den aktuellen Marktbedingungen zu nutzen. Sehen Sie sich den Indikator in Aktion an [Bilder unten]
Was macht MTF Moving Averages außer der Anzeige von MA's mit höherem Zeitrahmen?
Zeitersparnis , da alle MAs der höheren Zeitrahmen in nur einem Diagramm

Supply Demand Analyzer ist ein fortschrittlicher Handelsindikator, der sorgfältig für die präzise Identifizierung, Analyse und Verwaltung von Angebots- und Nachfragezonen entwickelt wurde. Durch die Integration von Echtzeitdaten und fortschrittlichen Algorithmen ermöglicht dieses Tool Händlern, Marktphasen, Preisbewegungen und strukturelle Muster mit unvergleichlicher Genauigkeit zu erkennen. Es vereinfacht die komplexe Marktdynamik in umsetzbare Erkenntnisse und ermöglicht es Händlern, das Mark
Bitte testen Sie den Indikator gründlich unter den von Ihnen bevorzugten Handelsbedingungen, bevor Sie eine Kaufentscheidung treffen.
Ihre Zufriedenheit und Ihr Vertrauen in die Leistung des Indikators sind von größter Bedeutung.
MT Magical : Eine ausgeklügelte Strategie, die Swing-Trading, Trendanalyse sowie Angebots- und Nachfragesignale kombiniert. Fachmännisch gefiltert, um Präzision zu gewährleisten, mit rigorosem Aufwand entwickelt, um ernsthaften Investoren einen Mehrwert zu bieten. In

Der EZT-Trendindikator zeigt Ihnen den Trend, den Rückzug und die Einstiegsmöglichkeiten. Optionale Filterung und alle Arten von Warnungen sind verfügbar. E-Mail- und Push-Benachrichtigungsbenachrichtigungen werden hinzugefügt. Wir entwickeln auch einen EA basierend auf diesem Indikator, der bald verfügbar sein wird.
Es handelt sich um einen multifunktionalen Indikator, der aus zwei Farbhistogrammen und einer Linie besteht. Es handelt sich um eine visuelle Darstellung der Richtung und Stärke e
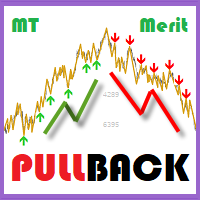
"Pullback bei gleichzeitiger Filterung des Trends"
MT MERIT PullBack :
Entwickelt zur Erkennung von Pullback-Signalen bei gleichzeitiger Filterung von Trends mittels fortschrittlicher Techniken. Am besten für kurzfristige Zyklen geeignet. Maßgeschneidert für den manuellen Handel, mit Schwerpunkt auf Risikomanagement und Fundamentalanalyse zur Auswahl optimaler Währungspaare.
HANDEL: Forex ZEITRAHMEN: Alle Zeitrahmen SYMBOLPaare: Alle Symbole
EINSTELLUNGEN:
BALKEN BERECHNEN: Der Wert oder

Was ist ein Point of Interest? Händler, die Smart-Money-Konzepte verfolgen, bezeichnen dies als Liquiditätspunkt oder als Bereiche, in denen von Einzelhändlern Liquidität aufgebaut wurde, auf die die Großbanken abzielen, um große Kursbewegungen auf dem Markt zu erzeugen. Wie wir alle wissen, verwenden Kleinhändler veraltete und unzuverlässige Handelsmethoden wie Trendlinien, Unterstützung und Widerstand, RSI, MACD und viele andere, um Geschäfte zu platzieren und ihre Stop-Loss-Punkte an Schlüsse

Auto Fibo ist ein Indikator, der entwickelt wurde, um Ihren manuellen Handel zu verbessern. Er zeichnet den Goldenen Schnitt automatisch, spart Ihnen Zeit und erleichtert Ihren Handel. Wenn Sie den Indikator an das Diagramm anhängen, zeichnet er automatisch den exakten Goldenen Schnitt ein und erspart Ihnen die Suche nach dem kritischen Punkt. Die Schnittstelle passt sich an Ihren Computer an, um die ungefähren Hoch- und Tiefpunkte des Bandes zu ermitteln. Dieser Indikator korrigiert die meiste
FREE

Der Indikator für Angebots- und Nachfragezonen ist ein leistungsfähiges und benutzerfreundliches Instrument, das Händlern hilft, kritische Angebots- und Nachfragezonen auf dem Chart zu erkennen. Diese Zonen können einen wertvollen Einblick in potenzielle Marktumkehrungen, Ausbrüche und wichtige Kursniveaus geben, bei denen Käufer oder Verkäufer wahrscheinlich die Kontrolle übernehmen werden. Der beste KOSTENLOSE Handelsmanager . Wenn Sie Ihre eigenen Hedging- oder Grid-Strategien ohne Programmie
FREE

Wenn Sie dieses Projekt mögen, hinterlassen Sie eine 5-Sterne-Bewertung. Dieser Indikator zieht die offenen, hohen, niedrigen und schließenden Preise für
die angegebenen
und kann für eine bestimmte Zeitzone eingestellt werden. Dies sind wichtige Ebenen, die von vielen institutionellen und professionellen
Händler und kann nützlich sein, um die Orte, wo sie vielleicht mehr
aktiv. Die verfügbaren Zeiträume sind: Vorheriger Tag. Vorherige Woche. Vorheriger Monat. Vorheriges Viertel. Vorheriges Jahr
FREE

Sonderangebot : ALL TOOLS , nur $35 pro Stück! Neue Tools kosten $30 während der ersten Woche oder der ersten 3 Käufe ! Trading Tools Channel on MQL5 : Treten Sie bei und erhalten Sie aktuelle Neuigkeiten RSI Shift Zone Scanner erkennt Momente, in denen sich die Marktstimmung ändern könnte, indem RSI-Signale mit der Preisaktion verknüpft werden. Immer wenn der RSI die voreingestellten Schwellenwerte (Standard 70 überkauft, 30 überverkauft) über- oder unterschreitet, zeichnet der In
MT5-Version hier verfügbar: https://www.mql5.com/en/market/product/50255
Telegram-Kanal & Gruppe: https://t.me/bluedigitsfx
VIP-Gruppenzugang: Senden Sie Zahlungsnachweis an unseren Posteingang
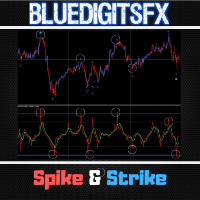
Empfohlener Broker: https://bit.ly/BlueDigitsFxStarTrader BlueDigitsFx Spike And Strike Reversal — Leistungsstarker Misch-Oszillator zur genauen Marktumkehr-Erkennung BlueDigitsFx Spike And Strike Reversal ist ein zusammengesetzter Oszillator, der mehrere Indikatorsignale kombiniert, um Ihnen zu helfen

Speed Trend Matrix Ultimate (Version 5.10) Die Speed Trend Matrix (STM) ist ein umfassendes Handelssystem, das in einem einzigen Indikator gekapselt ist. Im Gegensatz zu Standardoszillatoren, die lediglich Überkauft- oder Überverkauft-Zustände anzeigen, analysiert der STM die „Geschwindigkeit“ der Preisbewegung im Verhältnis zur Marktvolatilität (ATR). Er identifiziert nicht nur die Trendrichtung, sondern auch die Stärke hinter der Bewegung und filtert Perioden geringer Dynamik (die „FlatZone“ )
Hallo Trader, ================================================================================ Wenn Ihnen mein Indikator gefällt, zögern Sie bitte nicht, eine Bewertung und/oder einen Kommentar abzugeben. Vielen Dank dafür! ================================================================================
Dieser Indikator zeichnet Handelseinstiegszonen und Zielniveaus auf der Grundlage der Niveaus des Vortages.
Es wird eine blaue Zone (KAUFEN) oder eine rote Zone (VERKAUFEN) eingezeichnet und zw
FREE

Der Indikator für Angebots- und Nachfragezonen ist eines der besten Tools, die wir je entwickelt haben. Dieses großartige Tool zeichnet automatisch Angebots- und Nachfragezonen, die besten Orte für die Eröffnung und Schließung von Positionen. Er verfügt über viele fortschrittliche Funktionen, wie die Unterstützung von Zonen mit mehreren Zeitrahmen, die Anzeige der Breite der Zonen, Warnmeldungen für retuschierte Zonen und vieles mehr. Aufgrund der Fraktalität des Marktes kann dieser Indikator fü

Der Magic Histogram-Indikator ist ein universelles Instrument, das sich für Scalping und mittelfristigen Handel eignet. Dieser Indikator verwendet eine innovative Formel und ermöglicht es Ihnen, die Richtung und Stärke des Trends zu bestimmen. Das Magic Histogram wird nicht neu gezeichnet, so dass Sie seine Effizienz anhand der historischen Daten bewerten können. Er eignet sich am besten für M5, M15, M30, H1 und H4. Version für das MetaTrader 5 Terminal: https: //www.mql5.com/en/market/product/5

Der Consolidation Zone Indicator ist ein leistungsfähiges Instrument, mit dem Händler Konsolidierungsmuster auf dem Markt erkennen und nutzen können. Dieser innovative Indikator erkennt Konsolidierungsbereiche und gibt rechtzeitig Warnungen aus, wenn der Kurs diese Zonen über- oder unterschreitet, so dass Händler fundierte Handelsentscheidungen treffen können. MT5 Version : https://www.mql5.com/en/market/product/118748 Beitreten und Markttiefe lernen - h ttps:// www.mql5.com/en/channels/suvashi
FREE

Der Pips Chaser Indikator wurde entwickelt, um Ihren manuellen Handel zu ergänzen. Dieser Indikator kann sowohl für kurzes Scalping als auch für langes Swing-Trading verwendet werden // MT5 Version
Merkmale Indikator wird nicht neu gezeichnet Dieser Indikator ändert seine Werte nicht, wenn neue Daten eintreffen Handelspaare Jedes Währungspaar Zeitrahmen H1 ist vorzuziehen, aber Sie können ihn an jeden Zeitrahmen anpassen Trading time
Rund um die Uhr Buffers Buy Buffer: 0 / Sell Buffer: 1
FREE

** Alle Symbole x Alle Zeitrahmen scannen nur durch Drücken der Scanner-Taste ** *** Kontaktieren Sie mich , um Ihnen eine Anleitung zu schicken und Sie in die "Order Block Gruppe" aufzunehmen, damit Sie Ihre Erfahrungen mit anderen Nutzern austauschen und sehen können. Einleitung: Die Zentralbanken und Finanzinstitute treiben den Markt hauptsächlich an. Orderblocks werden als ein Marktverhalten betrachtet, das eine Anhäufung von Aufträgen von Banken und Institutionen anzeigt, dann neigt der Mar
MetaTrader Market bietet jedem Entwickler eine einfache und bequeme Plattform für den Verkauf von Programmen.
Wir unterstützen Sie bei der Veröffentlichung des Produkts und beraten Sie gerne, wie man eine Beschreibung für den Market vorbereitet. Alle Produkte, die im Market verkauft werden, sind durch eine zusätzliche Verschlüsselung geschützt und können nur auf dem Rechner des Kunden gestartet werden. Illegales Kopieren ist ausgeschlossen.
Sie verpassen Handelsmöglichkeiten:
- Freie Handelsapplikationen
- Über 8.000 Signale zum Kopieren
- Wirtschaftsnachrichten für die Lage an den Finanzmärkte
Registrierung
Einloggen
Wenn Sie kein Benutzerkonto haben, registrieren Sie sich
Erlauben Sie die Verwendung von Cookies, um sich auf der Website MQL5.com anzumelden.
Bitte aktivieren Sie die notwendige Einstellung in Ihrem Browser, da Sie sich sonst nicht einloggen können.