Technische Indikatoren für den MetaTrader 4 - 13

US30 Revolt ist ein technischer Indikator, der zu 100% nicht nachgemalt wird und auf der aktuellen Kerze erscheint funktioniert auf allen Zeitrahmen (empfohlen M15,M30,H1) Der Indikator wurde für US30 entwickelt, kann aber auch für andere Paare verwendet werden. Wenn ein blauer Pfeil erscheint, suchen Sie nach Kaufgelegenheiten Wenn ein orangefarbener Pfeil erscheint, suchen Sie nach Verkaufsgelegenheiten Bitte sehen Sie sich das YouTube-Video an, in dem erklärt wird, wie man den Indikator richt
FREE

Erschließen Sie sich intelligenteres Trading mit Trend-Sensing Pro Haben Sie genug von verwirrenden Charts und späten Signalen? Trend-Sensing Pro ist ein leistungsstarker und dennoch einfacher Indikator, der Ihnen hilft, Markttrends mit kristallklarer Klarheit zu erkennen. Er kombiniert die Sanftheit eines EMA (Exponential Moving Average) mit einer einzigartigen Kerzenvisualisierung, die Ihnen eine klare, rauschfreie Sicht auf die Marktrichtung bietet. Warum Sie Trend-Sensing Pro lieben werden S
FREE
Hochgradig konfigurierbarer Stochastik-Indikator.
Merkmale: Hochgradig anpassbare Alarmfunktionen (bei Levels, Kreuzen, Richtungsänderungen per E-Mail, Push, Sound, Popup) Multi-Timeframe-Fähigkeit Farbanpassung (bei Niveaus, Kreuzen, Richtungsänderungen) Optionen für lineare Interpolation und Histogramm-Modus Funktioniert im Strategie-Tester im Multi-Timeframe-Modus (auch am Wochenende ohne Ticks) Einstellbare Levels Parameter:
Stochastic Timeframe: Sie können den unteren/höheren Zeitrahmen fü
FREE

So verwenden Sie
In diesem Beitrag finden Sie eine detaillierte Beschreibung über Alle Indikator-Extras und Vorlagen: https://www.mql5.com/en/blogs/post/758259
The Best Heiken Ashi System ist ein einfaches Handelssystem für den Handel basiert nur zwei Indikatoren für Signale zu generieren: Heiken Ashi geglättet und Vqzz Indikator Multi-Timeframe. Das System wurde für Scalping und Daytrading erstellt, kann aber auch für höhere Zeitrahmen konfiguriert werden. Wie bereits erwähnt, ist das Handel
FREE

Dies ist ein kostenloses Produkt, das Sie gerne für Ihre Zwecke verwenden können!
Außerdem freue ich mich sehr über Ihr positives Feedback! Vielen Dank!
Klicken Sie hier, um hochwertige Trading-Roboter und Indikatoren zu sehen!
Forex Indicator Spread Display für MT4, großartiges zusätzliches Handelstool.
- Der Spread Display-Indikator zeigt den aktuellen Spread des Forex-Paares an, an dem es angebracht ist. - Es ist möglich, den Spread-Anzeigewert in jeder Ecke des Diagramms zu platzieren:
FREE
Dieser Indikator ist die mql-Version des Indikators Linear Regression Candles . Find out more here: https://www.mql5.com/en/users/rashedsamir/seller Es gibt viele lineare Regressionsindikatoren, die meisten von ihnen zeichnen Linien oder Kanäle, aber dieser Indikator zeichnet tatsächlich ein Diagramm Dieses Skript enthält Funktionen wie lineare Regression für Eröffnungs-, Hoch-, Tief- und Schlusskurse, Signalglättung mit einfachen oder exponentiellen gleitenden Durchschnitten. Ich freue mich üb
FREE

FX Correlation Matrix ist ein leistungsstarkes Multi-Timeframe-Dashboard, das Händlern hilft, Echtzeit-Währungskorrelationen von bis zu 28 Symbolen auf einen Blick zu analysieren. Mit anpassbaren Einstellungen, schlankem Design und manueller Symbolauswahl erhöht es die Handelsgenauigkeit, reduziert das Risiko und identifiziert profitable korrelationsbasierte Chancen. Einrichtung & Anleitung: MT5 Version hier herunterladen . Exklusiv für Sie: Das ist Ihre Chance, dem Markt einen Schritt voraus zu

** Alle Symbole x Alle Zeitrahmen scannen nur durch Drücken der Scanner-Taste ** *** Kontaktieren Sie mich , um Ihnen eine Anleitung zu schicken und Sie in die "Wolfe Wave Scanner Gruppe" aufzunehmen, damit Sie Ihre Erfahrungen mit anderen Nutzern teilen oder sehen können. Einführung: Eine Wolfe Wave wird mit Fünf-Wellen-Mustern im Preis erstellt. Sie zeigt Angebot und Nachfrage und einen Kampf um ein Preisgleichgewicht. Diese Wellen von Preisaktionen können Händlern helfen, die Grenzen des Tren
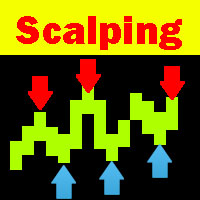
Scalping Explorer ist ein vollständiges Handelssystem. Unsere Händler haben ihre Arbeit auf maximale Wirkung getestet und optimiert. Der Handel mit Scalping Explorer ist einfach. In Metatrader4-Fenstern mit Währungspaaren öffnen: EURUSD, GBPJPY, GBPUSD, AUDUSD, USDCHF. Wir geben den D1-Zeitrahmen für alle Währungspaare an. Fügen Sie den Scalping Explorer-Indikator zu jedem Fenster mit einem Währungspaar hinzu. In den Anzeigeeinstellungen finden wir den Parameter "Signal" und setzen ihn auf TRUE
ALL MOVING AVERAGES: Der ultimative benutzerdefinierte Indikator für vielfältige Strategien Der benutzerdefinierte Indikator ALL MOVING AVERAGES ist Ihr unverzichtbares Werkzeug für eine umfassende technische Analyse, mit einer beeindruckenden Sammlung von über 31 der beliebtesten gleitenden Durchschnitte . Dieser Indikator wurde sowohl für erfahrene Trader als auch für Anfänger entwickelt und bietet eine unvergleichliche Flexibilität, die es Ihnen ermöglicht, Ihre gleitenden Durchschnitte perfe
FREE

Der Zwei-Perioden-RSI vergleicht langfristige und kurzfristige RSI-Linien und stellt zur besseren Visualisierung eine Füllung zwischen ihnen dar. Die Füllung ist je nach Aufwärtstrend (RSI der kurzen Periode über dem RSI der langen Periode) oder Abwärtstrend (RSI der kurzen Periode unter dem RSI der langen Periode) unterschiedlich gefärbt. Der kurzfristige RSI, der den langfristigen RSI kreuzt, liefert ein robusteres Trendbestätigungssignal als der RSI für eine einzelne Periode. Dies ist ein kle
FREE
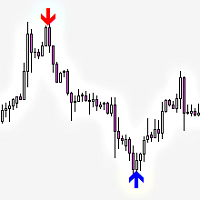
Railway Tracks Pattern - Umkehrmuster-Indikator Railway Tracks Pattern ist ein Indikator, der automatisch ein starkes Zwei-Kerzen-Umkehrmuster auf dem Chart erkennt. Er sucht nach zwei Kerzen mit entgegengesetzten Richtungen (bullish und bearish), die ähnlich groß sind und nur minimale Dochte aufweisen - ein klares Zeichen für einen Momentumwechsel. So funktioniert es: Die erste Kerze ist stark und richtungsweisend. Die zweite Kerze bewegt sich in die entgegengesetzte Richtung und ist von
FREE

MACD-Divergenz Einfache Ausgabe Die ursprüngliche MACD-Berechnung, aktualisiert, um eine doppelte Linie MACD, so dass das Urteil ist intuitiver und mehr im Einklang mit dem Großteil der Handelsplattform der Forschung Gewohnheiten, sondern auch automatisch markieren die Divergenz der soliden Linie, müssen nicht von 0 zu lernen, zu bohren beginnen.
Zur gleichen Zeit, biete ich auch eine Erinnerung Service, wenn Sie mit Hausarbeit beschäftigt sind nicht die Zeit haben, nur auf die Audio-, einmal
FREE

Oder (BD%), ein Volatilitätsindex, der die Volatilität in Prozent statt in Punkten misst. Die Idee von BD% besteht darin, einen Index in Abhängigkeit von der Classic Standard Deviation (CSD) zu erstellen, die sich zwischen 0 und 100 Prozent bewegt.
Sie können BD% verwenden, um die Volatilität für dasselbe Wertpapier in verschiedenen Zeiträumen oder Zeitrahmen zu vergleichen. Darüber hinaus können Sie BD% verwenden, um die Volatilität zwischen verschiedenen Wertpapieren in verschiedenen Märkten

Das Dashboard verwendet die Ichimoku-Strategie, um die besten Trades zu finden.
Erhalten Sie zusätzliche Indikatoren/Vorlagen: Und lesen Sie mehr über die detaillierte Produktbeschreibung und Verwendung hier: https://www.mql5.com/en/blogs/post/747457
Lesen Sie mehr über Scanner Common Features im Detail hier: https://www.mql5.com/en/blogs/post/747456
Merkmale:
Preis-Kumo-Ausbruch Tenkan-Kijun-Kreuzung Chikou/CLoud und Chikou/Preis Unterstützung/Widerstand (SR-SS oder SR-NRTR) Stochastik OB/OS

"Dieser Indikator erkennt Einträge basierend auf der Bystra-Muster-Theorie und liefert Einstiegswerte zur Platzierung von Limit-Orders mit Ziel- und Stopp-Levels. Dies ermöglicht es Ihnen, Ihr Risikoprozentsatz zu berechnen. Anmerkungen: Dieser Indikator verfügt über Puffer, die seine Verwendung in Expert Advisors (EAs) ermöglichen. Es ist wichtig, beim Arbeiten mit diesem Produkt eine gute Geldverwaltung zu praktizieren. Wenn Sie Ihren Zeitrahmen ändern, wird der Indikator die in Ihrer letzten
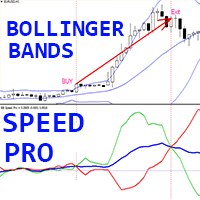
Einzigartiger Trendindikator für Krypto-Forex „Bollinger Bands Speed Pro“ für MT4, ohne Repainting.
– Die Berechnung dieses Indikators basiert auf physikalischen Gleichungen. – Die Geschwindigkeit ist die erste Ableitung der Standard-Bollinger-Bänder. – Der Bollinger Bands Speed Pro Indikator zeigt an, wie schnell die BB-Mittellinie und die BB-Grenzen ihre Richtung ändern. – Standardmäßig: Die blaue Linie entspricht der Geschwindigkeit der BB-Mittellinie, die rote Linie der Geschwindigkeit

Dies ist eine einfache Strategie, die auf den Ebenen BREAKOUT und FIBONACCI basiert.
Nach einem Ausbruch,
Entweder setzt der Markt die Bewegung direkt zu den Niveaus 161, 261 und 423 fort
oder es geht auf das 50 %-Niveau zurück (auch Korrektur genannt) und setzt danach höchstwahrscheinlich die Bewegung in die ursprüngliche Richtung bis zu den Niveaus 161, 261 und 423 fort.
Der Schlüssel des Systems ist die Erkennung des Breakout-Balkens, der durch ein grünes (AUFWÄRTS-TREND) oder rotes (ABW

Dieser Indikator Super Channel Pro Pluss indicator.indicator zeigt Trend Bewegung. indicator berechnet automatisch Linie. Eigenschaften
FiltPer -. zeigt Indikator Kanal Zeitraum. Abweichung zeigt die Abweichung des Indikatorkanals an. Abweichung2 - zeigt die zeigt die Abweichung des Indikatorkanals an. Abweichung3 - zeigt die zeigt die Abweichung des Indikatorkanals an. Wie ist der Status zu verstehen? Wenn der Pfeil nach oben zeigt und die Linienfarbe Teal ist, ist der Trend aufwärts gerichtet

Die universelle Strategie des Autors ermöglicht es, die Einstiegspunkte für Kauf und Verkauf sowohl in Richtung des Trends als auch bei Trendumkehrungen und in einem flachen Markt zu bestimmen. Der Indikator ist mit einem einzigartigen Scanner ausgestattet, der bei jedem Tick das Preisdiagramm analysiert und optimale Niveaus und Muster für das Finden von Einstiegspunkten durch eine der 3 Strategien berechnet. Jede der Strategien kombiniert Autorenformeln und Algorithmen. Für einen optimalen Hand

Dieser Indikator bietet die Möglichkeit, das SMC-Muster zu erkennen, im Wesentlichen eine verkürzte Version des Wyckoff-Modells. Sobald das Muster von RTO bestätigt wird, stellt es eine bedeutende Investitionsmöglichkeit dar. Es gibt zahlreiche Indikatoren, die sich auf SMC über den Markt hinaus beziehen, aber dies ist der erste Indikator, der Muster nutzt, um spezifische Aktionen von BigBoy zu identifizieren, um den Markt zu steuern. Aktualisierung 2024-03-08: Hinzufügen der Funktion TP by RR.

Entdecken Sie die Zukunft des Handels mit Easy Entry Points! Entwickelt von dem renommierten Felipe FX, Easy Entry Points ist die nächste Generation von Handelsindikatoren, die darauf ausgelegt ist, eine intuitive und effiziente Handels-Erfahrung zu bieten. Mit fortschrittlichen Funktionen und einer benutzerfreundlichen Benutzeroberfläche ist dieser Indikator die perfekte Werkzeug für Trader aller Niveaus. Hauptfunktionen: Einfacher Einstiegssignal: Identifizieren Sie ideale Einstiegspunkte b

Produkttitel Smart RSI (MT4) – Teil der SmartView Indicators Serie Kurzbeschreibung Ein RSI -Indikator mit einzigartiger Benutzererfahrung auf der MetaTrader-Plattform. Bietet erweiterte Funktionen, die zuvor nicht verfügbar waren, wie das Öffnen von Einstellungen per Doppelklick, das Ausblenden und Anzeigen von Indikatoren ohne Löschung und die Anzeige des Indikatorfensters in voller Chartgröße. Entwickelt für nahtlose Zusammenarbeit mit dem Rest der SmartView Indicators Serie. Überblick Die Sm
FREE

Necessary for traders: tools and indicators Waves automatically calculate indicators, channel trend trading Perfect trend-wave automatic calculation channel calculation , MT4 Perfect trend-wave automatic calculation channel calculation , MT5 Local Trading copying Easy And Fast Copy , MT4 Easy And Fast Copy , MT5 Local Trading copying For DEMO Easy And Fast Copy , MT4 DEMO Easy And Fast Copy , MT5 DEMO Fortgeschrittene Bollinger Bands:
1. Die Bollinger-Schiene ändert ihre Farbe mit der Richtung
FREE

Heikin Ashi ist das japanische Wort für "Durchschnittsbalken" und kann es Ihnen erleichtern, Trends zu erkennen. Unsere Version dieses beliebten Indikators passt die Größe der Kerzen an die Vergrößerungsstufe Ihres Charts an, so dass die Kerzen natürlicher erscheinen, wie die traditionellen Kerzen. Die Farben werden auf der Grundlage des Farbschemas ausgewählt, das Sie für Ihre Charts verwenden, können aber nach Belieben angepasst werden. Sie können auch wählen, ob nur die Heikin Ashi-Kerzen ode
FREE

Der MP Candle Countdown-Indikator mit Fortschrittsbalken ist ein Hilfsmittel für die technische Analyse, das die verbleibende Zeit bis zum Schließen der aktuellen Kerze auf einem Diagramm anzeigt, zusammen mit einem Fortschrittsbalken, der die seit dem Öffnen der Kerze verstrichene Zeit visuell darstellt. Dieser Indikator kann für Händler, die Candlestick-Charts verwenden, um Handelsentscheidungen zu treffen, hilfreich sein, da er sowohl die verbleibende Zeit bis zum Schließen einer Kerze als a
FREE
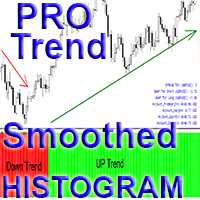
Crypto_Forex-Indikator „Pro Smoothed Trend Histogram“ für MT4, ohne Neuzeichnung.
– Der Pro Smoothed Trend Histogram-Indikator ist deutlich effizienter als herkömmliche gleitende Durchschnitte. – Er eignet sich besonders für die Erkennung großer Trends. – Der Indikator hat zwei Farben: Rot für einen bärischen Abwärtstrend und Grün für einen bullischen Aufwärtstrend (Farben können in den Einstellungen geändert werden). – Mit mobilen und PC-Alarmen. – Dieser Indikator lässt sich hervorragend mit

" ZigZag on Trend " phunukma manwi rang thangmani lama saimanna bagwi chubachu khlaio, abo hai kheno bar tei pip swngnai. Abo kaisa swlaijakmani phunuknai, kaisa swlaijakmani line zigzag hai khe phunukjak abo rangni lamao naitugwi tongo, tei kaisa counter abo swlaijakmani lamao barrokni bisingo thwngmani tei vertical scale-o pipsrokni mungno lekhago (lekhamungrok barni phuarjakmani sakao). Indicator no rang rwjak ya. Kwtal khe tongna bagwi, abo rangchakni bar eba line wngwi phunukjak. Joto timef

Alan Hulls gleitender Durchschnitt, reagiert empfindlicher auf die aktuelle Preisaktivität als der normale MA. Reagiert schneller auf den Trendwechsel, zeigt die Kursbewegung deutlicher an. Farbige Version des Indikators. Verbesserung der ursprünglichen Version des Indikators von Sergey <wizardserg@mail.ru>. Geeignet für alle Zeitrahmen.
Parameter Periode - Glättungsperiode, empfohlene Werte liegen zwischen 9 und 64. Je größer die Periode, desto glatter der Indikator. Methode - Glättungsmethode
FREE

Der TrueChannel-Indikator zeigt uns die wahren Kanäle der Preisbewegung an. Dieser Indikator ähnelt in seinem Erscheinungsbild dem Donchian-Kanal , basiert jedoch auf völlig anderen Prinzipien und liefert (im Vergleich zum Donchian-Kanal , der besser nur zur Einschätzung der Volatilität verwendet werden sollte) angemessenere Handelssignale. Wie im Artikel gezeigt, bewegt sich der Preis tatsächlich in Kanälen parallel zur Zeitachse und springt abrupt von den vorherigen Kanälen in die nachfolgende
FREE

Zeichnen Sie automatisch Unterstützungs- und Widerstandsniveaus PLUS Antriebskerzenlücken auf Ihrem Chart ein, so dass Sie sehen können, wohin sich der Preis wahrscheinlich als Nächstes bewegen und/oder möglicherweise umkehren wird.
Dieser Indikator wurde entwickelt, um als Teil der Positionshandelsmethodik verwendet zu werden, die auf meiner Website (The Market Structure Trader) gelehrt wird, und zeigt Schlüsselinformationen für die Zielsetzung und potenzielle Einstiege an.
Der Indikator ver

Produkttitel Smart ZigZag (MT4) – Teil der SmartView Indicators Serie Kurzbeschreibung Ein ZigZag -Indikator mit einzigartiger Benutzererfahrung auf der MetaTrader-Plattform. Bietet erweiterte Funktionen, die zuvor nicht verfügbar waren, wie das Öffnen von Einstellungen per Doppelklick, das Ausblenden und Anzeigen von Indikatoren ohne Löschung und die Anzeige des Indikatorfensters in voller Chartgröße. Entwickelt für nahtlose Zusammenarbeit mit dem Rest der SmartView Indicators Serie. Überblick
FREE

Wir stellen Ihnen einen Indikator vor, der nicht nur den visuellen Aspekt des Charts aufwertet, sondern ihm auch einen lebendigen, dynamischen Charakter verleiht. Unser Indikator ist eine Kombination aus einem oder mehreren gleitenden Durchschnittsindikatoren (MA), die ständig ihre Farbe ändern und so ein interessantes und farbenfrohes Aussehen erzeugen.
Da es sich bei diesem Produkt um eine grafische Lösung handelt, ist es schwierig, seine Funktionsweise in einem Text zu beschreiben; es ist e
FREE

Wie der Name schon sagt, ist Trend Maker Master ein Trend-Scalping-Indikator, der Long- und Short-Handelschancen auf der Grundlage von Preisaktionen und Trendfiltern bietet. Der Indikator Trendperiode und der Trend-Extra-Filter verändern die Qualität und Häufigkeit der Pfeilsignale, so dass der Trader für jedes Paar gute Kombinationen entwickeln kann. Wie man handelt : Kaufen: Wenn ein weißer Kaufpfeil angezeigt wird, setzen Sie sl unter das jüngste Swing-Tief und setzen Sie tp auf 1-1 Risiko-Er
FREE

HANDELSABLAUF MIT AUTO FIBO MUSANG + ALARMSIGNAL 1. Warten Sie auf den Ausbruchsalarm (Auto Signal) Das Auto Fibo Musang System löst automatisch ein Alarmsignal aus, wenn ein potentieller Ausbruch aus der vorherigen Preisstruktur erkannt wird.
Dies dient als frühzeitiges Signal , dass der Markt bereit sein könnte, sich zu bewegen. 2. Identifizieren Sie die Einstiegszone (Auto Fibo Levels) Die Einstiegszonen werden automatisch auf Basis der Fibonacci-Musang-Levels eingezeichnet:
FREE

War: $249 Jetzt: $99 Das Marktprofil definiert eine Reihe von Tagestypen, die dem Händler helfen können, das Marktverhalten zu bestimmen. Ein Schlüsselmerkmal ist der Value-Bereich, der den Bereich der Kursbewegung darstellt, in dem 70 % des Handels stattfand. Das Verständnis des Value-Bereichs kann Händlern einen wertvollen Einblick in die Marktrichtung geben und den Handel mit höheren Gewinnchancen festlegen. Es ist eine hervorragende Ergänzung zu jedem System, das Sie verwenden. Blahtech Limi
Wie jeder ZigZag-Indikator färbt sich auch dieser Indikator um . Verwenden Sie ihn also nur in Kombination mit anderen Indikatoren oder Strategien.
CyberZingFx ZigZag Arrow MT4 Indicator ist eines der besten Werkzeuge für Händler, die Trendumkehrungen an den Märkten erkennen wollen. Dieser leistungsstarke Indikator nutzt die ZigZag-Methode, um Ihnen dabei zu helfen, wichtige Unterstützungs- und Widerstandsniveaus zu identifizieren, was es einfacher macht, signifikante Preisveränderungen zu er
FREE
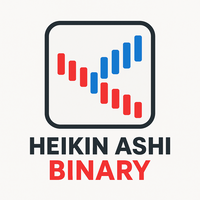
Heikin Ashi Binary – Visueller Trendunterstützungsindikator mit binärer Anzeige Übersicht Heikin Ashi Binary ist ein Indikator für MetaTrader, der Trendinformationen von Heikin Ashi in binärem Format (zweifarbige Blöcke) in einem Unterfenster anzeigt.
Anstelle traditioneller Kerzen stellt der Indikator Aufwärts- (bullisch) und Abwärtstrends (bärisch) als einfache farbige Blöcke dar.
Dies ermöglicht eine schnelle Erkennung von Trendfortsetzungen oder möglichen Umkehrpunkten. Der Indikator eignet
FREE
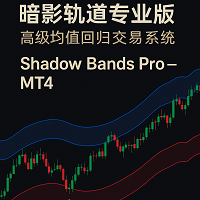
Shadow Bands Pro - MT4 说明(中英文) Englische Beschreibung (MT4) Shadow Bands Pro - Fortschrittliches Reversionssystem für MT4 Shadow Bands Pro ist ein Trendumkehr- und Mean-Reversion-Indikator, der für Trader entwickelt wurde, die klare, regelbasierte Ein- und Ausstiege benötigen, und der nicht auf Kerzenschluss basiert.
Durch die Kombination eines dynamischen Volatilitätsbandes, einer Entity-Break-Logik und eines eingebauten Statistik-Panels hilft er Ihnen, schnell zu erkennen, wo der Preis gede
FREE

Ein Indikator, der sowohl für Anfänger als auch für Profis geeignet ist. RECOMMEHDATION Handel mit diesem Indikator für 2-3 Wochen und Sie werden erhebliche Fortschritte in Ihrem Handel fühlen. Dieser Indikator wurde auf der Grundlage von HMA, Laguerre, CCI entwickelt. Der Indikator ist klar und erfordert keine Einstellung. Er wird nicht neu gezeichnet und funktioniert mit dem Eröffnungsbalken. Er funktioniert auf den Zeitrahmen M1-D1. Ich verwende Zeitrahmen M5, um den Markt zu betreten .
FREE

Dies ist ein Sharkfin Arrows Indikator. Ausführliche Erklärung und TDI-Extras: h ttps://www.mql5 .com/en/blogs/post/759138
This indicator will show only Arrows. It does not have TDI symbols on chart. Please get the extras from links above for TDI indicators.
Sharkfin Scanner (kostenpflichtig): https://www.mql5.com/en/market/product/123566
TDI Scanner Dash (kostenpflichtig): https://www.mql5.com/en/market/product/41826
Über: Dieser Indikator findet das Shark Fin Pattern. Er zeigt einen Pfeil
FREE

Ein klassischer MACD-Indikator, bei dem sowohl die MACD-Linie als auch die Signallinie als Linien dargestellt werden. Die Differenz zwischen MACD- und Signallinie wird als Histogramm angezeigt. Der Benutzer kann die Farbe und Dicke der Histogrammlinien ändern. So können die Histogrammlinien in vier verschiedene Gruppen eingeteilt werden: positiv aufsteigend, positiv absteigend, negativ absteigend und negativ aufsteigend. Ein Multiwährungs-Dashboard für den Indikator ist verfügbar unter https://w
FREE

Dieser Indikator identifiziert automatisch wichtige Unterstützungs- und Widerstandsniveaus durch die Analyse von Volumenmustern. Im Gegensatz zu traditionellen S/R-Tools, die sich nur auf den Preis verlassen, findet Volume S/R Niveaus, auf denen der Markt wirklich reagiert hat. ERKENNUNGSLOGIK : - Zonen mit hohem Volumen: Preisniveaus, auf denen starke Käufe/Verkäufe stattfanden - Zonen mit geringem Volumen: Bereiche von schwachem Interesse - potenzielle Ausbruchs- oder Umkehrzonen
INTELLIGENT
FREE

VeMAs ist ein innovatives Handelsinstrument, das Ihre Handelsstrategie durch die Analyse der Volumendynamik und der Marktstruktur verbessert. Ob Sie Anfänger oder erfahrener Trader sind, VeMAs verschafft Ihnen einen Vorteil. Der VeMAs -Indikator ist für nur $50 erhältlich. Der ursprüngliche Preis des Indikators beträgt $299
ZEITLICH BEGRENZTES ANGEBOT. Kontaktieren Sie mich nach dem Kauf, um einen personalisierten Bonus zu erhalten! Sie können absolut kostenlos ein cooles Dienstprogramm (VeMAs U

Nur eine weitere einfache Super-Trend-Indikator.
Auf dieser habe ich einen weiteren Puffer (auf Index 2), die auf EA verwendet werden kann hinzugefügt; die Werte ist -1, um eine Baisse-Trend zu identifizieren, während für bullish Trend der Wert 1 ist.
Hier ein Code-Schnipsel:
int trend = ( int ) iCustom ( NULL , Timeframe, "SuperTrend" , Period , Multiplier, 2 , 1 ); Es funktioniert auf jedem Zeitrahmen.
Wenn Sie Hilfe benötigen, um es in Ihren EA zu integrieren, zögern Sie nicht, mich zu ko
FREE

VWAP für Scalper
Sitzungsbewusste VWAP-Linien für schnelle, präzise Scalps. ️ Eingaben (MT4/MT5) Enable_Hourly_VWAP: Stündliches VWAP aktivieren. Enable_Asia_VWAP: Asiatisches Sitzungs-VWAP aktivieren. Enable_Europe_VWAP: Europäisches Sitzungs-VWAP aktivieren. Enable_NA_VWAP: Nordamerikanisches Sitzungs-VWAP aktivieren. Enable_Extended_VWAP: Erweitertes Sitzungs-VWAP aktivieren. Enable_Daily_VWAP: Tägliches VWAP aktivieren. Asiatische Sitzung (GMT) Session_Asia_Start_Hour: Startzeit asiatische
FREE

Tipu Trend ist ein intelligenter Indikator ohne Verzögerung, der den Trend ausgewählter Zeitrahmen anzeigt.
Merkmale Anpassbare Kauf-/Verkaufswarnungen, Push-Warnungen, E-Mail-Warnungen oder visuelle Warnungen auf dem Bildschirm. Ein einfach zu handhabender Indikator, der das Rauschen im Kursgeschehen glättet. Hebt die verschiedenen Märkte hervor. Fügen Sie Tipu Panel hinzu ( hier zu finden) und schalten Sie die folgenden zusätzlichen Funktionen frei. Ein einfach zu bedienendes Panel, das den T
FREE

Verbessern Sie Ihre Handelspräzision mit dem WH Handelssitzungen MT4 Indikator für MetaTrader 4! Dieses leistungsstarke Tool hilft Ihnen, wichtige Marktsitzungen mühelos zu visualisieren und zu verwalten. Basierend auf: WH SMC Indicator MT4
MT5-Version: WH Trading Sessions MT5 Hauptmerkmale: Interaktives GUI-Panel – Einfaches Auswählen und Umschalten zwischen Asien, London und New York Handelssitzungen.
Anpassbare Warnungen und Einstellungen – Passen
FREE

Der Precision Index Oscillator (Pi-Osc) von Roger Medcalf von Precision Trading Systems
Version 2 wurde sorgfältig neu codiert, um extrem schnell auf Ihrem Chart geladen zu werden, und es wurden einige andere technische Verbesserungen eingearbeitet, um die Erfahrung zu verbessern.
Pi-Osc wurde entwickelt, um genaue Handelstimingsignale bereitzustellen, die darauf abzielen, extreme Erschöpfungspunkte zu finden, an die die Märkte gezwungen werden, um einfach die Stops aller herauszunehmen.
Die
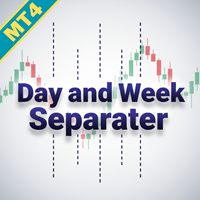
Optimieren Sie Ihre Handelsanalyse mit dem Day and Week Separator MT4, einem intuitiven Tool, das anpassbare Tages- und Wochentrennlinien zeichnet, ideal für Trader, die mit Zeitunterschieden zwischen Brokern zu kämpfen haben. In Handelsgemeinschaften wie Forex Factory und Reddit’s r/Forex wird dieses Tool für seine Einfachheit und Effektivität geschätzt, da es die häufige Herausforderung löst, Chart-Zeitrahmen mit lokalen oder marktspezifischen Zeiten abzustimmen, wie es in Diskussionen auf Pla
FREE

MarketSessions Indikator Das unverzichtbare Werkzeug zur Visualisierung globaler Marktsessions Der MarketSessions-Indikator ist ein leistungsstarkes MT4-Tool, das Tradern hilft, die wichtigsten Forex-Marktsessions direkt auf ihren Charts zu visualisieren. Durch die klare Darstellung der aktiven Handelszeiten der Märkte in Sydney, Tokio, London und New York unterstützt dieser Indikator Sie dabei, optimale Handelsperioden zu identifizieren und Marktvolatilitätsmuster zu verstehen. Hauptfunktionen:
FREE
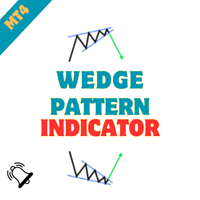
Wedge Chart Pattern Indicator - Entfesseln Sie die Kraft der Wedge Patterns in Ihrem Handel Begeben Sie sich mit dem "Wedge Chart Pattern Indicator" auf eine Reise des Präzisionshandels. Dieses fortschrittliche Tool wurde für den MetaTrader entwickelt und ist Ihr ultimativer Begleiter für die Identifizierung von Wedge Chart Patterns, der Sie in die Lage versetzt, fundierte und strategische Handelsentscheidungen zu treffen. Egal, ob Sie ein erfahrener Trader sind oder gerade erst anfangen, dieser
FREE

ECM Elite Channel ist ein volatilitätsbasierter Indikator, der mit einem speziellen Zeitalgorithmus entwickelt wurde, der darin besteht, mögliche Korrekturen auf dem Markt zu finden.
Dieser Indikator zeigt zwei äußere Linien, eine innere Linie (Retracement-Linie) und ein Pfeilzeichen, wobei die Kanaltheorie helfen soll, überkaufte und überverkaufte Bedingungen auf dem Markt zu erkennen.
Der Marktpreis wird im Allgemeinen zwischen den Grenzen des Kanals fallen. Wenn die Kurse den Kanal berühre

Breakout Sniper zeichnet Trendlinien mit Hilfe von verbesserten Fraktalen und stellt die Ausbruchs- und Umkehrpunkte dar.
KEIN AUTOMATISCHES NACHZEICHNEN VON TRENDLINIEN FÜR MEHRERE ZEITRAHMEN
*** DA DER STRATEGIETESTER VON MT4 PALTFORM NOCH NICHT UNTERSTÜTZT, MÜSSEN SIE NUR DIE EINGABEN DES "AKTUELLEN ZEITRAHMENS" TESTEN. Eine Trendlinie ist eine Linie, die über Pivot-Hochs oder unter Pivot-Tiefs gezeichnet wird, um die vorherrschende Richtung des Preises anzuzeigen . Trendlinien sind eine vis

Riesiger 70% Halloween-Sale nur für 24 Stunden!
Schicken Sie uns nach dem Kauf eine Nachricht, um weitere Informationen darüber zu erhalten, wie Sie Ihren GRATIS-BONUS erhalten, der in großartiger Kombination mit Bull vs Bear funktioniert! Bull versus Bear ist ein einfach zu bedienender Forex-Indikator, der Händlern klare und genaue Signale gibt, die auf eindeutigen Trendwiederholungen basieren. Vergessen Sie verzögerte Indikatoren oder stundenlanges Starren auf Charts, denn Bull vs Bear biet

Mit diesem Indikator erhalten Sie eine allgemeine Ablesung der Marktspanne unter Verwendung der Gann-Berechnungsmodi. Der Gann-Swing wird verwendet, um die letzten Marktbewegungen auf den ersten Blick zu erkennen. Die Grundlage dieser Swing-Berechnung ist die Anzahl der Kerzen in Bezug auf die Auf- und Abwärtsbewegung des Kurses. Wenn der Kurs das letzte Maximum nach oben durchbricht, wird der Swing nachgezeichnet, wenn eine bestimmte Anzahl von Kerzen vom letzten Minimum überschritten wird. Es

Einführung in den X3 Chart Pattern Scanner X3 Cherart Pattern Scanner ist ein nicht nachzeichnender und nicht nachlaufender Indikator zur Erkennung von X3 Chartmustern, einschließlich Harmonic Pattern, Elliott Wave Pattern, X3 Pattern und Japanese Candlestick Pattern. Historische Muster stimmen mit Signalmustern überein. So können Sie leicht eine solide Handelsstrategie in Ihrem Chart entwickeln. Noch wichtiger ist, dass dieser großartige Musterscanner das optimale Muster seiner Art erkennen kan
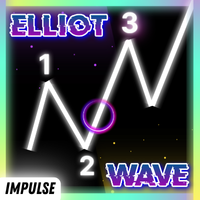
Riesiger 70% Halloween Sale nur für 24 Stunden!
Anleitung: Hier klicken Dieser Indikator ist nicht zu stoppen, wenn er mit unserem anderen Indikator namens Katana kombiniert wird. Schicken Sie uns nach dem Kauf eine Nachricht und Sie könnten ihn GRATIS als BONUS erhalten ! Der Elliot-Wellen-Impuls ist ein Muster , das in der Elliott-Wellen-Theorie identifiziert wurde, einer Form der technischen Analyse, die zur Analyse von Finanzmarktzyklen verwendet wird. Die Impulswelle gilt als der stärkst

Dies ist ein Indikator für Quasimodo oder Over and Under Muster. Er findet automatisch die Swing-Punkte und kann sogar virtuelle Trades mit Stop Loss und Take Profit platzieren. Drücken Sie die Schaltfläche "Optimieren", um automatisch die effektivsten Einstellungen zu finden. Das Muster besteht aus vier Schenkeln A,B,C,D, wie in den Abbildungen gezeigt. Die Eröffnungs- und Schlusskurse der virtuellen Trades sind Geldkurse, aber die Statistiken im Anzeigefeld berücksichtigen den aktuellen Spread
FREE
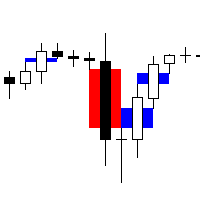
Fair Value Gap Scanner 4 ist ein hochentwickelter MetaTrader 5-Indikator, der entwickelt wurde, um Fair Value Gaps (FVGs) im Kursgeschehen zu erkennen und sie als Rechtecke direkt auf dem Chart anzuzeigen. Dieses leistungsstarke Tool unterstützt Händler durch die visuelle Darstellung von FVGs und ermöglicht es ihnen, potenzielle Handelsmöglichkeiten mit Leichtigkeit und Präzision zu identifizieren. Mit anpassbaren Parametern für Farbe, Breite und Stil können Händler das Erscheinungsbild des Indi
FREE

Einführung in den Timebox-Indikator Der Time Box Indicator ist ein unverzichtbarer Indikator für jeden Trader. Er zeigt tägliche, wöchentliche und monatliche Boxen an, je nach Ihren Präferenzen. Sie können jedoch alle wichtigen Kursniveaus in Ihrem Chart automatisch erweitern. Sie können diese als wichtige Unterstützungs- und Widerstandsniveaus verwenden. Es ist ein sehr einfaches, aber effektives Werkzeug für Ihren Handel.
Grafik-Einstellung Weißes Diagramm verwenden Linienstil für den aktuell
FREE

Dieser umfassende technische Indikator berechnet und zeichnet bis zu 3 gleitende Durchschnitte mit 3 verschiedenen Zeiträumen auf. Durch die Verwendung von drei gleitenden Durchschnitten mit unterschiedlichen Rückblickperioden kann der Händler feststellen, ob der Markt tatsächlich eine Trendänderung erfahren hat oder ob er lediglich eine kurze Pause einlegt, bevor er seinen vorherigen Zustand wieder aufnimmt. Das SX Golden MA Pack für MT5 ist hier erhältlich . Je kürzer die Periode des gleitend
FREE

Exklusive Ankunft: Zum ersten Mal präsentiert . Dies ist Ihre Geheimwaffe, um vorherzusagen, in welche Richtung der Wind bei der nächsten Marktverschiebung wehen wird. Es unterstützt Sie bei der Entwicklung Ihrer Handelsstrategie, indem es die Richtung der nächsten Kerze vorhersagt. Kompatibel mit Forex, Aktien und Kryptowährungen auf allen Zeitrahmen, aber höhere Zeitrahmen werden empfohlen. MT5 Version - https://www.mql5.com/en/market/product/108937/ Wie funktioniert es ? Es ist ziemlich orde
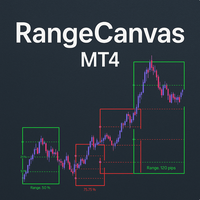
Tägliche Range-Boxen : Der Indikator zeichnet rechteckige Kästchen um die Höchst- und Tiefstkurse jedes Tages und schafft so eine klare visuelle Begrenzung für die tägliche Handelsspanne. Farbkodierte Logik : Grüne Boxen , wenn der aktuelle Kurs (oder Schlusskurs) über dem Tageseröffnungswert liegt Rote Kästchen , wenn der aktuelle Kurs unter dem Tageseröffnungswert liegt Prozentuale Level-Linien : Innerhalb jedes Kästchens werden drei horizontale Linien bei: 25% der täglichen Spanne 50% der Ta
FREE
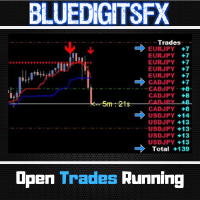
Kostenloses Utility Tool von BlueDigitsFx
Entwickelt, um den Arbeitsablauf und das Handelsmanagement zu verbessern
Auch für MetaTrader 5 verfügbar
Optionaler Zugang zu Updates & Support über den BlueDigitsFx Telegram Assistant Bot BlueDigitsFx Open Trades ist ein leistungsfähiges MT4-Tool, das Ihre gesamten Pips aus allen offenen Trades in Echtzeit anzeigt.
Seine intuitive, farbkodierte Oberfläche zeigt Ihnen schnell gewinnende und verlierende Trades für alle Währungspaare an.
Dies hilft Ihn
FREE
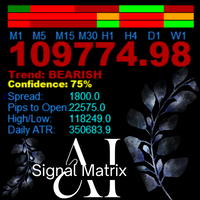
AanIsnaini Signal Matrix Multi-Timeframe Vertrauenssignal Dashboard AanIsnaini Signal Matrix ist ein leistungsstarker All-in-One-Indikator, der die Marktrichtung und das Vertrauensniveau über mehrere Zeitrahmen hinweg analysiert und es Händlern ermöglicht, die allgemeine Tendenz des Marktes auf einen Blick zu erkennen. Er kombiniert Signale von Price Action , Support-Resistance und mehreren bewährten technischen Instrumenten (MACD, ADX, RSI, MA Slope, ATR und Volume Ratio) und berechnet dann ein
FREE

Das Netsrac Supply&Demand Dashboard zeigt Ihnen auf einen Blick, wo sich relevante Zonen bei Ihren Lieblingswerten befinden. Öffnen Sie Ihren Chart direkt vom Dashboard aus und handeln Sie die Zonen, die wirklich wichtig sind. Funktionen
Findet die nächste relevante Angebots- und Nachfragezone und zeigt den Abstand zu dieser Zone an (in Pips) Findet und zeigt die Zonen in drei verschiedenen Zeitrahmen an Berechnet einen Trendindikator für die aktuelle und vergangene Kerze für jeden konfiguriert

Achtung! Freunde, da es in letzter Zeit viele Betrüger im Internet gibt, die Indikatoren namens ForexGump verkaufen, haben wir uns entschlossen, Sie zu warnen, dass nur auf unserer Seite die LIZENZ-AUTORENVERSION des Indikators verkauft wird! Wir verkaufen diesen Indikator nicht auf anderen Websites zu einem niedrigeren Preis als dieser! Alle Indikatoren sind billiger verkauft - Fälschungen! Und noch häufiger werden Demoversionen verkauft, die nach einer Woche nicht mehr funktionieren! Deshalb,

Dieser Indikator ermöglicht es Ihnen, Ihr Engagement zu verwalten und zu sehen, wie sich das Lot verändert. Sie können den optimalen Lot-Wert für Ihr Depot wählen, ohne echte Positionen zu eröffnen. Und Sie können auch neue Handelsinstrumente bewerten. Wenn Sie manuell handeln, wird Ihnen das Risikomanagement helfen, unerwartete Verluste zu vermeiden. Der Indikator bietet die Möglichkeit, bei Erreichen eines bestimmten Niveaus ein akustisches Signal zu erhalten sowie Push-Benachrichtigungen und
FREE
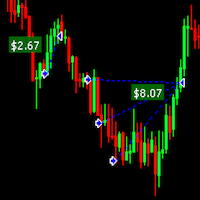
Der DrawProfit-Indikator kann jenen Händlern effizient helfen, die auf dem Chart alle geschlossenen Positionen sehen wollen: Gewinn oder Verlust. Wenn Sie DrawProfit auf Ihren Chart setzen, der von einem Expert Advisor (EA) verwaltet wird, werden Sie dessen Leistung anhand seiner Gewinne und Verluste deutlich sehen. Meine anderen Produkte: https: //www.mql5.com/en/users/hoangvudb/seller
Eingabe-Parameter: Show Profit Labels : zeigt den Gewinn von Aufträgen mit einem Label an (true/false). Gewin
FREE
Erfahren Sie, wie man einen Handelsroboter im MetaTrader AppStore, dem Shop für Applikationen für die MetaTrader Handelsplattform, kaufen kann.
Das Zahlungssystem der MQL5.community ermöglicht Zahlungen mit PayPal, Kreditkarten und den gängigen Zahlungssystemen. Wir empfehlen Ihnen eindringlich, Handelsroboter vor dem Kauf zu testen, um eine bessere Vorstellung von dem Produkt zu bekommen.
Sie verpassen Handelsmöglichkeiten:
- Freie Handelsapplikationen
- Über 8.000 Signale zum Kopieren
- Wirtschaftsnachrichten für die Lage an den Finanzmärkte
Registrierung
Einloggen
Wenn Sie kein Benutzerkonto haben, registrieren Sie sich
Erlauben Sie die Verwendung von Cookies, um sich auf der Website MQL5.com anzumelden.
Bitte aktivieren Sie die notwendige Einstellung in Ihrem Browser, da Sie sich sonst nicht einloggen können.