MA Dashboard MT5
- Indikatoren
- Version: 4.10
- Aktualisiert: 19 Juli 2026
- Aktivierungen: 10

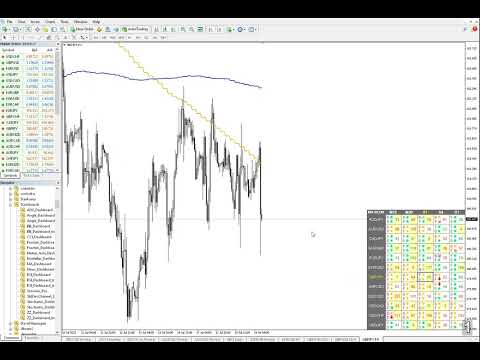
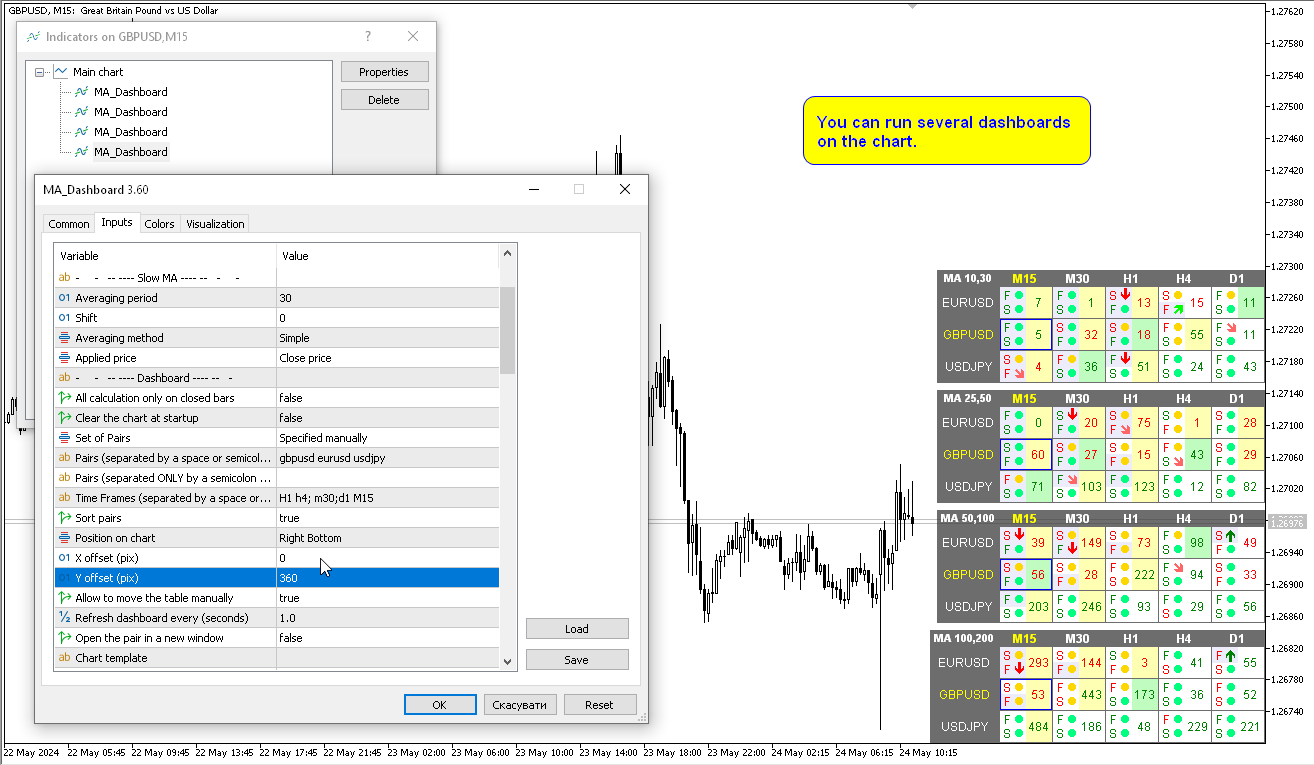
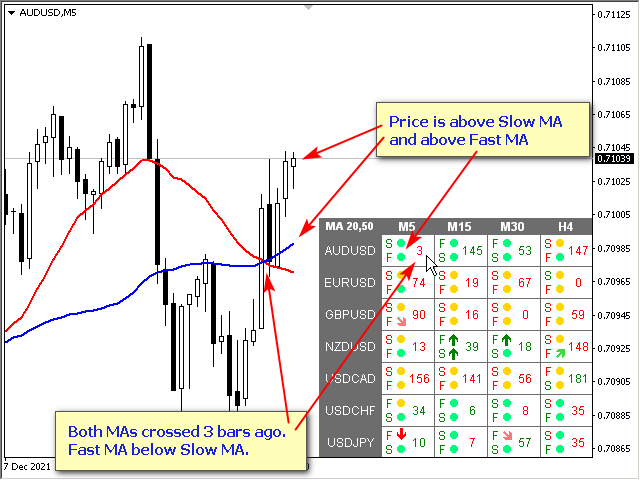
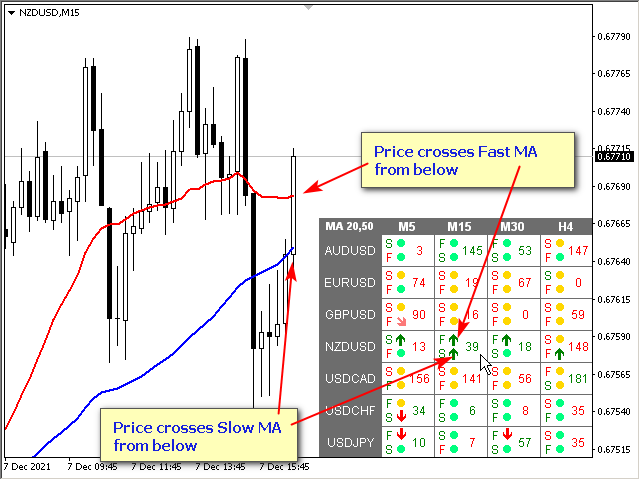
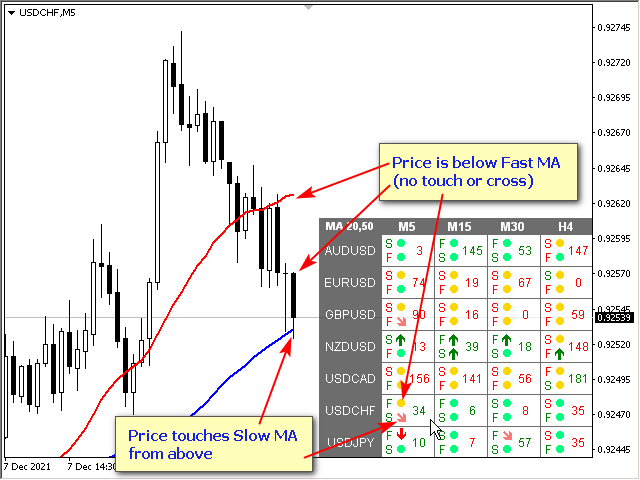
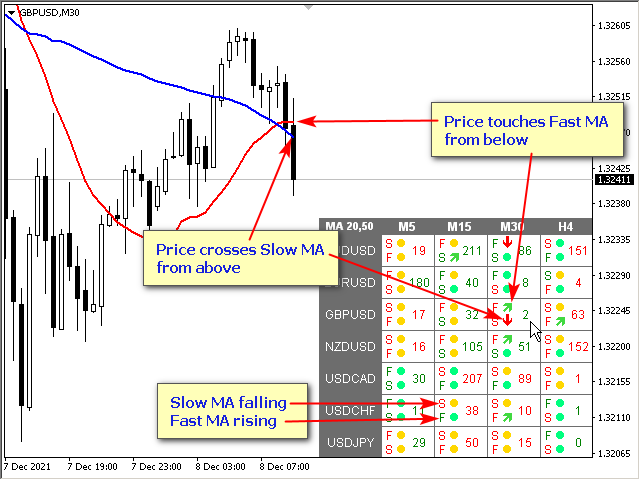
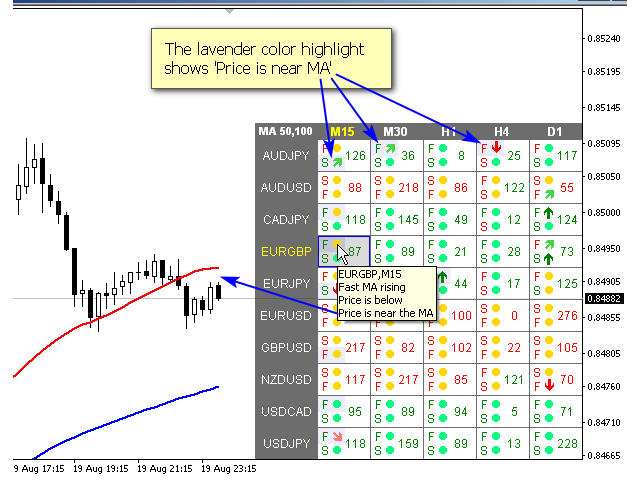
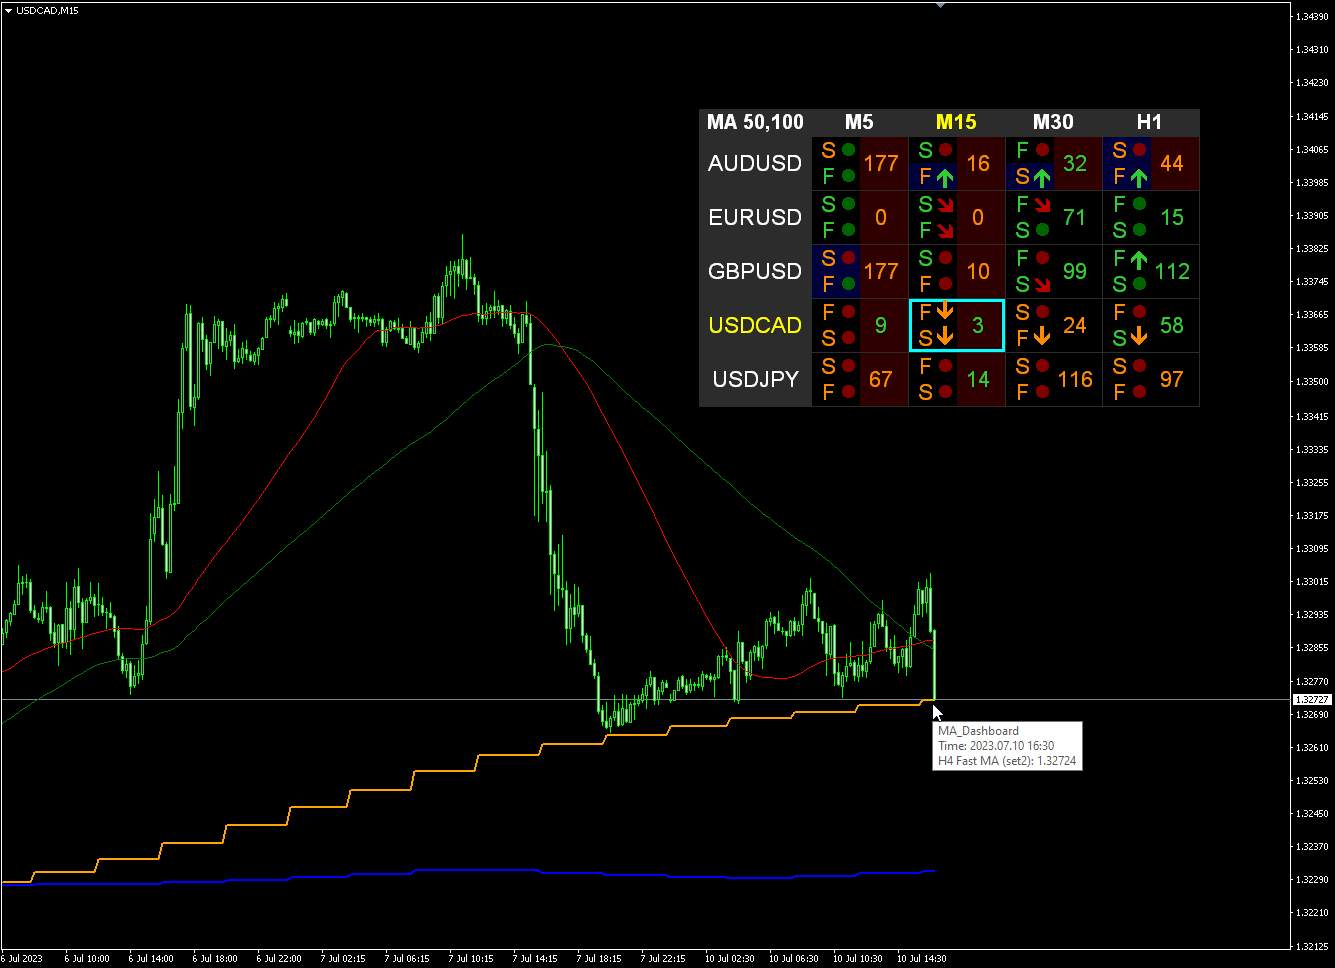
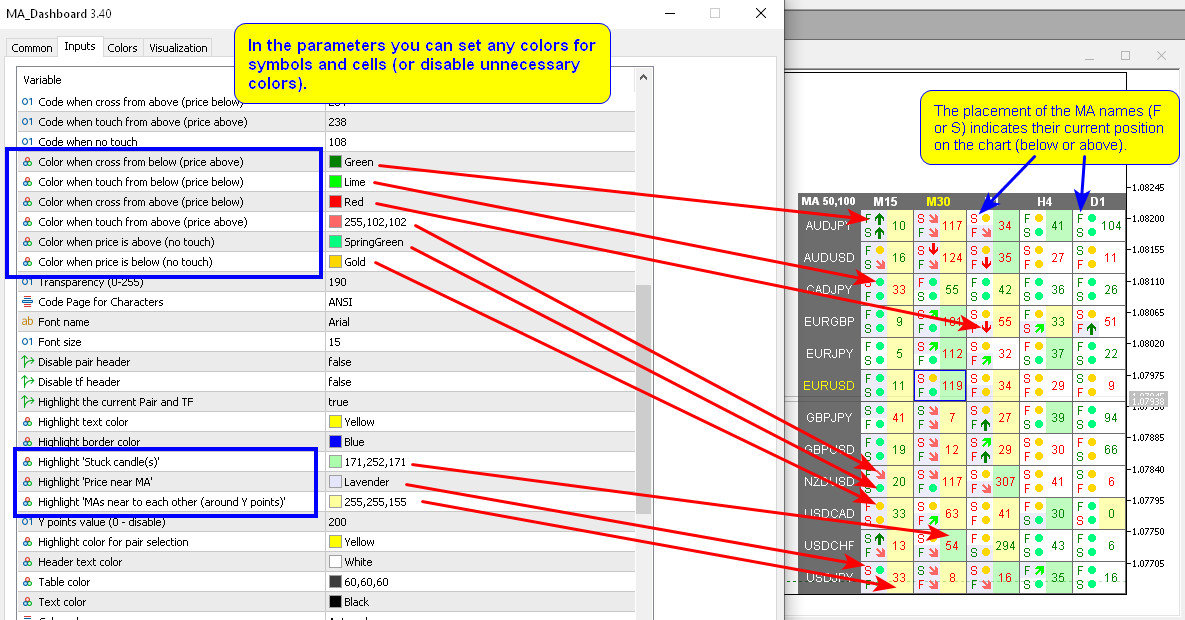
Mehrwährungs- und Mehrzeitrahmen-Modifikation des Indikators Moving Average (MA). Auf dem Dashboard können Sie den aktuellen Status des Indikators sehen – Ausbrüche und Berührungen (nach Preis) des Fast MA und Slow MA sowie die Schnittpunkte der MA-Linien untereinander (Moving Average Crossover). In den Parametern können Sie beliebige Währungen und Zeitrahmen angeben. Außerdem kann der Indikator Benachrichtigungen über den Preis senden, der die Linien berührt, und über deren Kreuzung. Durch Klicken auf eine Zelle mit einem Punkt werden dieses Symbol und dieser Punkt geöffnet. Dies ist MTF Scanner. Sie können mehrere Dashboards auf dem Diagramm ausführen.
Der Indikator zeigt Fast MA- und Slow MA-Linien auf dem aktuellen Diagramm an. Sie können den MA-Zeitrahmen für das Diagramm auswählen und MA aus anderen Zeitrahmen beobachten (MTF MA). Die Hotkeys für die beiden MA-Sätze sind standardmäßig „1“ und „2“.
Die Taste zum Ausblenden des Dashboards aus dem Diagramm ist standardmäßig „D“
Parameter
Fast MA
Averaging period — Durchschnittszeitraum.
Shift — Verschiebung.
Averaging method — Durchschnittsmethode.
Applied price — Angewandter Preis.
Slow MA
Averaging period — Durchschnittszeitraum.
Shift — Verschiebung.
Averaging method — Durchschnittsmethode.
Applied price — Angewandter Preis.
Dashboard
All calculation only on closed bar — Alle Berechnungen nur bei geschlossenem Balken.
Clear the chart at startup — Diagramm beim Start löschen.
Set of Pairs — Paarsatz
— Market Watch — Paare aus „Market Watch“ des MT.— Specified manually — Paare, die manuell angegeben wurden, in den Parametern „Paare“.— Current pair — nur das aktuelle Paar anzeigen.
Pairs (separated by a space or semicolon) — Liste von Symbolen, die durch Leerzeichen oder Semikolon getrennt sind. Die Währungsnamen sollten genau wie die des Brokers geschrieben werden, Groß-/Kleinschreibung und Präfix/Suffix sollten beibehalten werden.
Time Frames (separated by a space or semicolon) — Liste von Zeitrahmen, die durch Leerzeichen oder Semikolon getrennt sind (mehrere Zeitrahmen).
Sort pairs — Liste der Paare sortieren.
Position on chart — Ecke, in der das Panel auf dem Diagramm angezeigt wird.
X offset (pix) — Panel entlang der X-Achse verschieben;
Y offset (pix) — Panel entlang der Y-Achse verschieben;
Refresh dashboard every (seconds) — Aktualisierungszeitraum für alle Paare und Zeitrahmen.
Open the pair in a new window — durch Klicken ein Symbol in einem neuen Diagrammfenster öffnen.
Chart template — der Name der Vorlage für das Diagramm, wenn das Diagramm in einem neuen Fenster geöffnet wird.
Code when cross from below (price above) — Code bei Kreuzung von unten (Preis oben);
Code when touch from below (price below) — Code bei Berührung von unten (Preis unten);
Code when cross from above (price below) — Code bei Kreuzung von oben (Preis unten);
Code when touch from above (price above) — Code bei Berührung von oben (Preis oben);
Code when no touch — Code bei keiner Berührung;
Transparency (0-255) — Transparenz (0-255);
Font name — Schriftname;
Font size — Schriftgröße.
Warnungen
Timeframes for alerts (separated by a space or semicolon) — Zeitrahmen für Warnungen (getrennt durch Leerzeichen oder Semikolon).
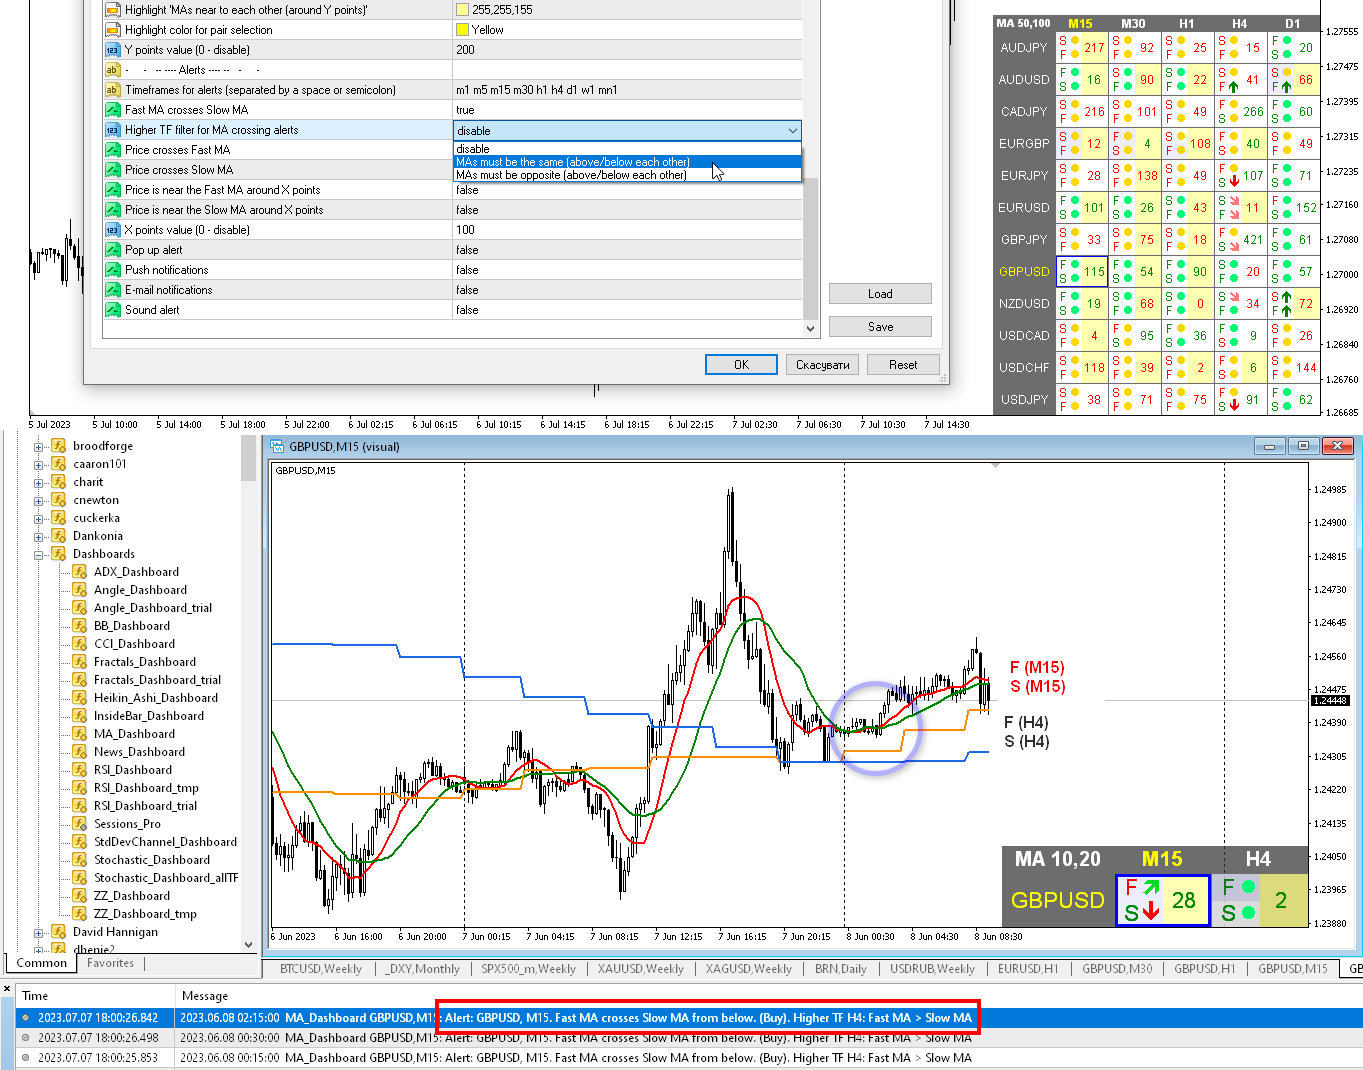
Fast MA crosses Slow MA — Schnelle MA kreuzt langsame MA;
Higher TF filter for MA crossing alerts — wenn der Filter aktiviert ist, prüft der Indikator bei Kreuzungen der MAs die MA-Werte aus dem nächsthöheren Zeitrahmen (auf dem Dashboard). Wenn die MAs aus dem höheren Zeitrahmen die angegebenen Bedingungen erfüllen, wird die MA-Kreuzungswarnung gesendet, andernfalls erfolgt keine Warnung.
- disable — deaktivieren
- MAs must be the same (above/below each other) — MAs müssen gleich sein (über/untereinander)
- MAs must be opposite (above/below each other) — MAs müssen entgegengesetzt sein (über/untereinander)
Price crosses Fast MA — Preis kreuzt Fast MA;
Price crosses Slow MA — Preis kreuzt Slow MA;
Price is near the Fast MA around X points — Preis liegt bei etwa X Punkten in der Nähe des Fast MA
Price is near the Slow MA around X points — Preis liegt bei etwa X Punkten in der Nähe des Slow MA
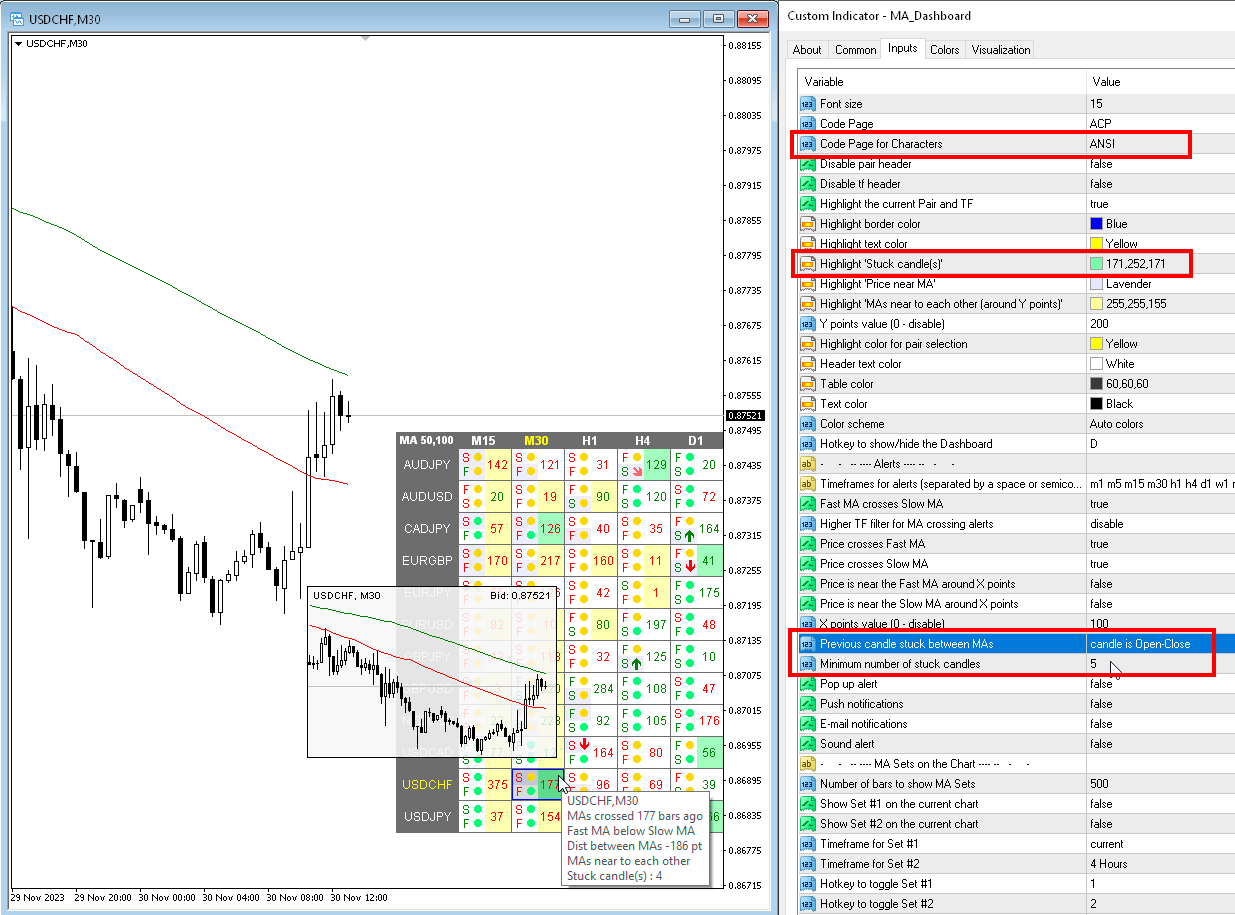
Previous candle stuck between MAs — Wenn die vorherigen Kerzen zwischen zwei MAs liegen, können Sie eine Benachrichtigung darüber erhalten oder dies in der Tabelle sehen.
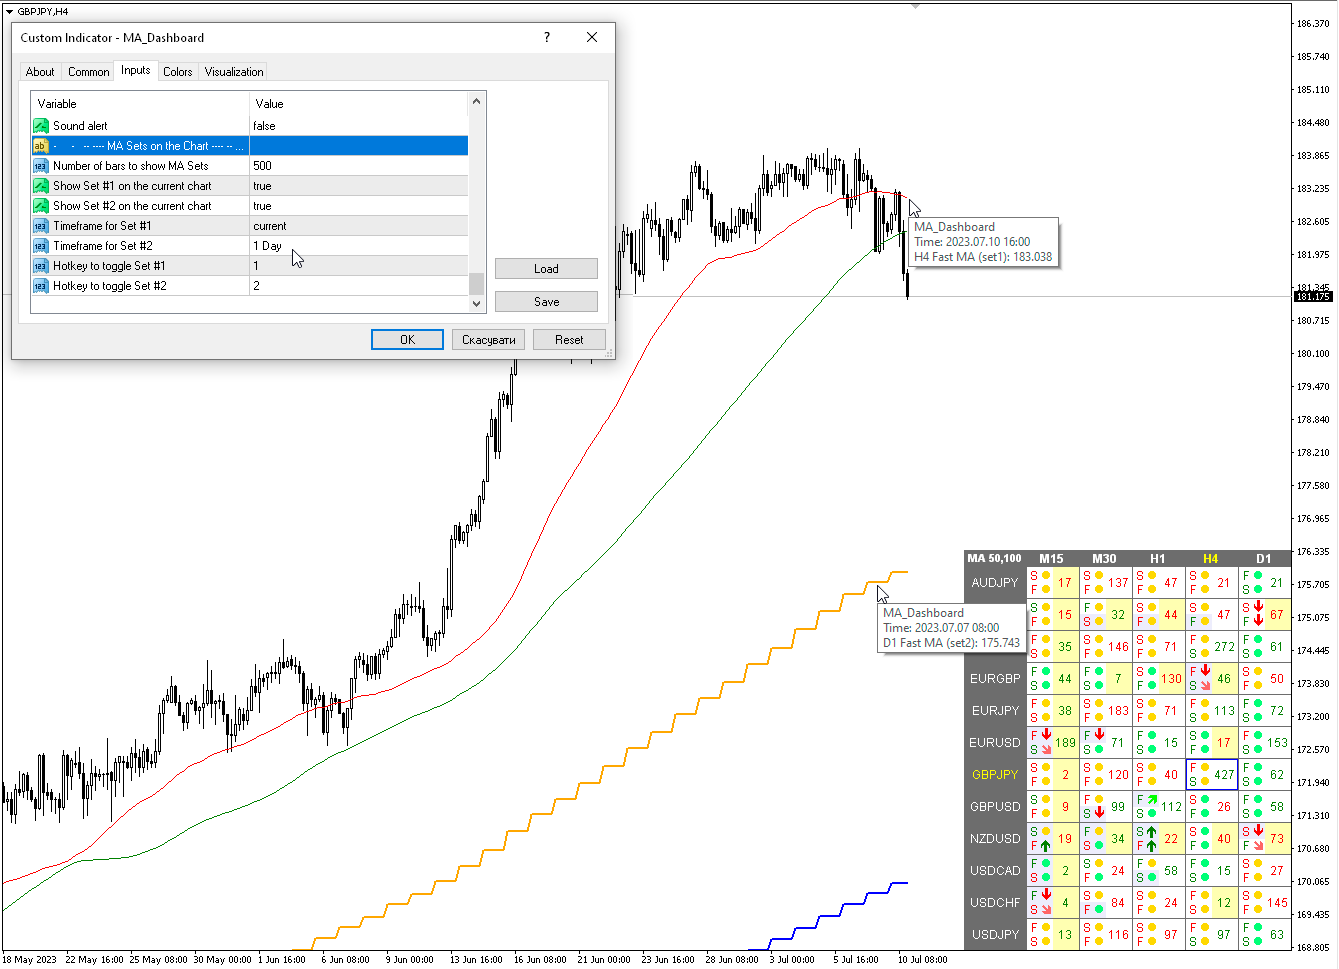
MA-Sets im Diagramm
Number of bars to show MA Sets — Anzahl der Balken, um MA-Sets anzuzeigen
Show Set #1 on the current chart — Set Nr. 1 im aktuellen Diagramm anzeigen
Show Set #2 on the current chart — Set Nr. 2 im aktuellen Diagramm anzeigen
Timeframe for Set #1 — Zeitrahmen für Set Nr. 1
Timeframe for Set #2 — Zeitrahmen für Set Nr. 2
Hotkey to toggle Set #1 — Hotkey zum Umschalten von Set Nr. 1
Hotkey to toggle Set #2 — Hotkey zum Umschalten von Set Nr. 2
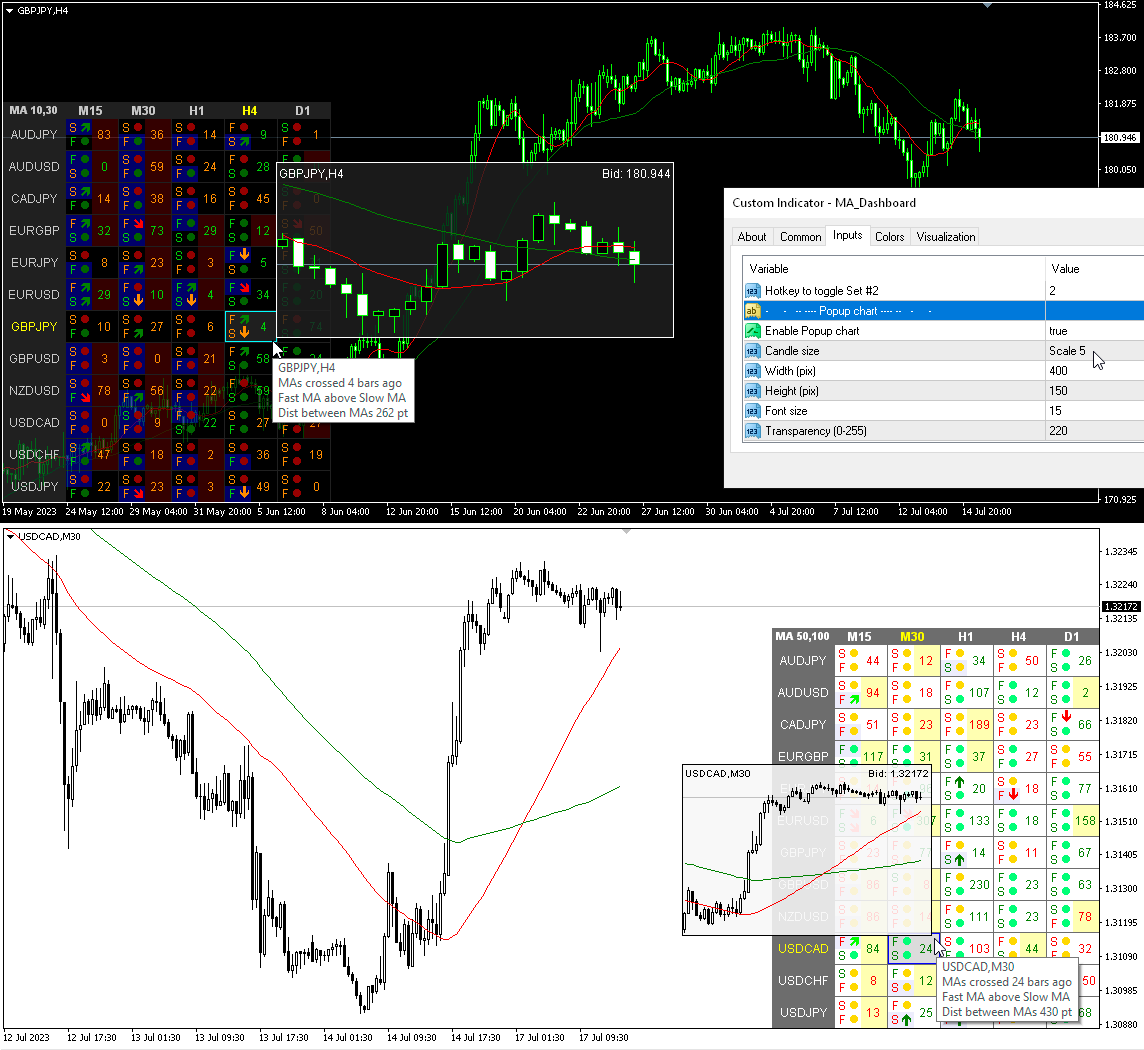
Popup-Diagramm
Enable Popup chart — Popup-Diagramm aktivieren
Candle size — Kerzengröße
Width (pix) — Breite (Pixel)
Height (pix) — Höhe (Pixel)
Font size — Schriftgröße
Transparency (0-255) — Transparenz (0-255)


I bought this indicator a few days ago and I can say it is really very use- and helpful !! As A. Forex already told it would be a good idea to integrate the MT5-standard indicators "Double Exponential Moving Average" and "Triple Exponential Moving Average" to this wonderful tool. To me I am using this both indicators constantly.