MA Dashboard MT5

5
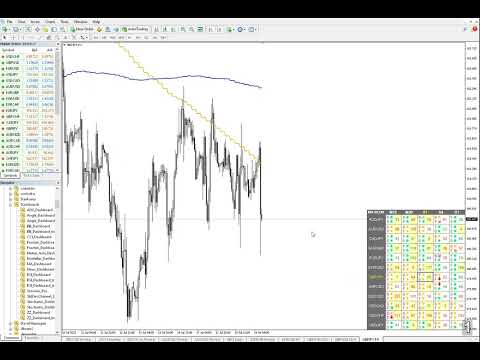
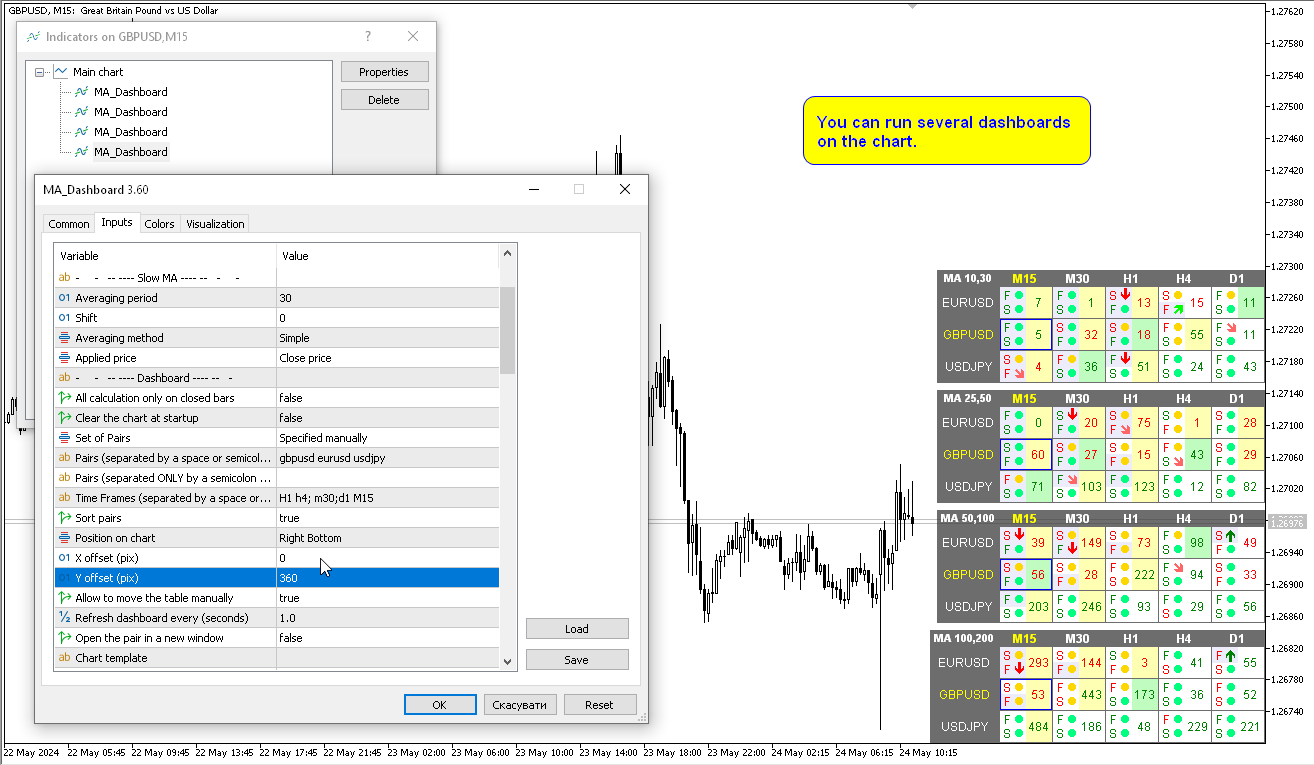
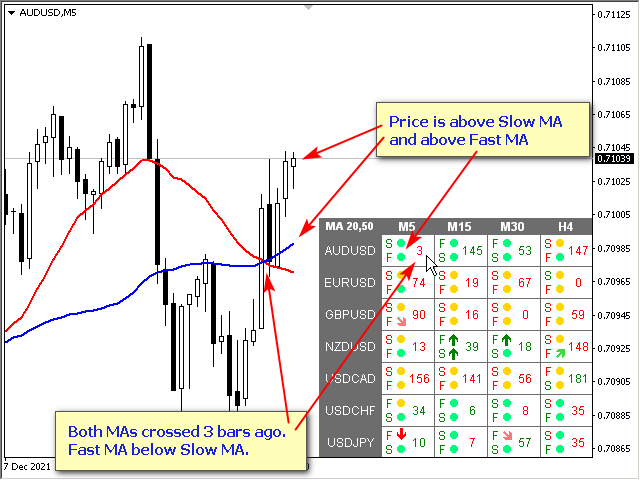
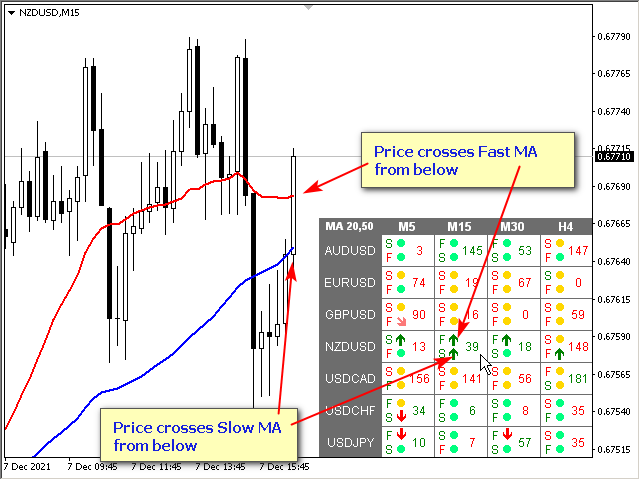
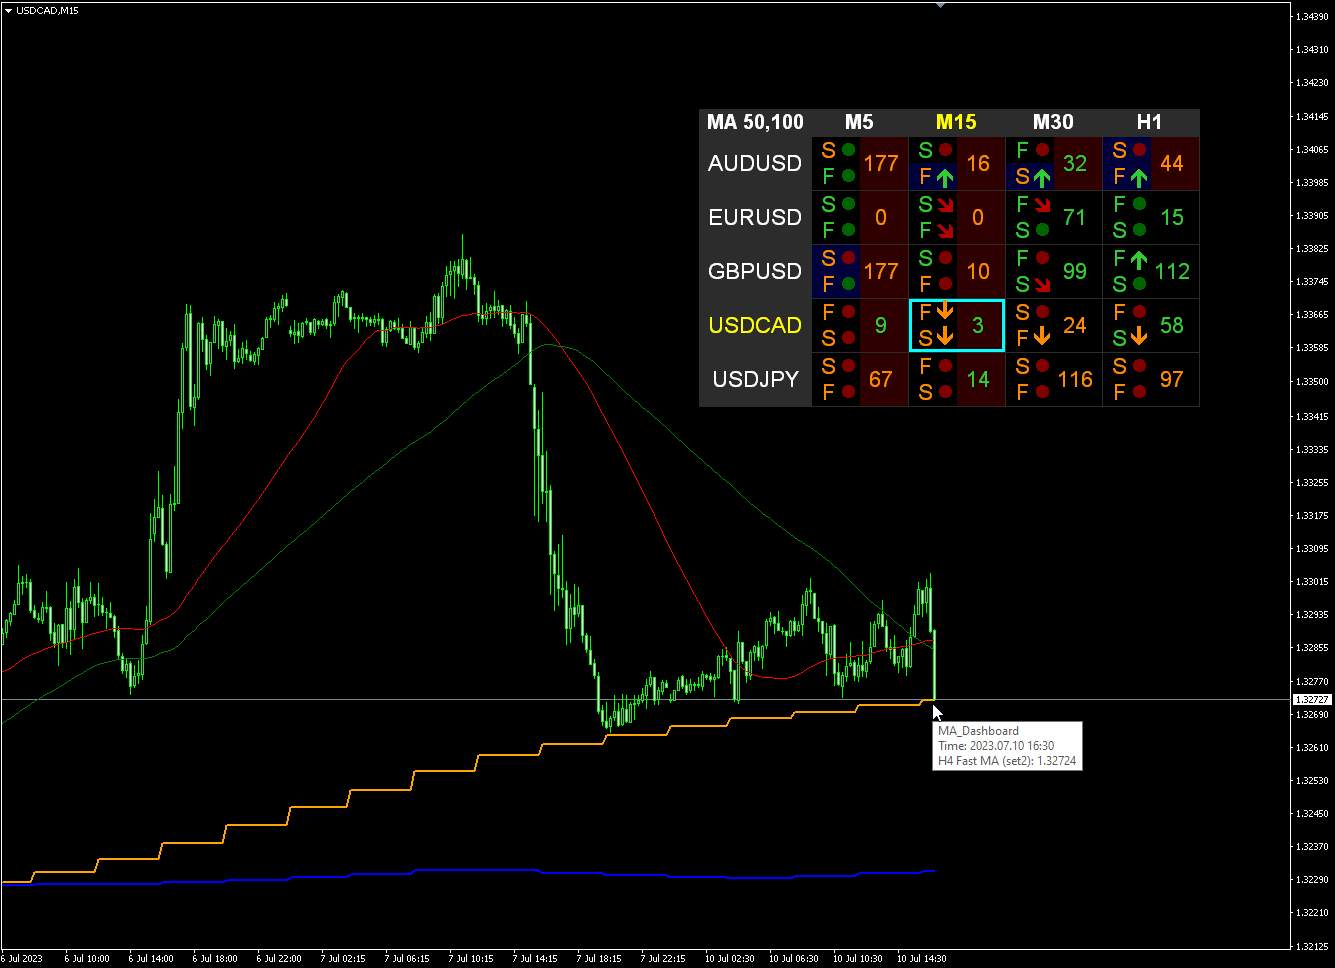
移動平均 (MA) インジケーターのマルチ通貨およびマルチタイムフレームの変更。ダッシュボードでは、インジケーターの現在の状態 (Fast MA と Slow MA のブレイクアウトとタッチ (価格別)、および MA ライン同士の交差 (移動平均クロスオーバー)) を確認できます。パラメーターでは、任意の通貨とタイムフレームを指定できます。また、インジケーターは、価格がラインに触れたことやラインが交差したことについて通知を送信できます。ピリオド付きのセルをクリックすると、このシンボルと期間が開きます。これは MTF スキャナーです。チャート上で複数のダッシュボードを実行できます。

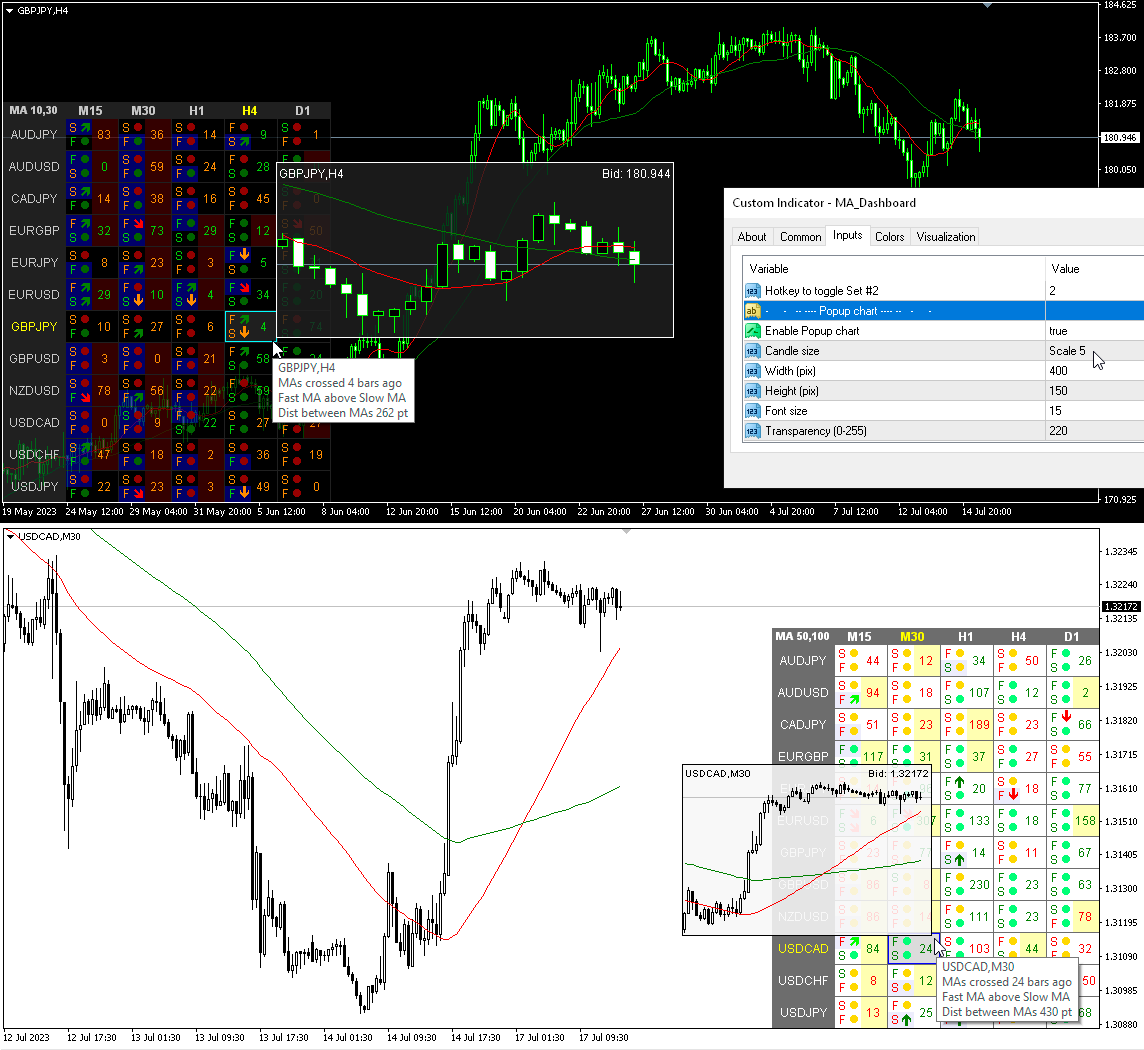
インジケーターは、現在のチャートに Fast MA と Slow MA ラインを表示します。チャートの MA タイムフレームを選択し、他のタイムフレーム (MTF MA) から MA を監視できます。2 セットの MA のホットキーは、デフォルトでは「1」と「2」です。

ダッシュボードをチャートから非表示にするキーは、デフォルトでは「D」です


パラメーター

Fast MA
Averaging period — 平均化期間.
Shift — シフト。
Averaging method — 平均化方法。
Applied price — 適用された価格。

Slow MA
Averaging period — 平均期間。
Shift — シフト。
Averaging method — 平均化方法。
Applied price — 適用された価格。

ダッシュボード
All calculation only on closed bar — すべての計算は閉じたバーに対してのみ行われます。
Clear the chart at startup — 起動時にチャートをクリア — 起動時にチャートをクリアします。
Set of Pairs — ペアのセット
— Market Watch — MTの「マーケットウォッチ」からのペア。
— Specified manually — パラメータ「ペア」で手動で指定されたペア。
— Current pair — 現在のペアのみを表示します。
Pairs (separated by a space or semicolon) — スペースまたはセミコロンで区切られたシンボルのリスト。通貨名は、ブローカーの名前とまったく同じように記述し、大文字と小文字、および接頭辞/接尾辞を維持する必要があります。
Time Frames (separated by a space or semicolon) — スペースまたはセミコロンで区切られた時間枠のリスト (複数の時間枠)。
Sort pairs — ペアのリストを並べ替えます。
Position on chart — チャートにパネルを表示するコーナー。
X offset (pix) — X 軸に沿ってパネルをシフトします。
Y offset (pix) — パネルを Y 軸に沿ってシフトします。
Refresh dashboard every (seconds) — すべてのペアと時間枠の更新期間。
Open the pair in a new window — クリックして新しいチャート ウィンドウでシンボルを開きます。
Chart template — チャートが新しいウィンドウで開く場合のチャートのテンプレートの名前。
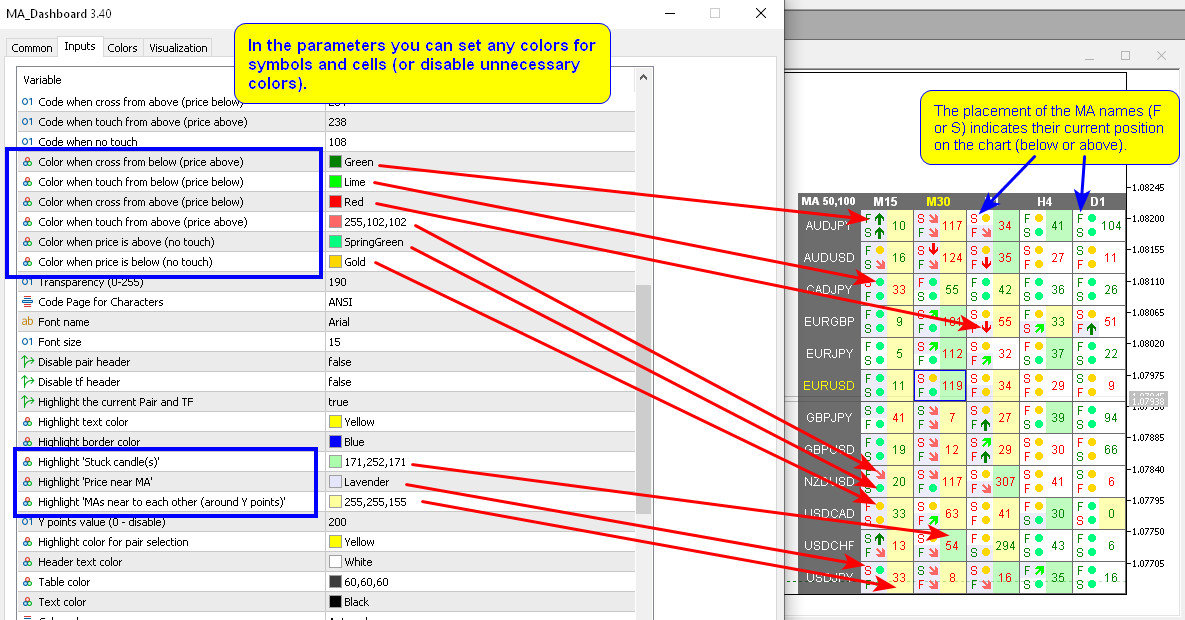
Code when cross from below (price above) — 下から交差する場合のコード (価格が上)
Code when touch from below (price below) — 下からタッチする場合のコード (価格が下)
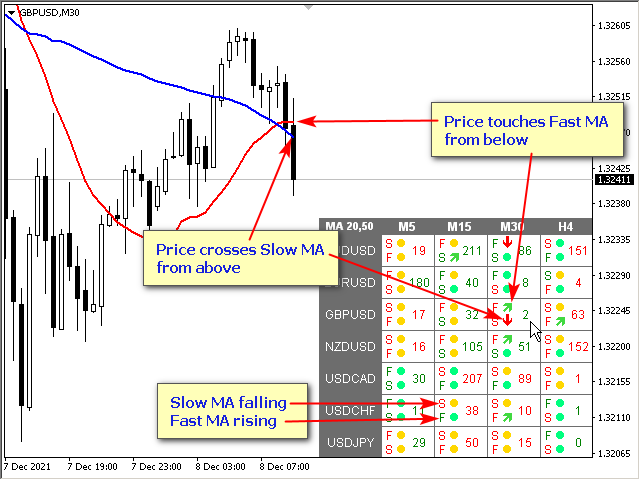
Code when cross from above (price below) — 上から交差する場合のコード (価格が下)
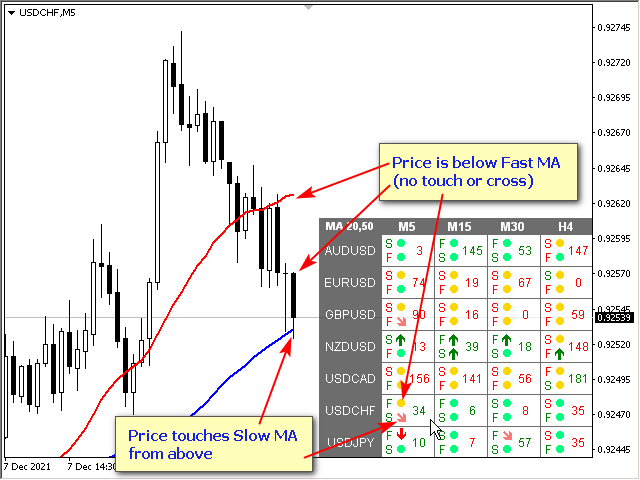
Code when touch from above (price above) — 上からタッチする場合のコード (価格が上)
Code when no touch — タッチしない場合のコード
Transparency (0-255) — 透明度 (0-255)
Font name — フォント名
Font size — フォント サイズ

アラート
Timeframes for alerts (separated by a space or semicolon) — アラートの時間枠 (スペースまたはセミコロンで区切る)。
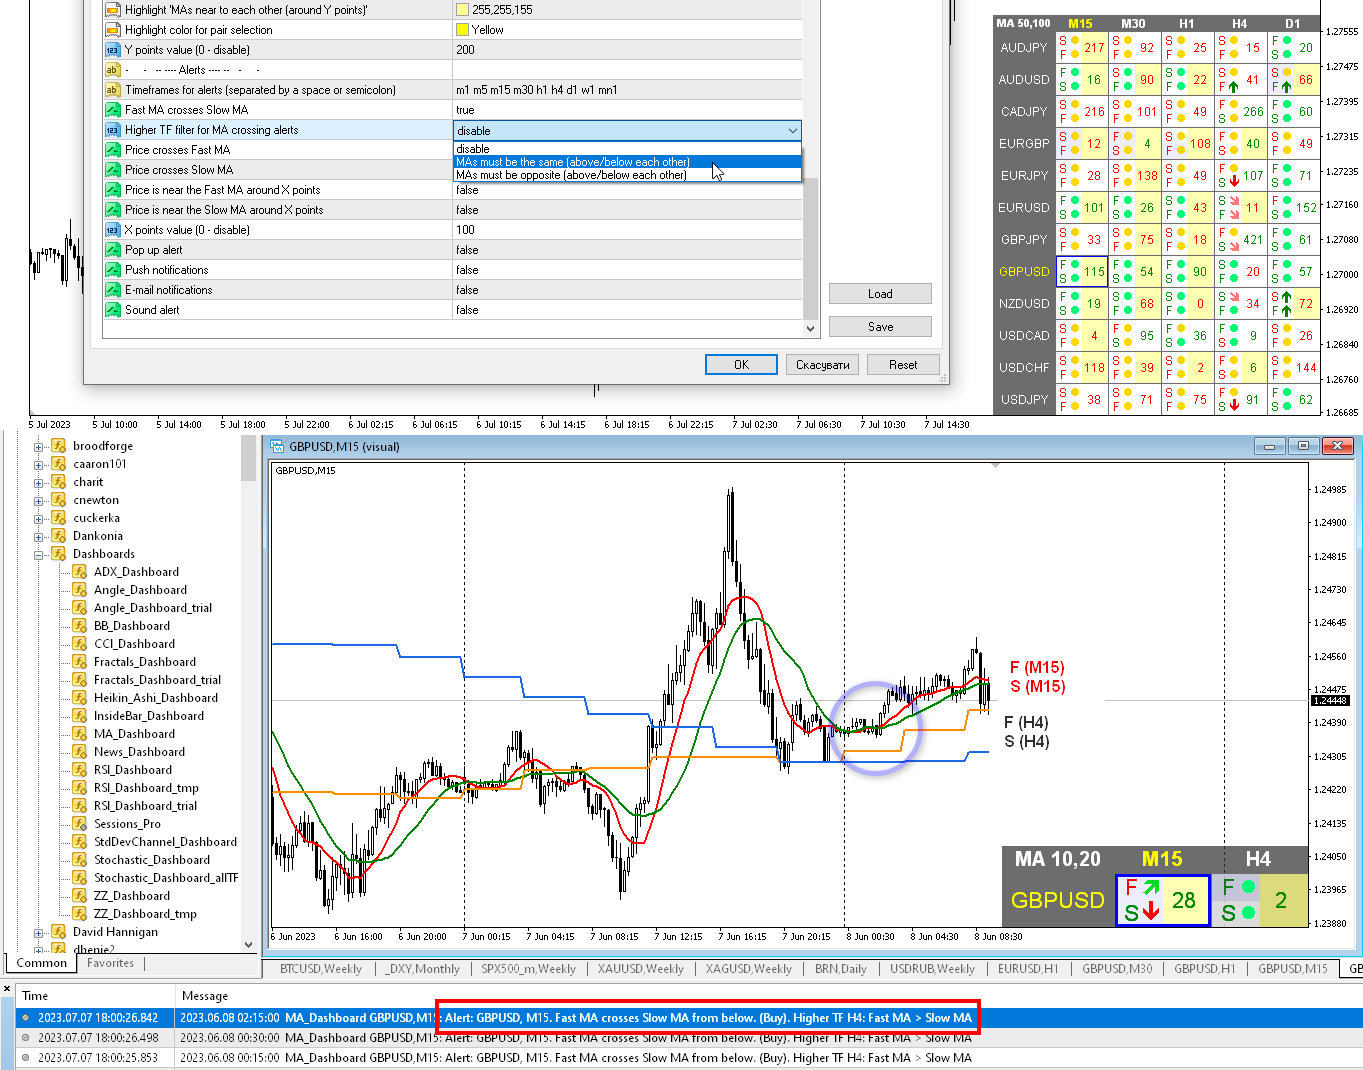
Fast MA crosses Slow MA — 高速 MA が低速 MA を交差します。
Higher TF filter for MA crossing alerts — フィルターを有効にすると、MA が交差するときに、インジケーターは次のより高い時間枠 (ダッシュボード上) の MA 値をチェックします。より高い時間枠の MA が指定された条件を満たす場合、MA 交差アラートが送信され、そうでない場合はアラートは送信されません。
  • disable — 無効
  • MAs must be the same (above/below each other) — MA は同じである必要があります (互いに上/下)
  • MAs must be opposite (above/below each other) — MA は反対である必要があります (互いに上/下)
Price crosses Fast MA — 価格が Fast MA を横切る
Price crosses Slow MA — 価格が Slow MA を横切る
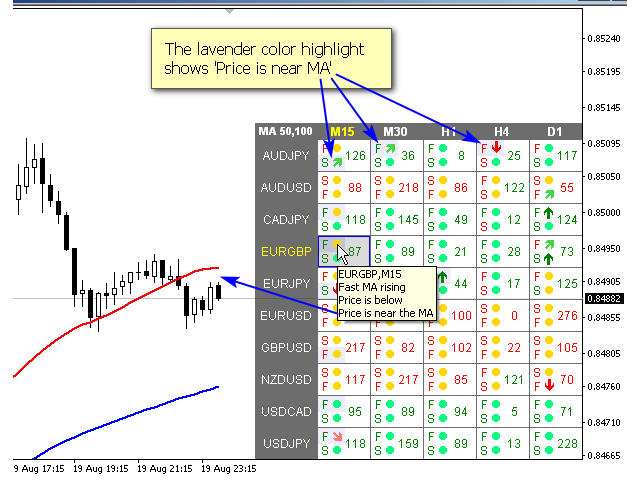
Price is near the Fast MA around X points — 価格が Fast MA の X ポイント付近にある
Price is near the Slow MA around X points — 価格が Slow MA の X ポイント付近にある
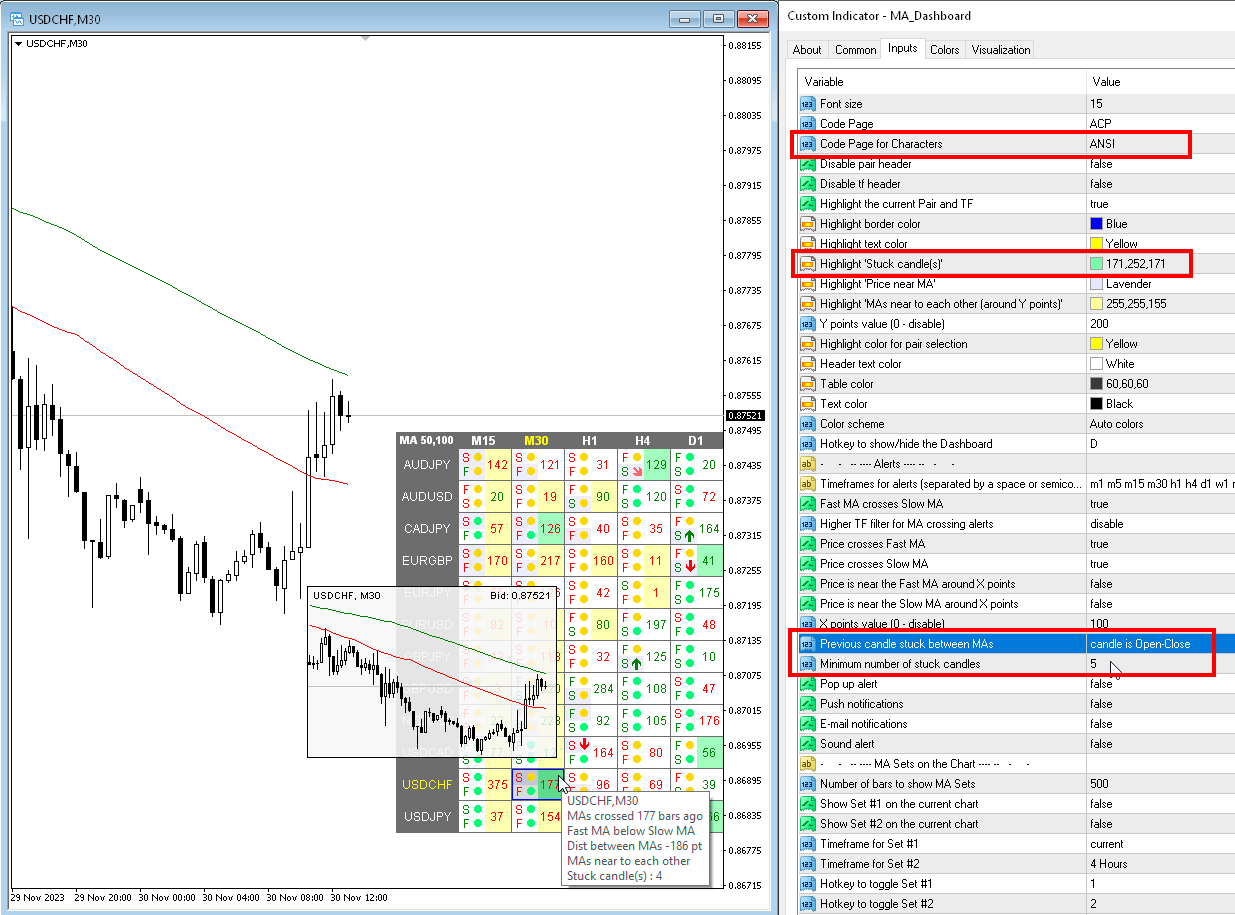
Previous candle stuck between MAs — 前のローソク足が 2 つの MA の間にある場合は、これに関するアラートを受信するか、テーブルで確認できます。
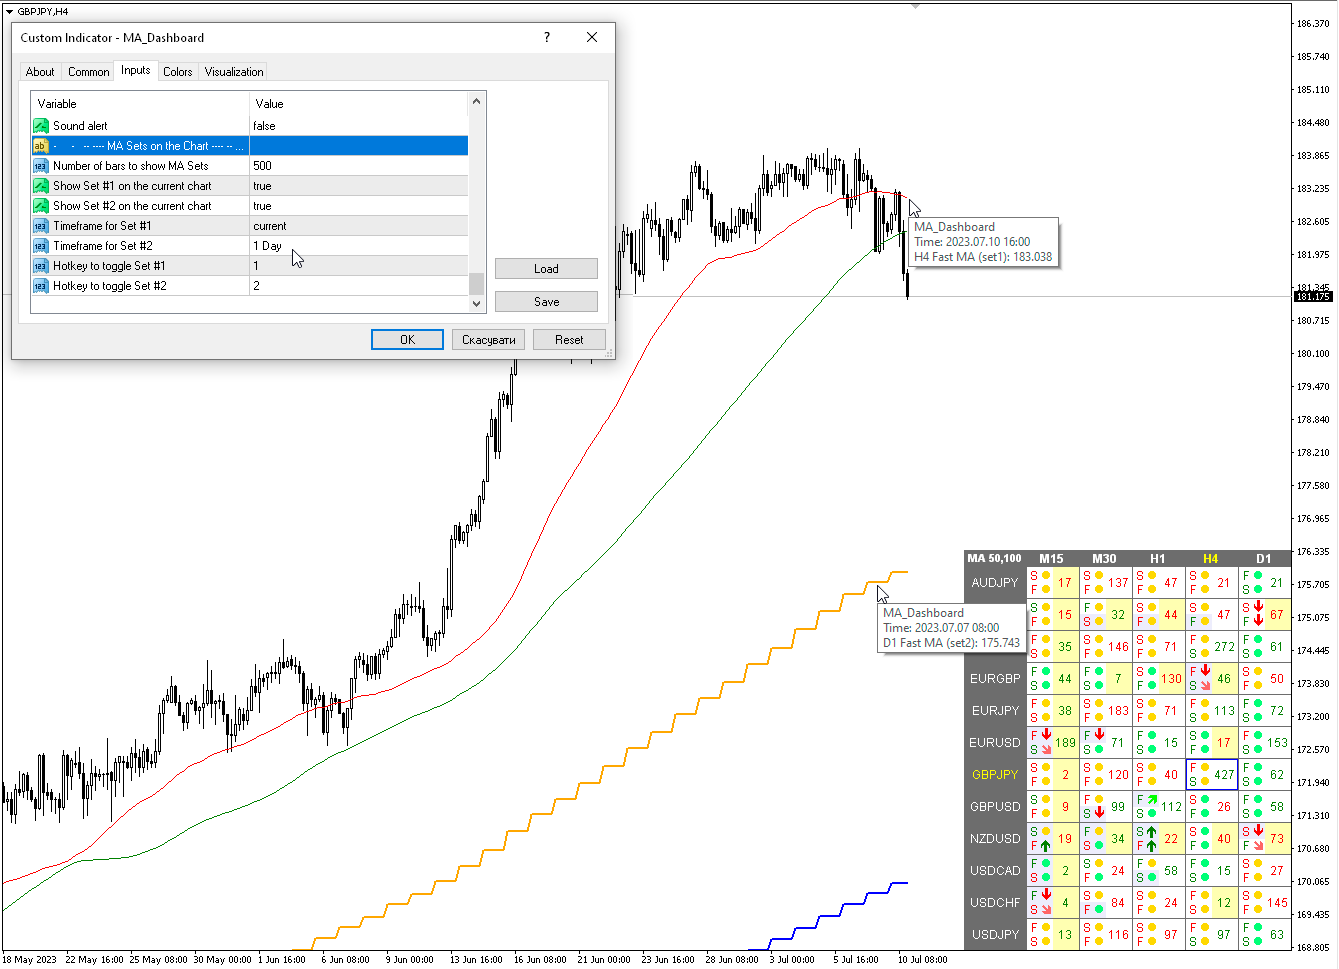
チャート上の MA セット
Number of bars to show MA Sets — MA セットを表示するバーの数
Show Set #1 on the current chart — 現在のチャートにセット #1 を表示
Show Set #2 on the current chart — 現在のチャートにセット #2 を表示
Timeframe for Set #1 — セット #1 のタイムフレーム
Timeframe for Set #2 — セット #2 のタイムフレーム
Hotkey to toggle Set #1 — セット #1 を切り替えるホットキー
Hotkey to toggle Set #2 — セット #2 を切り替えるホットキー

ポップアップ チャート
Enable Popup chart — ポップアップ チャートを有効にする
Candle size — ローソク足のサイズ
Width (pix) — 幅 (ピクセル)
Height (pix) — 高さ (ピクセル)
Font size — フォント サイズ
Transparency (0-255) — 透明度 (0-255)
レビュー 4
thomas
1409
thomas 2023.11.28 19:12 
 

I bought this indicator a few days ago and I can say it is really very use- and helpful !! As A. Forex already told it would be a good idea to integrate the MT5-standard indicators "Double Exponential Moving Average" and "Triple Exponential Moving Average" to this wonderful tool. To me I am using this both indicators constantly.

IK°L
826
IK°L 2023.11.27 20:50 
 

A great tool, an MA Multicurrency dashboard is essential, it has all kinds of alerts for different setups, it is very easy to read the information on the dashboard, it runs very fluid and without problems. It is a damn delight to explore the markets with these dashboards, I love the little popup window and the extraordinary attention that the developer always provides.

A. Forex
300
A. Forex 2023.10.12 14:57 
 

Great dashboard. Please add DEMA (Double EMA) into the range of MA. WOULD be super. Thank you. Спасибо!

おすすめのプロダクト
Crypto_Forex MT5用インジケーター「ダイナミック売られ過ぎ/買われ過ぎゾーン付きCCI」(リペイント機能なし) - コモディティ・チャネル・インデックス(CCI)は、トレンド方向へのモメンタムトレードに最適です。 - ダイナミック買われ過ぎゾーンからの売りエントリー、およびダイナミック売られ過ぎゾーンからの買いエントリーを、主要トレンド方向へ行うのに最適です。 - このインジケーターは、プライスアクションエントリーと組み合わせるのも効果的です。 - ダイナミック買われ過ぎゾーン - 黄色線より上。 - ダイナミック売られ過ぎゾーン - 青線より下。 - CCIオシレーターは、現在価格と過去平均価格の差を測定します。 - PCおよびモバイルアラート機能付き。 高品質のトレーディングロボットとインジケーターをご覧になるにはここをクリックしてください! これは、このMQL5ウェブサイトでのみ提供されるオリジナル製品です。
Phantom Bands – MT5 Indicator Zone-Based Reaction Levels for Price Action Traders Phantom Bands is a MetaTrader 5 custom indicator that draws multiple adaptive bands on your chart. These levels are designed to assist traders in identifying potential price interaction zones based on internal logic — particularly useful for short-term discretionary strategies. Description This indicator creates zone-based bands around internal pivots. The logic behind the bands is based on price interaction
MT4版  |  FAQ Owl Smart Levels Indicator は、 Bill Williams の高度なフラクタル、市場の正しい波構造を構築する Valable ZigZag、エントリの正確なレベルをマークする Fibonacci レベルなどの一般的な市場分析ツールを含む 1 つのインジケーター内の完全な取引システムです。 利益を得るために市場と場所に。 戦略の詳細な説明 インジケータを操作するための指示 顧問-取引助手 プライベートユーザーチャット ->購入後に私に書いて、私はプライベートチャットにあなたを追加し、あなたはそこにすべてのボーナスをダウンロードすることができます 力はシンプルさにあります! Owl Smart Levels 取引システムは非常に使いやすいので、専門家にも、市場を勉強し始めて自分で取引戦略を選択し始めたばかりの人にも適しています。 戦略と指標に秘密の数式や計算方法が隠されているわけではなく、すべての戦略指標は公開されています。 Owl Smart Levels を使用すると、取引を開始するためのシグナルをすばやく確認し、注文を出すための
STRICTLY FOR BOOM INDEX ONLY!!!!! Here I bring the Maximum Trend Arrows OT1.0 MT5 indicator. This indicator is made up of a combination of different trend indicators for entries and exits, for entries an orange arrow will paint on the chart below the current market and a red flag for closing of trades and it produces buy arrows only. When the orange arrow appears, it will appear along with it's sound to notify you. The 1H timeframe is recommended, don't use it anywhere else than on the 1H timefr
This trading indicator is non-repainting, non-redrawing, and non-lagging, making it an ideal choice for both manual and automated trading. It is a Price Action–based system that leverages price strength and momentum to give traders a real edge in the market. With advanced filtering techniques to eliminate noise and false signals, it enhances trading accuracy and potential. By combining multiple layers of sophisticated algorithms, the indicator scans the chart in real-time and translates comple
The Antique Trend Indicator is a revolutionary trend trading and filtering solution with all the important features of a trend tool built into one tool! The Antique Trend indicator is good for any trader, suitable for any trader both for Forex and binary options. There is no need to configure anything, everything has been perfected by time and experience, it works great during flats and trends. The Antique Trend indicator is a tool for technical analysis of financial markets, reflecting curren
Supertrend indicator uses a combination of a moving average and average true range to detect the trend of a trading instrument. Supertrend indicator for MetaTrader 5 easily shows the trend as a line following the price. Triple SuperTrend Histo indicator  calculate  three supertrends to show the trend as a histogram. Changing the color from red to green means you can BUY , from green to red means you can SELL . Description of the method of drawing a histogram. The price is above the EMA 200,
The Trend Detect indicator combines the features of both trend indicators and oscillators. This indicator is a convenient tool for detecting short-term market cycles and identifying overbought and oversold levels. A long position can be opened when the indicator starts leaving the oversold area and breaks the zero level from below. A short position can be opened when the indicator starts leaving the overbought area and breaks the zero level from above. An opposite signal of the indicator can b
Multiple Timeframe MACD indicator. This indicator was built for making multiple timeframe analysis possible in MT5 using MACD Indicator. MACD Indicator traditionally shows two lines and one histogram. MACD Line(Yellow) is calculated by subtracting 12period EMA(fast) from 26period EMA (slow). Signal Line(Blue) is created by a 9period EMA from MACD Line. Histogram is just the difference between MACD and Signal lines. Histogram is colored based on the difference between its value and the previous h
An customize Indicator by which you can have Triple moving averages at close prices and send push notification on each crossing.  This indicator is especially useful when you are doing manual trading. Notes: Cation: forex trading is a very risky business,...              don't invest the money you cannot bear to lose.             the probability of losing is high ... more high aaaand exponentially high.... something like EMA enjoy losing with us...
This indicator builds upon the previously posted Nadaraya-Watson smoothers. Here we have created an envelope indicator based on Kernel Smoothing with integrated alerts from crosses between the price and envelope extremities. Unlike the Nadaraya-Watson estimator, this indicator follows a contrarian methodology. Please note that by default this indicator can be subject to repainting. Users can use a non-repainting smoothing method available from the settings. The triangle labels are designed so
The First Dawn indicator uses a unique mechanism to search and plot signals. This keeps searching for signals, making it a great indicator for scaping and identification of changes in direction, swing trading and trend trading. The    First Dawn     helps you get early signals. The backtest gives the true picture of how the indicator works with real/demo accounts. Although this is a tiny indicator it is packed with advantageous settings that will help you whether you desire to: Snap the Peaks a
Discover the Power of the Multi Timeframe MACD Scanner for MT5 The MTF  MACD Scanner indicator is a practical tool for traders using MetaTrader 5 (MT5). It takes the well-known MACD (Moving Average Convergence Divergence) indicator and turns its data into easy-to-read dashboard and candle colors on your chart. This helps you spot market trends, momentum shifts, and potential reversals without needing to analyze separate MACD lines and switch between timeframes. What Does It Do? This indicator cr
Технический индикатор Universal Oscillator является комбинацией торговых сигналов самых популярных и широко используемых осцилляторов. Индикатор представлен гистограммами, а также линиями fast и slow MA, что позволяет расширить список получаемых торговых рекомендаций и работать как по тренду, так и в боковом движении рынка. Таким образом, гистограммы позволяют определить момент пробоя ценовых значений и движение в новой фазе рынка, а линии указывают на зоны перекупленности и перепроданности.  Ос
KasTon Trend System: The Complete 2-in-1 Trading Strategy Identify the Trend, Confirm the Signal, and Trade with Confidence! Do you suffer from confusion while trading? Do you find it difficult to determine the market's direction? Are you tired of losing money on false signals? The KasTon Trend System is here as an integrated solution to all these problems. This is not just an indicator; it is a complete trading strategy built on the synergy of two powerful, custom-built indicators. Our main g
ReversalRadar: Precision Trend Identification Indicator Trade With Confidence, Trade With The Trend ReversalRadar is a powerful trend identification tool designed to give traders the edge in spotting high-probability trading opportunities. By accurately identifying the current market direction, this indicator allows you to align your trading strategy with the prevailing trend, significantly increasing your potential for profitable trades. Key Features: Real-time Trend Analysis : Dynamic visual s
PipFinite Trend PRO MT5
Karlo Wilson Vendiola
4.84 (558)
Breakthrough Solution For Trend Trading And Filtering With All Important Features Built Inside One Tool! Trend PRO's smart algorithm detects the trend, filters out market noise and gives entry signals with exit levels. The new features with enhanced rules for statistical calculation improved the overall performance of this indicator. Important Information Revealed Maximize the potential of Trend Pro, please visit www.mql5.com/en/blogs/post/713938 The Powerful Expert Advisor Version Automatin
The Riko Trend indicator is a revolutionary trend trading and filtering solution with all the important features of a trend tool built into one tool! The Riko Trend indicator is good for any trader, suitable for any trader for both forex and binary options. You don’t need to configure anything, everything is perfected by time and experience, it works great during a flat and in a trend. The Riko Trend indicator is a technical analysis tool for financial markets that reflects the current price f
Hush mt5
Iurii Plokhov
4.33 (3)
Hush mt5 is an advanced indicator that gives a signal about the overbought or oversold market in a certain period of time Hush mt5 the advantage of this indicator is that it does not disappear after the signal on the chart Suitable for any trade: forex, stocks, cryptocurrency, metals Hush mt5 can be used on any time period. The signal goes to the beginning of the next candle after the arrow Hush mt5 performed best on the period H1,H4,daily It can be used in addition to forex, in binary opt
A lot of professional traders use high quality divergence signals as a part of their strategy to enter a position. Spotting correct divergences quickly can often be hard, especially if your eye isn’t trained for it yet. For this reason we’ve created a series of easy to use professional oscillator divergence indicators that are very customisable so you get only the signals you want to trade. We have this divergence indicator for RSI, MACD, Stochastics, CCI and OBV. RSI:   https://www.mql5.com/en/
フラットとトレンドを決定するための指標。 価格が2つのヒストグラムと2つの線(赤と青)のいずれかを下回っている場合、これは売りゾーンです。 このバージョンのインジケーターを購入するときは、1つの実際のアカウントと1つのデモアカウント用のMT4バージョン-ギフトとして(受け取るには、プライベートメッセージを書いてください)! 価格が2つのヒストグラムと2つの線(赤と青)のいずれかを上回っている場合、これは購入ゾーンです。 MT4バージョン: https//www.mql5.com/en/market/product/3793 価格が2つの線の間、またはいずれかのヒストグラムのゾーンにある場合、市場に明確な傾向はありません。簡単に言えば、市場は横ばいです。 インジケーターの動作は、スクリーンショットでより明確に示されています。
Bollinger Trend Lines – MT4 & MT5 Bollinger Trend Lines is a professional volatility-based trend indicator designed to clearly identify trend direction and dynamic stop levels using Bollinger Bands. Fuses on one core principle: follow the trend, ignore noise, and let volatility define the stop. How it works The indicator builds trailing trend lines using Bollinger Bands: In an uptrend , the lower band trails price and can only rise In a downtrend , the upper band trails price and can only
Ultimate Boom and Crash Indicator The Ultimate Boom and Crash Indicator is a cutting-edge tool developed by  Coetsee Digital , designed to identify potential spike opportunities in the market. Crafted for traders focusing on Deriv and Weltrade synthetic markets, this indicator is optimized to operate exclusively on the 3-minute (M3), 5-minute (M5), 15-minute (M15), 30-minute (M30), and 1-hour (H1) timeframes and supports only the following pairs: PainX 1200, PainX 999, PainX 800, PainX 600, Pai
回帰取引を意味する専門的かつ定量的なアプローチを実装する独自の指標。これは、価格が予測可能かつ測定可能な方法で迂回して平均に戻るという事実を利用しており、非定量的な取引戦略を大幅に上回る明確な出入りルールを可能にします。 [ Installation Guide | Update Guide | Troubleshooting | FAQ | All Products ] 明確な取引シグナル 驚くほど簡単に取引できます カスタマイズ可能な色とサイズ パフォーマンス統計を実装します ほとんどの取引戦略を上回ります 適切なSLおよびTPレベルを表示します 電子メール/音声/視覚アラートを実装します 使い方 インディケータは、より高い時間枠からの完全にカスタマイズ可能な移動平均の周りの標準偏差を測定し、トレンドフォローアプローチを使用して正確に取引を見つけます。取引は、現在のチャートの価格アクションに飛び込むことによって見つけられ、価格が選択したより高い時間枠から計算された平均価格帯に戻ったときに閉じられます。それがコード化される方法のために、指標は高ボラティリティと強いトレンドの市場か
Heiken Ashi Smoothed Strategy is a very simple but powerful system to get forex market trend direction. This indicator is actually 2 indicators in 1 pack, Heiken Ashi and Heiken Ashi Smoothed Moving Average both included. Because HA (Heiken Ashi) and HAS (Heiken Ashi Smoothed) are calculated in the same one system event with necessary buffers and loop only, so it is the FAST, OPTIMIZED and EFFICIENT HA having the combined indicator of MetaTrader 5. You can choose to display HA and HAS in the sam
Gecko EA MT5
Profalgo Limited
5 (1)
NEW PROMO: Only a few copies copies available at 349$ Next price: 449$ Make sure to check out our " Ultimate EA combo package " in our   promo blog ! Gecko runs a simple, yet very effective, proven strategy.  It looks for important recent support and resistance levels and will trade the breakouts.  This is a "real" trading system, which means it will use a SL to protect the account.  It also means it will not use any dangerous techniques like martingale, grid or averaging down. The EA shows its
The main application of the Faradenza indicator is to generate buy and sell signals. The indicator tracks the market trend with unrivaled reliability, ignoring sharp market fluctuations and noise around the average price. Determining the market trend is an important task for traders. The Faradenza indicator implements an advanced algorithm for visualizing the market trend. It catches the trend and shows favorable moments of entering the market with arrows. The main purpose of the indicator is to
ATrend
Zaha Feiz
4.82 (17)
ATrend: その仕組みと使い方 仕組み MT5プラットフォーム向けの「ATREND」インジケーターは、テクニカル分析手法の組み合わせを利用して、トレーダーに堅牢な買いと売りのシグナルを提供するように設計されています。このインジケーターは主に、ボラティリティ測定のために平均真の範囲(ATR)を活用し、潜在的な市場動向を特定するためのトレンド検出アルゴリズムを併用しています。 購入後にメッセージを残すと、特別なボーナスギフトが贈呈されます。 主な特徴: - ダイナミックなトレンド検出: インジケーターは市場トレンドを評価し、シグナルを適宜調整することで、トレーダーが優位な市場環境に合わせて戦略を立てるのを支援します。     - ボラティリティ測定: ATRを使用することで、インジケーターは最適なストップロス(SL)とテイクプロフィット(TP)レベルを決定するために不可欠な市場ボラティリティを測定します。 - シグナルの視覚化: インジケーターは、チャート上に買いと売りのシグナルを視覚的に表示することで、トレーダーの意思決定を強化します。 操作手順 入力とセッティング - TimeF
"GoldenSwing" is a comprehensive MetaTrader 5 indicator meticulously crafted by Southern Star Trading, designed to enhance your trading strategies with precision swing high and swing low identification. Harnessing the power of swing analysis, this indicator provides traders with invaluable insights into market reversals and trend continuations, enabling them to make informed trading decisions. With its advanced algorithm, GoldenSwing detects significant swing highs and swing lows in real-time,
Trend Ai indicatorは、トレンドの識別と実用的なエントリポイントと反転アラートを組み合わせることで、トレーダーの市場分析を強化する優れたツールです。 この指標は、ユーザーが自信と正確さで外国為替市場の複雑さをナビゲートすることを可能にします トレンドAiインジケーターは、主要なシグナル以外にも、プルバックやリトレースメント中に発生するセカンダリエントリポイントを識別し、トレーダーが確立されたトレンド内の価格修正を活用できるようにします。 重要な利点: *MT4およびMT5の仕事 *明確な買いまたは売りシグナル *再描画しません ·すべての資産で動作します 私はeaやセットをtelegram it詐欺で販売しないように注意してください。 すべての設定はここでブログで無料です。  重要! 指示とボーナスを得るために購入後すぐに私に連絡してください! 私の他のプロダクトと同様、実質操作の監視はここに見つけることができます: https://www.mql5.com/en/users/mechanic/seller&nbsp ; 設定および入力: すべての
このプロダクトを購入した人は以下も購入しています
SuperScalp Pro — 高度なマルチフィルター対応スキャルピングインジケーターシステム SuperScalp Pro は、クラシックな Supertrend と複数のインテリジェントな確認フィルターを組み合わせた高度なスキャルピング用インジケーターシステムです。M1〜H4 のすべての時間足で効率的に機能し、特に XAUUSD、BTCUSD、および主要なFX通貨ペアに適しています。単体のシステムとして、また既存の取引戦略へ柔軟に統合して使用できます。 本インジケーターは 11 以上のフィルターを統合しており、短期・長期の EMA、トレンド判定に用いる 3 本の EMA、EMA スロープ(EMA slope)、RSI、ADX、出来高、VWAP、ボリンジャーバンドのブレイクアウト、MACD ダイバージェンスフィルターなどを含みます。スマートキャンドルフィルターはローソク足の終値を確認して弱いシグナルを排除し、3 本の EMA と MACD ダイバージェンスを組み合わせたトレンド認識メカニズムにより勝率の高いシグナルの選別を支援します。 SuperScalp Pro は ATR に基
このインジケーターを購入すると、プロ仕様のトレードマネージャーを無料で差し上げます。 まず第一に、このトレーディングシステムがノンリペイント、ノンリドロー、ノンラグのインジケーターであることを強調する価値がある。これにより、手動取引とロボット取引の両方に理想的なものになっています。 オンラインコース、マニュアル、プリセットのダウンロード。 「スマートトレンドトレーディングシステム MT5」は、新規および経験豊富なトレーダー向けにカスタマイズされた包括的なトレーディングソリューションです。10以上のプレミアムインジケーターを組み合わせ、7つ以上の堅実なトレーディング戦略を備えており、多様な市場状況に対応する多目的な選択肢となっています。 トレンドフォロー戦略:トレンドを効果的に乗り越えるための正確なエントリーとストップロス管理を提供します。 リバーサル戦略:潜在的なトレンドの反転を特定し、トレーダーがレンジ相場を活用できるようにします。 スキャルピング戦略:高速で正確なデイトレードおよび短期取引のために設計されています。 安定性:すべてのインジケーターはノンリペイント、ノンリドロー、ノ
FX Trend NG:次世代マルチマーケット・トレンドインテリジェンス 概要 FX Trend NG は、複数の時間足に対応したプロフェッショナル向けトレンド分析およびマーケット監視ツールです。 市場全体の構造を数秒で把握することができます。 複数のチャートを切り替える必要はありません。どの銘柄がトレンド中なのか、どこでモメンタムが弱まっているのか、そしてどの時間足で強い整合性があるのかを瞬時に確認できます。 ローンチ特別オファー – FX Trend NG を $30(6ヶ月) または $80 永久ライセンス でご利用いただけます。 すでに Stein Investments のユーザーですか? -> メッセージを送信 して、プライベートグループへアクセスしてください。 セットアップや詳細情報が必要ですか? -> Stein Investments 公式ページ をご覧ください。 1. FX Trend NG が他と異なる理由 3ステート・トレンドロジック ― Buy と Sell だけではない • 多くのインジケーターは Buy または Sell の2状態のみを表示します。
このインジケーターを購入された方には、以下の特典を 無料 で提供しています: 各トレードを自動で管理し、ストップロスとテイクプロフィットを設定し、戦略ルールに基づいてポジションを決済する補助ツール 「Bomber Utility」 様々な銘柄に合わせたインジケーターの設定ファイル(セットファイル) 「最小リスク」、「バランスリスク」、「待機戦略」 の3つのモードで使用できる Bomber Utility 用の設定ファイル このトレーディング戦略をすぐに導入・設定・開始できる ステップバイステップのビデオマニュアル ご注意: 上記の特典を受け取るには、MQL5のプライベートメッセージシステムを通じて販売者にご連絡ください。 オリジナルのカスタムインジケーター 「Divergence Bomber(ダイバージェンス・ボンバー)」 をご紹介します。これは、MACDのダイバージェンス(乖離)戦略に基づいた 「オールインワン」型のトレーディングシステム です。 このテクニカルインジケーターの主な目的は、価格とMACDインジケーターの間に発生するダイバージェンスを検出 し、将来の価格の動きを示す
Market Flow Pro Market Flow Pro is an intelligent trading advisor for the MetaTrader 5 platform, designed for automatic trading on financial markets using algorithmic analysis and strict risk management. -Key features: - Fully automatic trading 24/5 - Adaptive trend and momentum entry algorithm -  Built-in risk management - Flexible lot settings (fixed/auto-calculation) - Support for major currency pairs and indices - Optimised for operation on various timeframes  How it works Market
Entry In The Zone and SMC Multi Timeframe is a real-time market analysis tool developed based on Smart Money Concepts (SMC). It is designed to analyze market structure, price direction, reversal points, and key zones across multiple timeframes in a systematic way. The system displays Points of Interest (POI) and real-time No Repaint signals, with instant alerts when price reaches key zones or when signals occur within those zones. It functions as both an Indicator and a Signal System (2-in-1), c
ARICoin is a powerful trading companion designed to generate high-probability entry signals with dynamic TP/SL/DP levels based on volatility. Built-in performance tracking shows win/loss stats, PP1/PP2 hits, and success rates all updated live. Key Features: Buy/Sell signals with adaptive volatility bands Real-time TP/SL/DP levels based on ATR Built-in MA Filter with optional ATR/StdDev volatility Performance stats panel (Success, Profit/Loss, PP1/PP2) Alerts via popup, sound, push, or email Cust
優れたテクニカルインジケーター「Grabber」をご紹介します。これは、すぐに使える「オールインワン」トレーディング戦略として機能します。 ひとつのコードに、市場のテクニカル分析ツール、取引シグナル(矢印)、アラート機能、プッシュ通知が強力に統合されています。 このインジケーターを購入された方には、以下の特典を無料で提供します: Grabberユーティリティ:オープンポジションを自動で管理するツール ステップバイステップのビデオマニュアル:インジケーターのインストール、設定、取引方法を解説 カスタムセットファイル:インジケーターをすばやく自動設定し、最大限の成果を出すための設定ファイル 他の戦略はもう忘れてください!Grabberだけが、あなたを新たなトレードの高みへと導いてくれるのです。 Grabber戦略の主な特徴: 推奨タイムフレーム:M5〜H4 対応通貨ペア・資産:どれでも使用可能ですが、私が実際に検証した以下を推奨します(GBPUSD、GBPCAD、GBPCHF、AUDCAD、AUDUSD、AUDSGD、AUDCHF、NZDUSD、NZDCAD、EURCAD、EURUSD、E
AriX
Temirlan Kdyrkhan
1 (4)
AriX Indicator for MT5 A powerful trend-following and signal-evaluation tool AriX is a custom MT5 indicator that combines Moving Averages and ATR-based risk/reward logic to generate clear buy/sell signals. It visualizes dynamic SL/TP levels, evaluates past trade outcomes, and displays win/loss statistics in a clean on-chart panel. Key features include: Buy/Sell signals based on MA crossovers ATR-based SL/TP1/TP2/TP3 levels with visual lines and labels Signal outcome tracking with real-time stat
Game Changerは、あらゆる金融商品で使用できる革新的なトレンドインジケーターです。MetaTraderを強力なトレンドアナライザーへと変貌させます。あらゆる時間枠で動作し、トレンドの特定、反転の可能性のシグナル、トレーリングストップ機能、そして迅速な市場反応のためのリアルタイムアラートを提供します。経験豊富なプロでも、優位性を求める初心者でも、このツールは自信と規律、そして根本的なトレンドダイナミクスを明確に理解した上で取引を行うための力となります。このインジケーターはリドロー機能も備えています。 購入後すぐにご連絡いただければ、個人ボーナスを進呈いたします。Strong SupportとTrend Scannerインジケーターの無料コピーを入手できます。[email protected]までプライベートメッセージを送ってください。 私のEAや特別なセットはTelegramでは販売しておりません。MQL5でのみ販売しており、セットファイルは私のブログでのみ公開しています。詐欺師にはご注意ください。他の方からセットを購入しないでください。 設定 トレンド変化時のアラート
Power Candles – あらゆる市場に対応した強度ベースのエントリーシグナル Power Candles は、Stein Investments が長年培ってきた強度分析を価格チャート上に直接反映します。価格だけに反応するのではなく、各ローソク足は実際の市場の強さに基づいて色分けされ、モメンタムの蓄積、強度の加速、明確なトレンド転換を瞬時に把握できます。 すべての市場に共通する単一ロジック Power Candles は すべての取引シンボル で自動的に動作します。現在のシンボルが Forex か非 Forex 市場かを自動判別し、内部で適切な強度モデルを適用します。 Forex および Gold :FX Power のデルタ値を使用(絶対値レンジ最大 100) 指数、暗号資産、CFD :IX Power の強度値を使用(絶対値レンジ最大 50) 必要な強度計算は Power Candles に直接組み込まれています。ローソク足のカラーリングやシグナルロジックに、追加のインジケーターは不要です。 価格ノイズではなく「強度状態」 各ローソク足は、以下の 9 つの明確に定義された強
まず第一に、この取引インジケーターは再描画されず、再描画されず、遅延しないことを強調する価値があります。これにより、手動取引とロボット取引の両方に理想的なものになります。 ユーザーマニュアル:設定、入力、戦略。 アトミックアナリストは、価格の強さとモメンタムを利用して市場でより良いエッジを見つけるためのPA価格アクションインジケーターです。ノイズや誤ったシグナルを除去し、取引ポテンシャルを高めるための高度なフィルターを備えています。複雑なインジケーターの複数のレイヤーを使用して、アトミックアナリストはチャートをスキャンし、複雑な数学的計算をシンプルなシグナルと色に変換します。これにより、どのような初心者トレーダーでも理解して使用し、一貫した取引の決定を行うことができます。 「アトミックアナリスト」は、新規および経験豊富なトレーダー向けにカスタマイズされた包括的な取引ソリューションです。プレミアムインジケーターとトップノッチの機能を1つの取引戦略に組み合わせ、すべてのタイプのトレーダーにとって汎用性のある選択肢にします。 デイリートレーディングとスキャルピング戦略:高速で正確なデイ
このインジケーターは、反転ポイントと価格戻りゾーンを正確に表示します。     主要プレーヤー 。新たなトレンドが形成される場所を把握し、最大限の精度で意思決定を行い、すべての取引をコントロールします。 TREND LINES PRO インジケーターと組み合わせることで、その潜在能力を最大限に発揮します。 VERSION MT4 インジケーターが示す内容: 新しいトレンドの始まりに活性化する反転構造と反転レベル。 リスクと報酬の比率を最小限に抑えた利益 確定 と 損失停止の レベルの表示     RR 1:2   。 インテリジェントな削減ロジックによるストップロス。 指定されたインジケーターから 2 つのトレンド タイプの反転パターンを表示します。 指標: トレンドを追う   TREND LINES PRO   (世界的なトレンドの変化) TREND PRO   (クイックトレンド変更) シンプルで効果的   スキャナー   リアルタイムトレンド(新機能)。 マルチタイムフレームのインストゥルメント フィルタリング。 画面   利益     LOGIC AI信号の後。 当日プラス方
Smart Stop Indicator – チャート上で実現するインテリジェントなストップロス精度 概要 Smart Stop Indicator は、ストップロスを勘や感情ではなく、明確で体系的に設定したいトレーダーのために設計されています。本ツールは、クラシックなプライスアクション(高値更新・安値切り下げ)と最新のブレイクアウト認識ロジックを組み合わせ、次に来るべき論理的なストップレベルを正確に特定します。トレンド相場、レンジ、急速なブレイクアウト局面のいずれであっても、最適な SL ゾーンとその状態(“new”、“broken”、“valid”)をチャート上に直接表示します。さらに今回、SL 距離の %ADR 表示も新たに追加されています。 主な特徴 マーケット構造に基づく自動ストップ配置 • 市場構造とリアルタイムの値動きに基づき、意味のあるストップロスレベルを自動検出します。 スマートなブレイクアウト感知 • 急激な方向転換やブレイクアウトにも柔軟に対応し、早すぎるストップ調整を避けます。 SL %ADR の表示 • ストップロスまでの距離を ADR(Averag
トレンド スクリーナー インジケーターでトレンド取引の力を解き放ちます。ファジー ロジックと複数通貨システムを活用した究極のトレンド取引ソリューションです。 ファジー ロジックを活用した革新的なトレンド インジケーターである Trend Screener を使用して、トレンド取引を向上させます。 これは、13 を超えるプレミアム ツールと機能、および 3 つの取引戦略を組み合わせた強力なトレンド追跡インジケーターであり、Metatrader をトレンド アナライザーにする多用途の選択肢となります。 期間限定オファー : トレンド スクリーナー インジケーターは、わずか 100 ドルで生涯ご利用いただけます。 (元の価格 50$ ) (オファー延長) Trend Screener の 100% 非再描画精度の揺るぎない精度を体験して、取引の決定が過去の価格変動の影響を受けないようにしてください。 マルチタイムフレームおよびマルチ通貨機能の多用途性を解放し、比類のない自信を持って外国為替、商品、暗号通貨、インデックスの世界を取引できるようにします。 Trend Screener の包括的な
トレンドラインプロ   市場の真の方向転換点を理解するのに役立ちます。この指標は、真のトレンド反転と主要プレーヤーが再び参入するポイントを示します。 分かりますか     BOSライン   複雑な設定や不要なノイズなしに、より長い時間足でのトレンドの変化と重要なレベルを把握できます。シグナルは再描画されず、バーが閉じた後もチャート上に残ります。 MT4バージョン   -   RFI LEVELS PRO インジケーター と組み合わせることで、その最大限の能力を発揮します インジケーターが示す内容: 本当の変化   トレンド(BOSライン) 一度シグナルが現れたら、それは有効です!これは、リペイント機能を持つインジケーターとの重要な違いです。リペイント機能を持つインジケーターは、シグナルを発した後、それを変更し、資金の損失につながる可能性があります。これにより、より高い確率と精度で市場に参入できます。また、矢印が現れた後、目標値(利益確定)に達するか、反転シグナルが現れるまで、ローソク足の色を変更する機能もあります。 繰り返しエントリ   主要プレーヤーの補充 エントリーポイントを探す
これはMT5のインジケーターで、再描画なしで取引に参入するための正確なシグナルを提供します。 外国為替、暗号通貨、金属、株式、インデックスなど、あらゆる金融資産に適用できます。かなり正確な見積もりを提供し、取引を開始して終了するのに最適な時期を教えてくれます。1つのシグナルを処理しただけでインジケーターの元が取れた例の 動画 (6:22)をご覧ください。Entry PointsPro インジケーターの助けを借りたほとんどのトレーダーの最初の1週間の結果が改善しています。 Telegramグループ に登録してください。Entry Points Proインジケーターのメリットは次の通りです。 再描画のないエントリーシグナル 再描画されるインジケーターでは一度表示されたシグナルが削除されて大きな金銭的損失につながることがありますが、これと異なり、表示されて確認されたシグナルは消えることがありません。 エラーなしの取引開始 インジケーターアルゴリズムによって取引を開始する(資産を売買する)理想的な瞬間を見つけることができます。それを使用するすべてのトレーダーの成功率が向上します。 あら
Quantum TrendPulse を ご紹介します。これは、   SuperTrend   、   RSI   、および Stochastic のパワーを 1 つの包括的なインジケーターに組み合わせて、取引の可能性を最大限に引き出す究極の取引ツールです。精度と効率を求めるトレーダー向けに設計されたこのインジケーターは、市場のトレンド、勢いの変化、最適なエントリー ポイントとエグジット ポイントを自信を持って特定するのに役立ちます。 主な特徴: SuperTrend 統合: 現在の市場動向に簡単に追従し、収益性の波に乗ることができます。 RSI精度: 買われすぎと売られすぎのレベルを検出し、市場の反転のタイミングに最適で、SuperTrendのフィルターとして使用されます。 確率的精度: 確率的振動を活用して、変動の激しい市場で隠れたチャンスを見つけます。SuperTrend のフィルターとして使用されます。 マルチタイムフレーム分析:   M5 から H1 または H4 まで、さまざまなタイムフレームで市場を常に把握します。 カスタマイズ可能なアラート: カスタム取引条件が満たされ
Order Block Pro (MQL5) – バージョン 1.0 作成者: KOUAME N'DA LEMISSA プラットフォーム: MetaTrader 5 説明: Order Block Pro は、チャート上の**強気および弱気のオーダーブロック(Order Blocks)**を自動で検出する高度なインジケーターです。小さな保ち合いローソク足と、その後の強いインパルスローソク足を分析することで、価格が加速する可能性のある重要なゾーンを特定します。 トレーダーに最適: 正確なエントリーとエグジットポイントを特定したい方。 動的なサポートおよびレジスタンスゾーンを把握したい方。 リスク管理と取引戦略を向上させたい方。 主な機能: 強気OB検出: 保ち合いローソク足の後、強い上昇が発生した場合、緑色の矢印で表示。 弱気OB検出: 保ち合いローソク足の後、強い下落が発生した場合、赤色の矢印で表示。 完全にカスタマイズ可能: 保ち合いローソク足の最大実体比率 ( BodyMaxRatio ) 次のローソク足の最小比率で動きを確認 ( NextCandleMinPct ) チャー
FX Power: 通貨の強弱を分析して、より賢い取引を実現 概要 FX Power は主要通貨と金の実際の強弱をあらゆる市場状況で理解するための必須ツールです。強い通貨を買い、弱い通貨を売ることで、 FX Power は取引の意思決定を簡素化し、高い確率の取引機会を見出します。トレンドを追従する場合でも、極端なデルタ値を使用して反転を予測する場合でも、このツールはあなたの取引スタイルに完全に適応します。ただ取引するだけではなく、 FX Power で賢く取引をしましょう。 1. なぜ FX Power がトレーダーにとって非常に有益なのか 通貨と金のリアルタイム強弱分析 • FX Power は主要通貨と金の相対的な強弱を計算し、マーケットダイナミクスに関する明確な洞察を提供します。 • どの資産がリードしているか、または後れを取っているかを監視して、取引するペアを賢く選びましょう。 マルチタイムフレームの包括的なビュー • 短期、中期、長期のタイムフレームで通貨と金の強弱を追跡し、マーケットトレンドに基づいて取引戦略を調整できます。 • スキャルピングからスイングトレード
ARIPoint is a powerful trading companion designed to generate high-probability entry signals with dynamic TP/SL/DP levels based on volatility. Built-in performance tracking shows win/loss stats, PP1/PP2 hits, and success rates all updated live. Key Features: Buy/Sell signals with adaptive volatility bands Real-time TP/SL/DP levels based on ATR Built-in MA Filter with optional ATR/StdDev volatility Performance stats panel (Success, Profit/Loss, PP1/PP2) Alerts via popup, sound, push, or email Cu
Azimuth Pro
Ottaviano De Cicco
5 (4)
発売プロモーション Azimuth Proは先着100名様限定で 299ドル でご提供します。最終価格は 499ドル となります。 リテールとインスティテューショナルのエントリーの違いはインジケーターではなく、ロケーションにあります。 多くのトレーダーは、モメンタムを追いかけたり、遅行シグナルに反応して、任意の価格レベルでエントリーします。機関投資家は、需給が実際にシフトする構造的なレベルに価格が到達するのを待ちます。 Azimuth Proはこれらのレベルを自動的にマッピングします:スイングアンカーVWAP、マルチタイムフレーム構造ライン、高確率ロケーションにのみ出現するABCパターン。 Azimuth Proは、構造分析とインテリジェントな自動化の両方を求めるプロフェッショナルトレーダー向けに構築されています。 Azimuthが外科的精度で市場構造をマッピングする一方、Azimuth Proはインテリジェンスレイヤーを追加します:トレーディングスタイルの自動検出、スマート設定された移動平均線、20年のデータでバックテストされた最適化パラメータ。その結果、お使いの銘柄と
ご紹介     Quantum Breakout PRO は 、ブレイクアウト ゾーンの取引方法を変革する画期的な MQL5 インジケーターです。 13年以上の取引経験を持つ経験豊富なトレーダーのチームによって開発されました。     クォンタム ブレイクアウト プロ   は、革新的でダイナミックなブレイクアウト ゾーン戦略により、あなたのトレーディングの旅を新たな高みに押し上げるように設計されています。 クォンタム ブレイクアウト インジケーターは、5 つの利益ターゲット ゾーンを備えたブレイクアウト ゾーン上のシグナル矢印と、ブレイクアウト ボックスに基づいたストップロスの提案を提供します。 初心者トレーダーにもプロのトレーダーにも適しています。 量子EAチャネル:       ここをクリック 重要!購入後、インストールマニュアルを受け取るためにプライベートメッセージを送ってください。 推奨事項: 時間枠: M15 通貨ペア: GBPJPY、EURJPY、USDJPY、NZDUSD、XAUUSD アカウントの種類: ECN、Raw、またはスプレッドが非常に低い R
RelicusRoad Pro: 定量的市場オペレーティングシステム 【期間限定】無制限アクセス 70% OFF - 2,000人超のトレーダーと共に なぜ多くのトレーダーは「完璧な」インジケーターを使っても失敗するのでしょうか? それは、文脈を無視して 単一の概念 だけでトレードしているからです。文脈のないシグナルは単なるギャンブルです。勝ち続けるには、 根拠の重なり(コンフルエンス) が必要です。 RelicusRoad Proは単なる矢印インジケーターではありません。完全な 定量的市場エコシステム です。独自のボラティリティモデリングを用いて、価格が推移する「適正価値の道(Fair Value Road)」をマッピングし、ノイズと真の構造的ブレイクを判別します。 推測はやめましょう。機関投資家レベルの「ロード・ロジック」でトレードを。 コアエンジン:「Road」アルゴリズム システムの中心となる Road Algo は、市場環境にリアルタイムで適応するダイナミックなボラティリティチャネルです。 安全ライン(平衡点) と、価格が数学的に反転しやすい 拡張レベル を投影します。 Si
FX Levels: あらゆる市場における非常に高精度なサポート&レジスタンス 概要 通貨ペア、株式指数、個別銘柄やコモディティなど、どのような市場でも信頼できるサポートとレジスタンスを特定したいですか? FX Levels は伝統的な “Lighthouse” メソッドと先進的な動的アプローチを融合し、ほぼ汎用的な精度を実現します。ブローカーの実務経験を活かし、自動化されたデイリー更新とリアルタイム更新を組み合わせることで、 FX Levels は反転ポイントを見つけ、利益目標を設定し、自信をもってトレードを管理するための手助けをします。今すぐ試してみて、サポート/レジスタンス分析の正確性がどれほどトレードを向上させるかを実感してください! 1. FX Levels がトレーダーにとって非常に有用な理由 非常に正確なサポート&レジスタンスゾーン • FX Levels は異なるブローカー環境でもほぼ同一のゾーンを生成するよう設計されており、データフィードの差異や時刻設定のずれによる不一致を解消します。 • つまり、どのブローカーを利用していても一貫したレベルが得られるため、戦
FX Dynamic: カスタマイズ可能なATR分析でボラティリティとトレンドを把握 概要 FX Dynamic は平均的な真のレンジ(ATR)の計算を活用して、日次および日中ボラティリティに関する卓越した情報をトレーダーに提供する強力なツールです。80%、100%、130%などのボラティリティ閾値を設定することで、通常の範囲を超えた際にすぐに警告を受け取ったり、有望な利益機会を素早く捉えられます。 FX Dynamic はブローカーのタイムゾーンに合わせて調整でき、安定したボラティリティ測定を維持しながら、リアルタイム分析のためにMetaTraderとシームレスに連携します。 1. なぜFX Dynamicがトレーダーにとって非常に有益か リアルタイムのATRインサイト • 日次・日中のボラティリティをひと目で把握。価格がATRの80%、100%、130%などに達したときに警告を受け取り、重要な水準にあるかどうかを確認できます。 • ボラティリティが完全に爆発する前に潜在的な反転やブレイクアウトを先取り可能。 幅広いマーケットへの適用 • 外国為替、コモディティ、株価指数な
Trend Hunter は、外国為替、仮想通貨、CFD 市場におけるトレンド指標です。 このインジケーターの特別な特徴は、価格がトレンドラインをわずかに突き抜けたときにシグナルを変更することなく、自信を持ってトレンドに従うことです。 インジケーターは再描画されず、バーが閉じた後に市場に参入するシグナルが表示されます。 トレンドに沿って移動すると、インジケーターにはトレンドの方向に追加のエントリーポイントが表示されます。 これらのシグナルに基づいて、小さなストップロスで取引できます。 トレンドハンターは正直な指標です。 インジケーター信号の上にマウスを置くと、信号の潜在的な利益と可能なストップが表示されます。 新しい信号が表示されると、次の通知を受け取ることができます。 アラート プッシュ通知 メールによる通知 電報での通知 チャートのスクリーンショットも Telegram に送信されるため、取引を決定するために端末を開く必要はありません。 インジケーターシグナルは、電報チャネル https://www.mql5.com/ja/market/product/11085#!ta
Ultimate SMC Indicator
Hicham Mahmoud Almoustafa
1 (1)
Ultimate SMC PRO – Smart Money Concepts Indicator (Order Blocks, FVG, Liquidity, BOS) for MetaTrader 5 Ultimate SMC PRO is a professional trading indicator designed to visualize Smart Money Concepts directly on the chart. The indicator combines several institutional trading tools in one system to help traders identify potential high-probability trading zones. The indicator analyzes market structure, liquidity behavior and price imbalance to highlight areas where institutional activity may occu
Bill Williams Advanced is designed for automatic chart analysis using Bill Williams' "Profitunity" system. The indicator analyzes four timeframes at once. Manual (Be sure to read before purchasing) Advantages 1. Analyzes the chart using Bill Williams' "Profitunity" system. Signals are displayed in a table in the corner of the screen and on the price chart. 2. Finds all known AO and AC signals, as well as zone signals. Equipped with a trend filter based on the Alligator. 3. Finds "Divergence Bar
Dark Absolute Trend   is an Indicator for intraday trading. This Indicator is based on   Trend Following  strategy but use also candlestick patterns and Volatility. We can enter in good price with this Indicator, in order to follow the main trend on the current instrument. It is advised to use low spread ECN brokers. This Indicator does   Not repaint   and   N ot lag . Recommended timeframes are M5, M15 and H1. Recommended working pairs: All. I nstallation and  Update Guide   -  Troubleshooting
作者のその他のプロダクト
Time Scale for MT5
Taras Slobodyanik
4.76 (29)
The indicator draws the time scale on the chart. You can specify the time offset, adjust the size and font to display on the chart ( it is displaying your local time on your chart instead of MT time ). You can also select the desired format for displaying the date and time. You may be interested in my other product , which contains a more advanced version of the Time Scale . You can also find my other products here . Parameters Hours (time shift) — time shift (hours); Minutes (time shift) — tim
FREE
このインジケーターは、他の(および非標準)時間枠の高値/安値/始値/終値レベルを示します - 年、6 か月、4 か月、3 か月、2 か月、月、週、日、H3-H6-H8-H12 時間 M45 M90。 キャンドルを開くシフトを設定し、仮想キャンドルを構築することもできます。 これらの時間枠のいずれかの「期間区切り記号」は、垂直線の形式で使用できます。 現在または以前のレベルのブレイクアウト (昨日/先週の高値/安値ラインのブレイクアウトなど) に対してアラートを設定できます。 すべてのレベルを 1 ピリオド右にシフトすることもできます。 つまり、前の期間の高値/安値が現在の期間に表示されます. パラメーター Number of levels to calculate (0-all) — 画面に表示されるバーの数。 Change the opening of bars (hours) — ローソク足の始点を n 時間ずつシフトします。 インジケーターは、新しい開始時間を考慮して仮想バーを描画します。 MN1 より上の期間は変更されません。 Move the levels to th
Pro Sessions MT4
Taras Slobodyanik
4.75 (4)
This is an indicator of trading sessions  that can display all levels (Open-High-Low-Close) for four sessions. The indicator can also predict session levels. Sessions can be drawn with lines or rectangles (empty or filled), lines can be extended to the next session. You can easily hide/show each session by pressing hotkeys (by default '1', '2', '3', '4') You can see ASR (Average Session Range) lines  (default hotkey 'A'). This is similar to the ADR calculation, only it is calculated based on th
This is an indicator of trading sessions  that can display all levels (Open-High-Low-Close) for four sessions . The indicator can also predict session levels. Sessions can be drawn with lines or rectangles (empty or filled), lines can be extended to the next session. You can easily hide/show each session by pressing hotkeys (by default '1', '2', '3', '4') You can see ASR (Average Session Range) lines  (default hotkey 'A'). This is similar to the ADR calculation, only it is calculated based on t
Multi-currency and multitimeframe Heikin Ashi indicator. Shows the current state of the market. On the scanner panel you can see the direction, strength and number of bars of the current trend. The Consolidation/Reversal candles are also shown using color. You can specify any desired currencies and periods in the parameters. Also, the indicator can send notifications when the trend changes or when reversal and consolidation candles (dojis) appear. By clicking on a cell, this symbol and period wi
Multi timeframe ZigZag indicator. It displays the support/resistance horizontal lines and their breakouts, as well as draws the current targets of the market. It can also display lines of the Fractals indicator and candles from other periods (up to Quarterly). So, you can actually see the supply and demand levels. Indicator – connects key lows and highs to show trend lines. You can also use it as indicator for the Break of Structure(BOS) & Market Structure Shift(MSS). The indicator redraws the
ADX インジケーターは、トレンドとその強さを判断するために使用されます。価格の方向は +DI と -DI の値で示され、ADX 値はトレンドの強さを示します。+DI が -DI より上であれば、市場は上昇傾向にあり、反対であれば下降傾向にあります。ADX が 20 より下であれば、明確な方向性はありません。インジケーターがこのレベルを突破するとすぐに、中程度の強さのトレンドが始まります。40 を超える値は、強いトレンド (下降トレンドまたは上昇トレンド) を示します。 平均方向性指数 (ADX) インジケーターの複数通貨および複数時間枠の変更。パラメータで任意の通貨と時間枠を指定できます。また、インジケーターは、トレンドの強さのレベルが交差したとき、および +DI と -DI のラインが交差したときに通知を送信できます。ピリオドの付いたセルをクリックすると、このシンボルと期間が開きます。これが MTF スキャナーです。 通貨強度メーター (CSM) と同様に、ダッシュボードは、指定された通貨を含むペア、またはその通貨を基本通貨とするペアを自動的に選択できます。インジケーターは、
Multi-currency and multi-timeframe indicator MACD. The dashboard can display both the Traditional (true) MACD and the MACD which is built into MetaTrader. On the panel you can see the current state of the indicator — the direction of movement of the MACD lines, their intersection and a pop-up window with the indicator chart. In the parameters you can specify any desired pairs-symbols and timeframes. The scanner can also send notifications about lines crossing each other and about lines crossing
インジケーターは現在のシンボルの利益(損失)を表示します。 線を自由にドラッグ&ドロップして現在の損益を表示できます。 You can find my products   here . パラメーター Calculation in money or in points — 損益をポイントまたは金額で計算します。 Add pending orders to calculate — 計算では未決注文を考慮します。 Magic Number (0 - all orders on symbol) — 特定の注文を評価する必要がある場合のマジック ナンバー。 Offset for first drawing (points from the average price) — 最初の開始時の平均価格からのラインのオフセット。 Decimal places for calculating the Sum — 合計を表示するための小数点以下の桁数。 Decimal places for calculating the Percentage — パーセンテージを表示するための小数点以下の桁数。
FREE
The indicator has three main tools: Magnifier (Zoom chart), Ruler  ( Time and Price scales ),   and Crosshair. You can move it all around with your mouse and customize different formats for  displaying , customize   size and color of each element. The Magnifier (zoom chart) allows you to display candles from any time frame and at different scales. Hotkeys: 'Q' - higher timeframe, 'A' - lower timeframe, 'W' - decrease candle size, 'S' - increase candle size, 'Z' - show/hide zoom chart You can
相対力指数 (RSI) インジケーターのマルチ通貨およびマルチタイムフレームの変更。パラメータで任意の通貨とタイムフレームを指定できます。また、パネルは買われすぎレベルと売られすぎレベルを越えたときに通知を送信できます。ピリオドのあるセルをクリックすると、このシンボルとピリオドが開きます。これが MTF スキャナーです。 ダッシュボードをチャートから非表示にするキーは、デフォルトでは「D」です 通貨強度メーター (CSM) と同様に、ダッシュボードは、指定された通貨を含むペア、またはその通貨を基本通貨とするペアを自動的に選択できます。インジケーターは、「ペアのセット」で指定されたすべてのペアで通貨を検索します。他のペアは無視されます。そして、これらのペアに基づいて、この通貨の合計 RSI が計算されます。そして、その通貨がどれだけ強いか弱いかを確認できます. パラメータ RSI Period — 平均期間。 RSI Applied price — 価格タイプ。 Clear the chart at startup — 起動時にチャートをクリアします Set of Pairs
This is the famous FX Sniper's T3 CCI indicator. It is a fixed version additionally containing search for classical and reverse (hidden) divergence. The classical divergence is displayed as a solid line, the reverse divergence is shown as a dotted line. Divergences are drawn in the indicator and on the chart (if you select the appropriate options). Parameters CCI Period — Commodity Channel Index indicator period CCI Type of price — price used for indicator calculation T3 Period — Sniper period
Lines Profit Loss
Taras Slobodyanik
4.65 (17)
インジケーターは現在のシンボルの利益(損失)を表示します。 線を自由にドラッグ&ドロップして現在の損益を表示できます。 You can find my products   here . パラメーター Calculation in money or in points — 損益をポイントまたは金額で計算します。 Add pending orders to calculate — 計算では未決注文を考慮します。 Magic Number (0 - all orders on symbol) — 特定の注文を評価する必要がある場合のマジック ナンバー。 Offset for first drawing (points from the average price) — 最初の開始時の平均価格からのラインのオフセット。 Decimal places for calculating the Sum — 合計を表示するための小数点以下の桁数。 Decimal places for calculating the Percentage — パーセンテージを表示するための小数点以下の桁数。
FREE
Easy Grider
Taras Slobodyanik
4.5 (2)
The EA creates an order grid using labels. Opening and closing of the grid is done either automatically by the system signals or manually. In the same grid can be both Limit and Stop orders. It is possible to reverse the grid on specified condition. You can enter the breakdown/rebound from established levels. All types of Sell limit, Buy limit, Buy stop, Sell stop orders are supported. The grid is rebuilt with a single click. The stop loss and take profit lines can be easily modified You are fre
Time Scale
Taras Slobodyanik
4.87 (15)
The indicator draws the time scale on the chart. You can specify the time offset, adjust the size and font to display on the chart (it is displaying your local time on your chart instead of MT time). You can also select the desired format for displaying the date and time. While holding down the middle mouse button, and moving the cursor, a slider will appear on the scale. You may be interested in my other product , which contains a more advanced version of the Time Scale. You can also find my o
FREE
ADX Dashboard
Taras Slobodyanik
5 (5)
ADX インジケーターは、トレンドとその強さを判断するために使用されます。価格の方向は +DI と -DI の値で示され、ADX 値はトレンドの強さを示します。+DI が -DI より上であれば、市場は上昇傾向にあり、反対であれば下降傾向にあります。ADX が 20 より下であれば、明確な方向性はありません。インジケーターがこのレベルを突破するとすぐに、中程度の強さのトレンドが始まります。40 を超える値は、強いトレンド (下降トレンドまたは上昇トレンド) を示します。 平均方向性指数 (ADX) インジケーターの複数通貨および複数時間枠の変更。パラメータで任意の通貨と時間枠を指定できます。また、インジケーターは、トレンドの強さのレベルが交差したとき、および +DI と -DI のラインが交差したときに通知を送信できます。ピリオドの付いたセルをクリックすると、このシンボルと期間が開きます。これが MTF スキャナーです。 通貨強度メーター (CSM) と同様に、ダッシュボードは、指定された通貨を含むペア、またはその通貨を基本通貨とするペアを自動的に選択できます。インジケーターは、
ストキャスティクス オシレーターのマルチ通貨およびマルチタイムフレームの変更。パラメータで任意の通貨とタイムフレームを指定できます。パネルには、シグナルとメイン (ストキャスティクス クロスオーバー) のラインの現在の値と交差点が表示されます。また、インジケーターは、買われすぎレベルと売られすぎレベルを横切るときに通知を送信できます。ピリオド付きのセルをクリックすると、このシンボルとピリオドが開きます。これが MTF スキャナーです。 通貨強度メーター (CSM) と同様に、ダッシュボードは、指定された通貨を含むペア、またはその通貨を基本通貨とするペアを自動的に選択できます。インジケーターは、「ペアのセット」で指定されたすべてのペアで通貨を検索します。他のペアは無視されます。これらのペアに基づいて、この通貨の合計ストキャスティクスが計算されます。そして、その通貨がどれだけ強いか弱いかを確認できます。 ダッシュボードをチャートから非表示にするキーは、デフォルトでは「D」です パラメータ %K Period — K ラインの期間。 %D Period — D ラインの期間。 Slo
Multicurrency and multitimeframe modification of the indicator Bollinger Bands. On the dashboard you can see breakouts and touches of the Bollinger Bands. In the parameters you can specify any desired currencies and timeframes. The indicator can also send notifications when the price touches the Bollinger Bands, when the current volatility changes (expands or falls), and when the price touches all the bands. By clicking on a cell with a period, this symbol and period will be opened. This is MTF
The indicator has three main tools: Magnifier (Zoom chart), Ruler  ( Time and Price scales ),   and Crosshair. You can move it all around with your mouse and customize different formats for  displaying , customize   size and color of each element. The Magnifier (zoom chart) allows you to display candles from any time frame and at different scales. Hotkeys: 'Q' - higher timeframe, 'A' - lower timeframe, 'W' - decrease candle size, 'S' - increase candle size, 'Z' - show/hide zoom chart. You can
ZigZag Lines MTF
Taras Slobodyanik
4.38 (13)
Multi timeframe ZigZag indicator. It displays the support/resistance horizontal lines and their breakouts, as well as draws the current targets of the market. It can also display lines of the Fractals indicator and candles from other periods (up to Quarterly). So, you can actually see the supply and demand levels. Indicator – connects key lows and highs to show trend lines. You can also use it as indicator for the Break of Structure(BOS) & Market Structure Shift(MSS). The indicator redraws the
This dashboard displaying current news from ForexFactory.com (calendar FFC) and from the Investing.com website . You can sort news by impact and by country, and display them on the chart with one click. By holding down the 'Ctrl' key, you can select several different 'currencies' or 'impacts' to sort. Also, this utility shows not only the forecast, but also the actual values ​​after they appear on the site. You can set a separate notification for each news. You can read the news using your EA
The Gann Box (or Gann Square) is a market analysis method based on the "Mathematical formula for market predictions" article by W.D. Gann. This indicator can plot three models of Squares: 90, 52(104), 144. There are six variants of grids and two variants of arcs. You can plot multiple squares on one chart simultaneously Parameters Square — selection of a Gann square model: 90 — square of 90 (or square of nine); 52 (104) — square of 52 (or 104); 144 — universal square of 144; 144 (full) — "full
ストキャスティクス オシレーターのマルチ通貨およびマルチタイムフレームの変更。パラメータで任意の通貨とタイムフレームを指定できます。パネルには、シグナルとメイン (ストキャスティクス クロスオーバー) のラインの現在の値と交差点が表示されます。また、インジケーターは、買われすぎレベルと売られすぎレベルを横切るときに通知を送信できます。ピリオド付きのセルをクリックすると、このシンボルとピリオドが開きます。これが MTF スキャナーです。 通貨強度メーター (CSM) と同様に、ダッシュボードは、指定された通貨を含むペア、またはその通貨を基本通貨とするペアを自動的に選択できます。インジケーターは、「ペアのセット」で指定されたすべてのペアで通貨を検索します。他のペアは無視されます。これらのペアに基づいて、この通貨の合計ストキャスティクスが計算されます。そして、その通貨がどれだけ強いか弱いかを確認できます。 ダッシュボードをチャートから非表示にするキーは、デフォルトでは「D」です パラメータ %K Period — K ラインの期間。 %D Period — D ラインの期間。 Slo
Multicurrency and multitimeframe modification of the indicator Bollinger Bands. On the dashboard you can see breakouts and touches of the Bollinger Bands. In the parameters you can specify any desired currencies and timeframes. The indicator can also send notifications when the price touches the Bollinger Bands, when the current volatility changes (expands or falls), and when the price touches all the bands. By clicking on a cell with a period, this symbol and period will be opened. This is MTF
このインジケーターは、ジグザグインジケーター、取引セッション、フラクタル、またはローソク足(非標準の時間枠:年、6 か月、4 か月、3 か月、2 か月を含む)に基づいてフィボナッチ レベルを自動的に描画します(自動フィボ リトレースメント)。 フィボナッチ計算には、より高い時間枠を選択できます。 現在のバーが閉じるたびにレベルが再描画されます。 指定したレベルを超えたときにアラートを有効にすることができます。 履歴のレベルを分析することもできます。 これを行うには、「過去の Fibo レベルの数」パラメーターで Fibo レベルの数を指定する必要があります パラメーター Calculate Fibo according to — フィボナッチ計算モード: Candles (High-Low) — 高値-安値に基づいてフィボナッチを構築します。 Candles (Close-Close) — 終値-終値に基づいてフィボナッチを構築します。 ZigZags — ZigZag ポイントによって Fibo を構築します。 Sessions — 取引セッションごとに Fibo を構築し
Multicurrency and multitimeframe modification of the ZigZag indicator. Displays the current direction of the market, the height of the last movement, the number of bars in this movement and the breaking of the previous point of the ZigZag (horizontal line). This is MTF Scanner, you can actually see the supply and demand levels. You can specify any desired currencies and timeframes in the parameters. Also, the panel can send notifications when the ZigZag changes direction or when there was a br
Multicurrency and multi-timeframe indicator Inside Bar (IB). In the parameters, you can specify any desired currencies and timeframes. The panel displays the last found Inside Bar (and Mother Bar) pattern, the current price position and the breakout of the levels of the Mother and Inside Bars. You can set the size and color for bars and text in the cells. The indicator can also send notifications when levels are broken. The dashboard highlights Double Inside Bar in a special color. By clicking
Multi-currency and multitimeframe Heikin Ashi indicator. Shows the current state of the market. On the scanner panel you can see the direction, strength and number of bars of the current trend. The Consolidation/Reversal candles are also shown using color. You can specify any desired currencies and periods in the parameters. Also, the indicator can send notifications when the trend changes or when reversal and consolidation candles (dojis) appear. By clicking on a cell, this symbol and period wi
フィルタ:
thomas
1409
thomas 2023.11.28 19:12 
 

I bought this indicator a few days ago and I can say it is really very use- and helpful !! As A. Forex already told it would be a good idea to integrate the MT5-standard indicators "Double Exponential Moving Average" and "Triple Exponential Moving Average" to this wonderful tool. To me I am using this both indicators constantly.

IK°L
826
IK°L 2023.11.27 20:50 
 

A great tool, an MA Multicurrency dashboard is essential, it has all kinds of alerts for different setups, it is very easy to read the information on the dashboard, it runs very fluid and without problems. It is a damn delight to explore the markets with these dashboards, I love the little popup window and the extraordinary attention that the developer always provides.

A. Forex
300
A. Forex 2023.10.12 14:57 
 

Great dashboard. Please add DEMA (Double EMA) into the range of MA. WOULD be super. Thank you. Спасибо!

Taras Slobodyanik
93248
開発者からの返信 Taras Slobodyanik 2023.10.12 15:17
Hello. It's not clear what you're talking about, what range? What is Double EMA? You can set both MAs to EMA.
nolimitzfx
148
nolimitzfx 2022.05.19 23:47 
 

If you use ma's for your trading/ analysis this is a must have! Works as indicated, clean, great user interface. Makes my charting analysis much faster then scrolling through ea chart individually. Highly recommend. Guys/ gals keep in mind this is not some holy grail. If you don't currently understand how to use ma's correctly then this won't be of much use to you. This will however be a godsend to those who already have a method/ system that utilizes ma's and are just looking for a tool that will aid in the whole process.

レビューに返信