MA Dashboard MT5

5
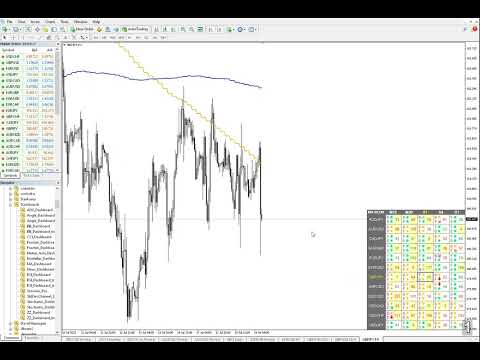
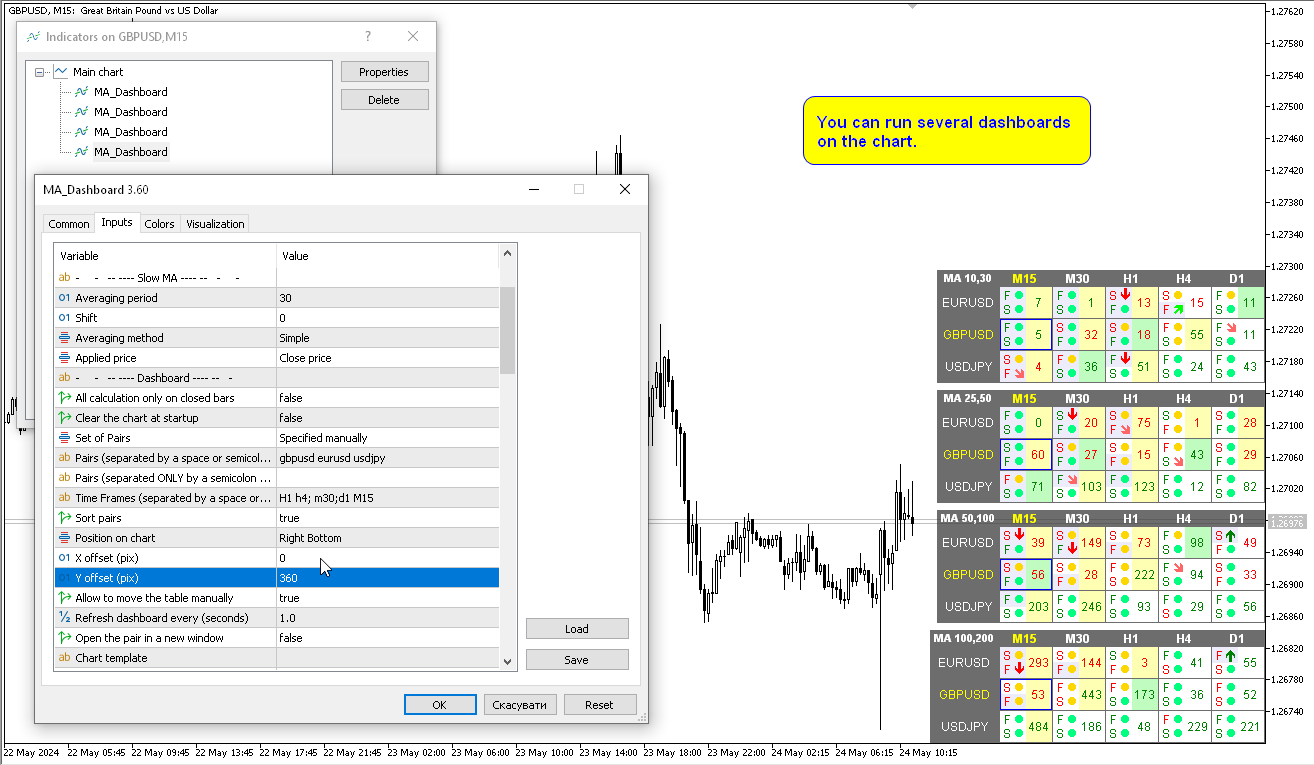
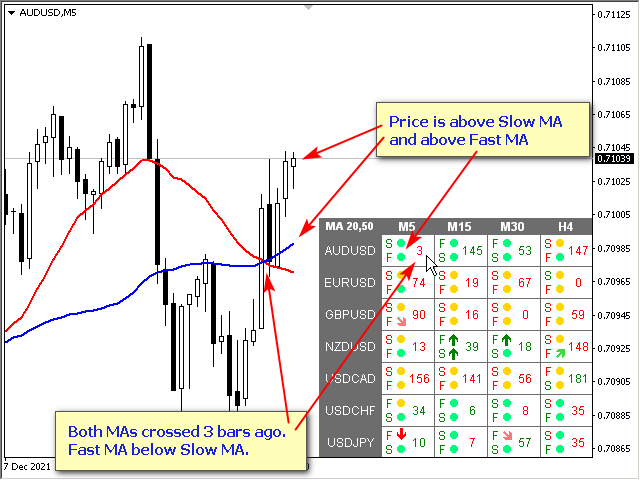
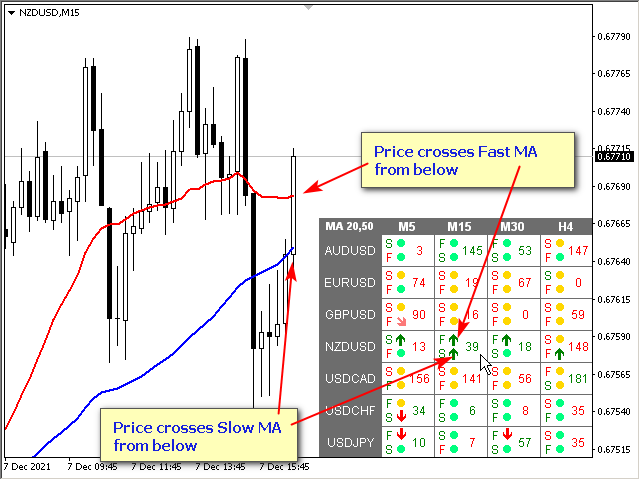
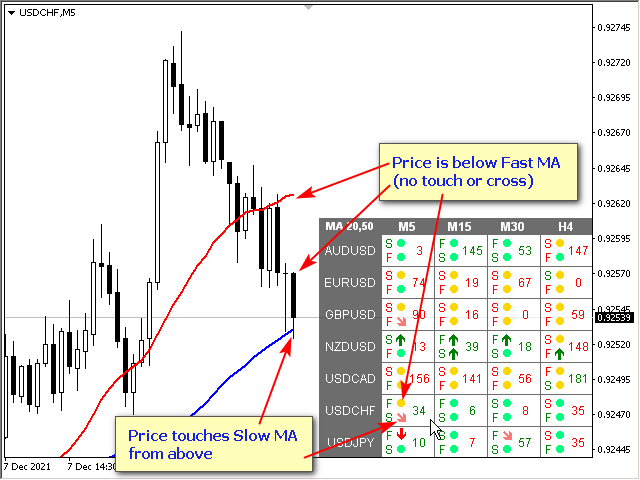
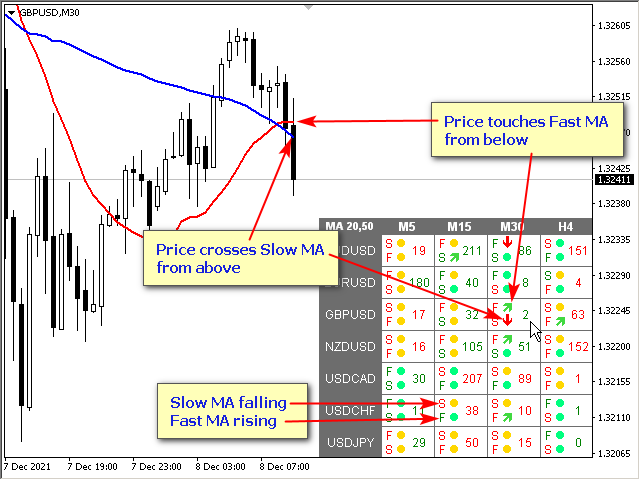
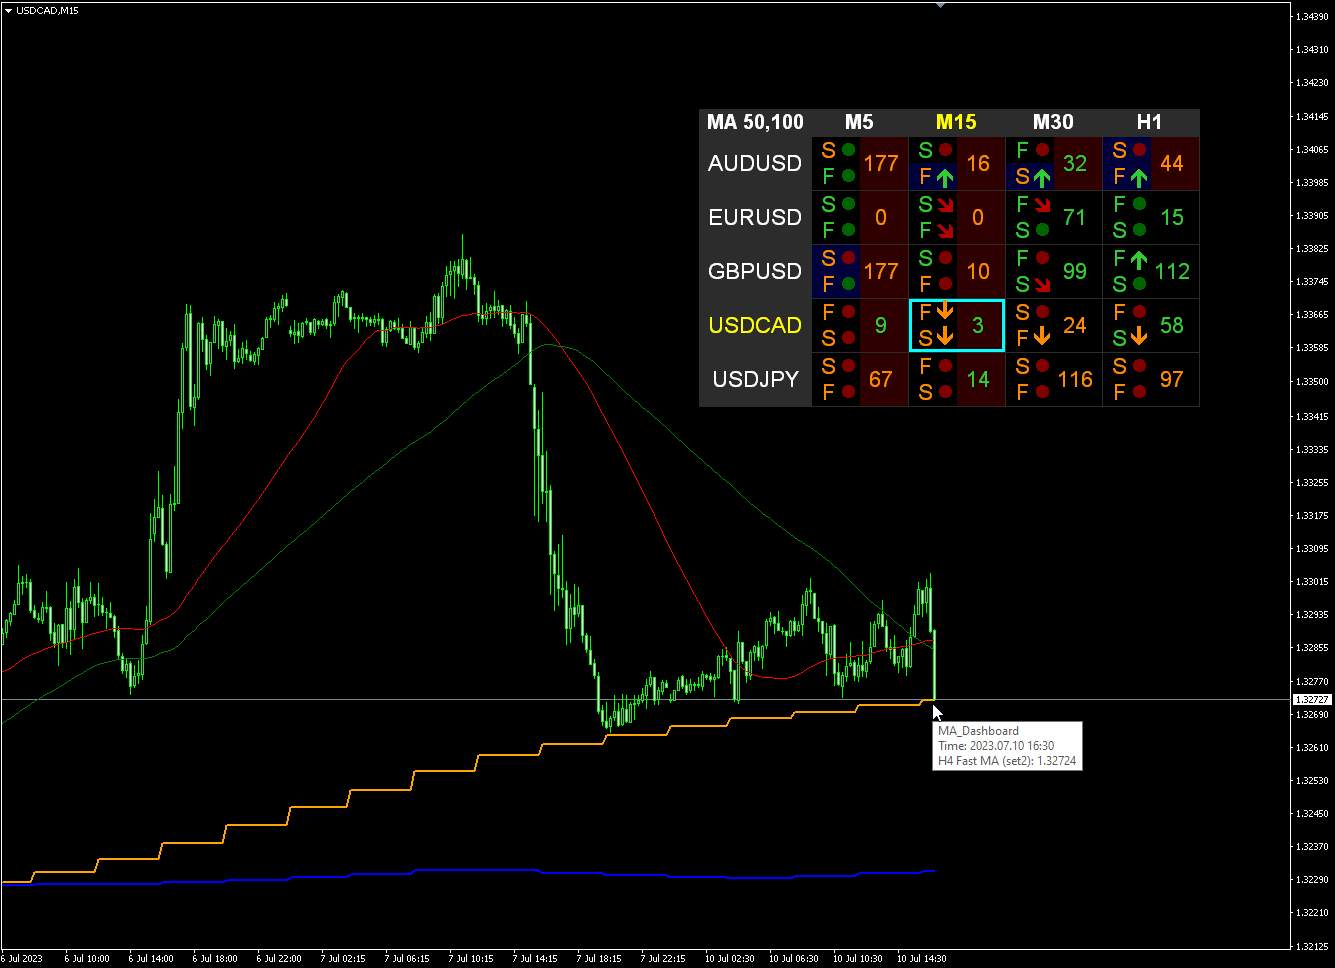
이동 평균(MA) 지표의 다중 통화 및 다중 시간대 수정. 대시보드에서는 지표의 현재 상태를 확인할 수 있습니다. 즉, Fast MA와 Slow MA의 돌파 및 터치(가격별)는 물론 서로 MA 선의 교차점(이동 평균 교차)도 볼 수 있습니다. 매개변수에서 원하는 통화와 기간을 지정할 수 있습니다. 또한 표시기는 선에 닿는 가격과 선의 교차에 대한 알림을 보낼 수 있습니다. 마침표가 있는 셀을 클릭하면 해당 기호와 마침표가 열립니다. MTF 스캐너입니다. 차트에서 여러 대시보드를 실행할 수 있습니다.

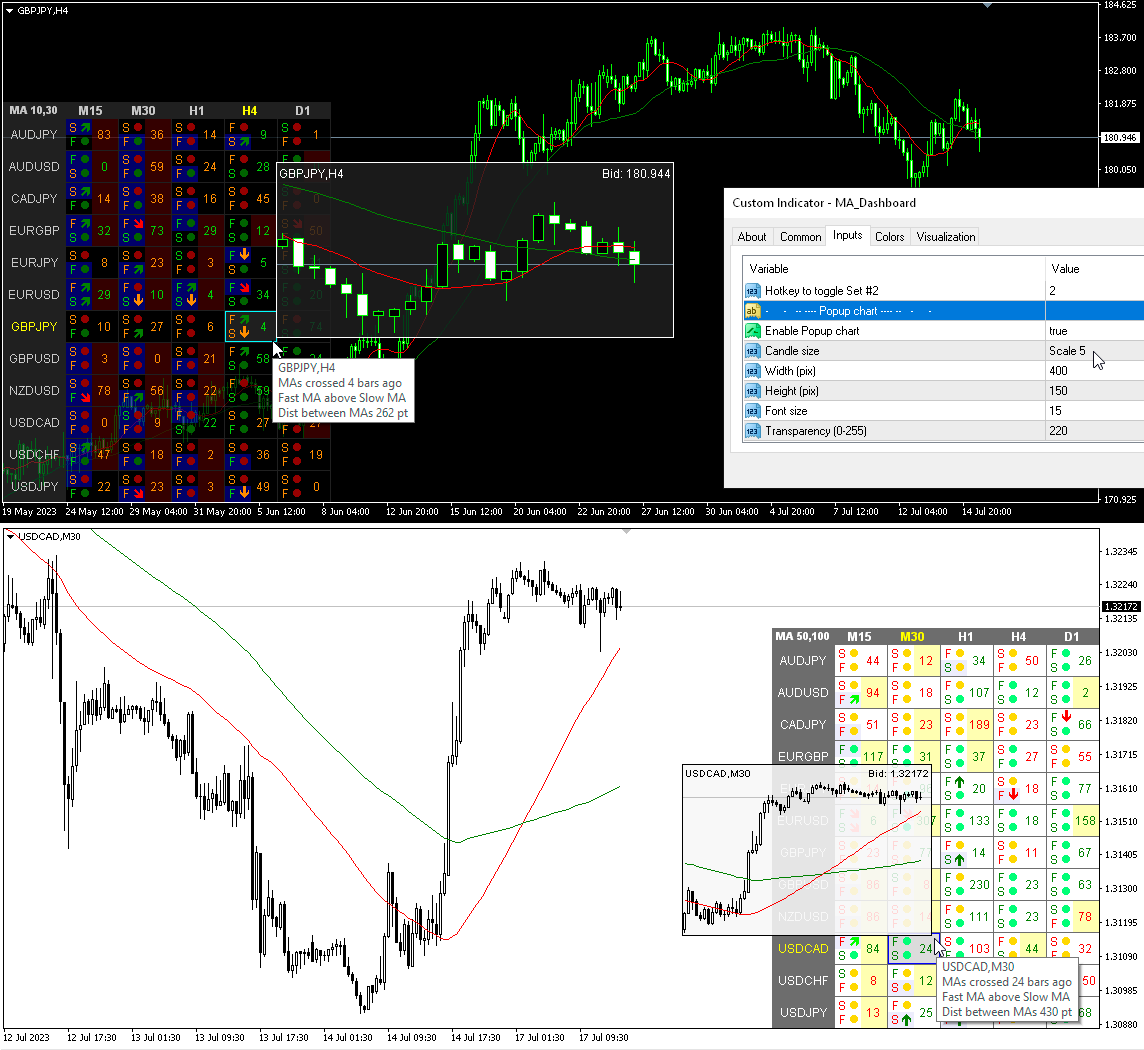
표시기는 현재 차트에 빠른 MA 및 느린 MA 선을 표시합니다. 차트의 MA 기간을 선택하고 다른 기간(MTF MA)의 MA를 볼 수 있습니다. MA의 두 세트에 대한 단축키는 기본적으로 "1"과 "2"입니다.

차트에서 대시보드를 숨기는 키는 기본적으로 "D"입니다.


매개변수

Fast MA
Averaging period — 평균화 기간.
Shift — 옮기다.
Averaging method — 평균화 방법.
Applied price — 적용가격입니다.

Slow MA
Averaging period — 평균화 기간.
Shift — 옮기다.
Averaging method — 평균화 방법.
Applied price — 적용가격입니다.

계기반
All calculation only on closed bar — 모든 계산은 닫힌 막대에서만 수행됩니다.
Clear the chart at startup — 시작 시 차트를 지웁니다.
Set of Pairs — 쌍의 집합
— Market Watch — MT의 "Market Watch"에서 나온 쌍입니다.
— Specified manually — "쌍" 매개변수에서 쌍을 수동으로 지정합니다.
— Current pair — 현재 쌍만 표시합니다.
Pairs (separated by a space or semicolon) — 공백이나 세미콜론으로 구분된 기호 목록입니다. 통화 이름은 대소문자와 접두사/접미사를 유지하면서 브로커의 이름과 동일하게 작성해야 합니다.
Time Frames (separated by a space or semicolon) — 공백 또는 세미콜론으로 구분된 기간 목록(다중 기간)
Sort pairs — 쌍 목록을 정렬합니다.
Position on chart — 차트에 패널을 표시하는 모서리입니다.
X offset (pix) — X축을 따라 패널을 이동합니다.
Y offset (pix) — Y축을 따라 패널을 이동합니다.
Refresh dashboard every (seconds) — 모든 쌍 및 기간에 대한 업데이트 기간입니다.
Open the pair in a new window — 클릭하여 새 차트 창에서 기호를 엽니다.
Chart template — 차트가 새 창에서 열리는 경우 차트 템플릿의 이름입니다.
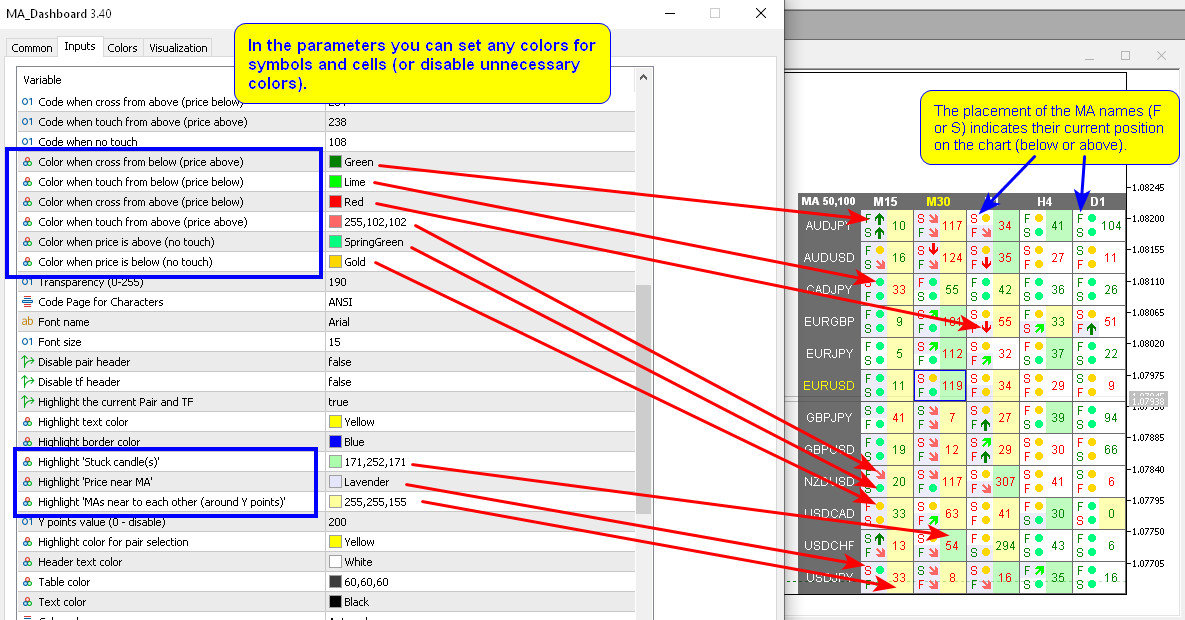
Code when cross from below (price above) — 아래에서 교차할 때의 코드(위 가격);
Code when touch from below (price below) — 아래에서 터치할 때의 코드(아래 가격)
Code when cross from above (price below) — 위에서 교차할 때의 코드(아래 가격);
Code when touch from above (price above) — 위에서 터치할 때의 코드(위 가격)
Code when no touch — 터치가 없을 때 코딩합니다.
Transparency (0-255) — 투명도(0-255);
Font name — 글꼴 이름;
Font size — 글꼴 크기.

경고
Timeframes for alerts (separated by a space or semicolon) — 경고 기간(공백이나 세미콜론으로 구분)
Fast MA crosses Slow MA — 빠른 MA가 느린 MA를 교차합니다.
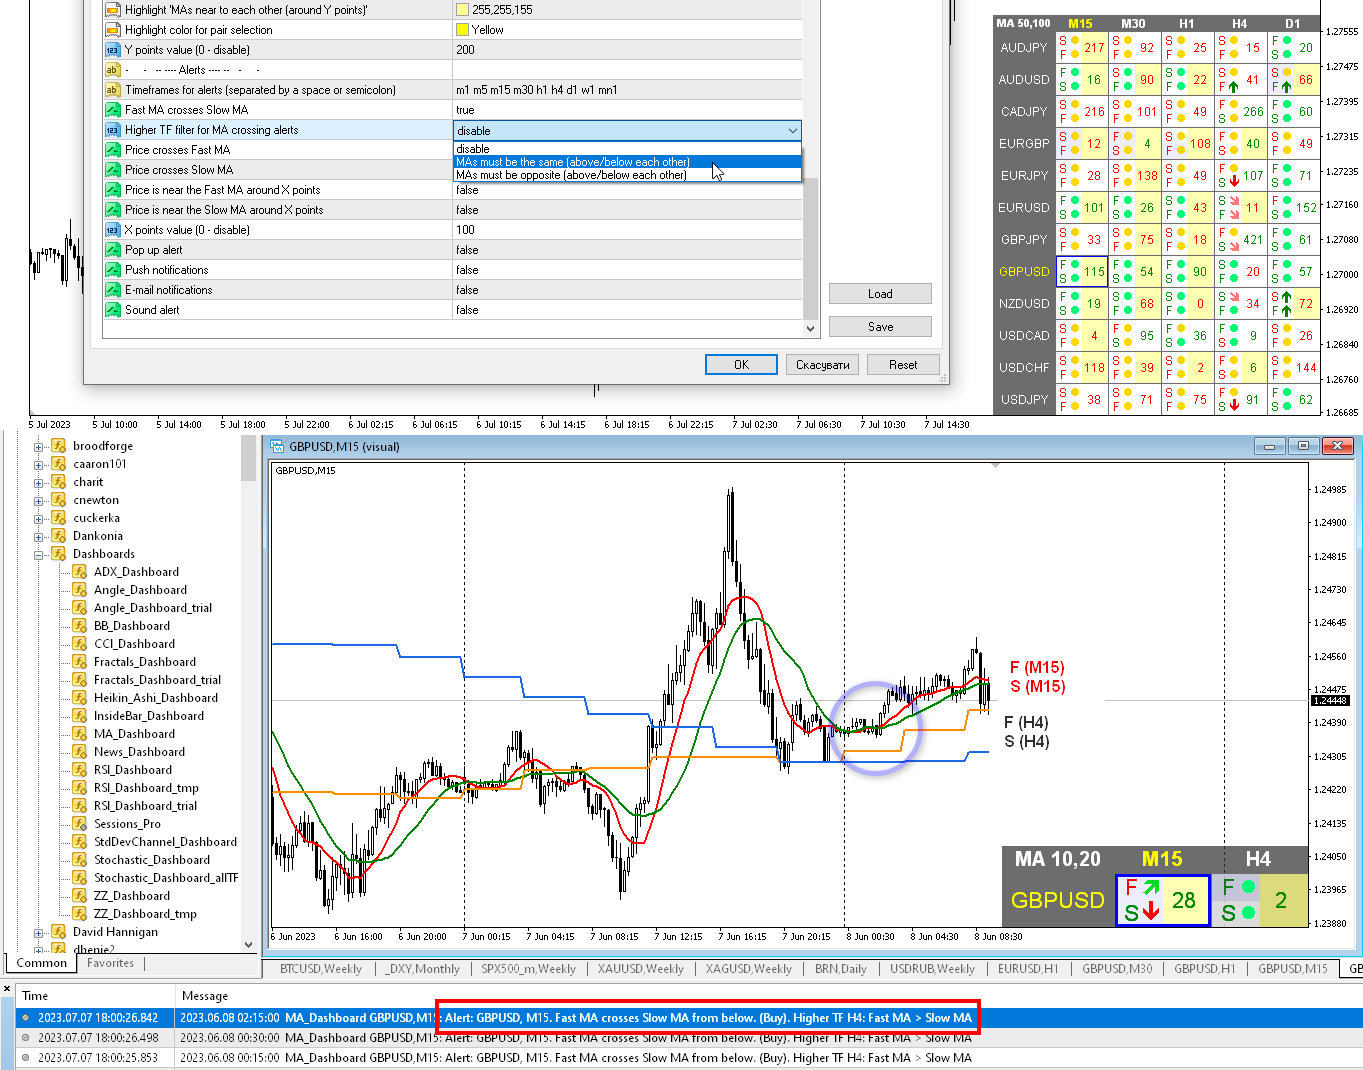
Higher TF filter for MA crossing alerts — 필터가 활성화되면 MA가 교차할 때 표시기는 대시보드에서 다음으로 높은 기간의 MA 값을 확인합니다. 더 높은 시간대의 MA가 지정된 조건을 충족하면 MA 교차 경고가 전송되고, 그렇지 않으면 경고가 발생하지 않습니다.
  • disable — 장애를 입히다
  • MAs must be the same (above/below each other) — MA는 동일해야 합니다(서로 위/아래).
  • MAs must be opposite (above/below each other) — MA는 반대(서로 위/아래)에 있어야 합니다.
Price crosses Fast MA — 가격이 Fast MA를 교차합니다.
Price crosses Slow MA — 가격이 Slow MA를 교차합니다.
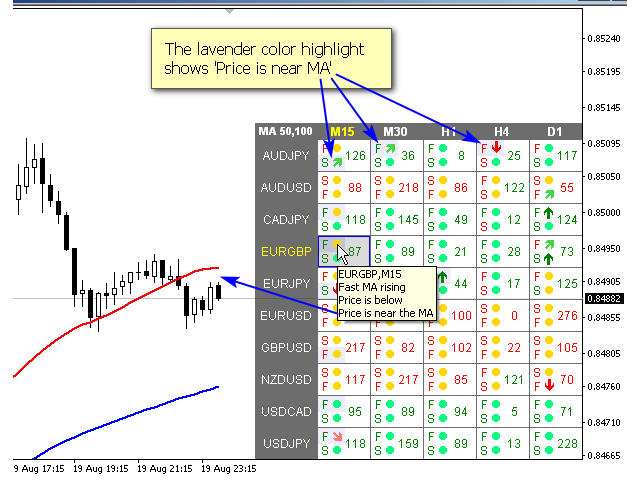
Price is near the Fast MA around X points — 가격은 X 포인트 주변의 Fast MA에 가깝습니다.
Price is near the Slow MA around X points — 가격은 X 포인트 주변의 Slow MA 근처에 있습니다.
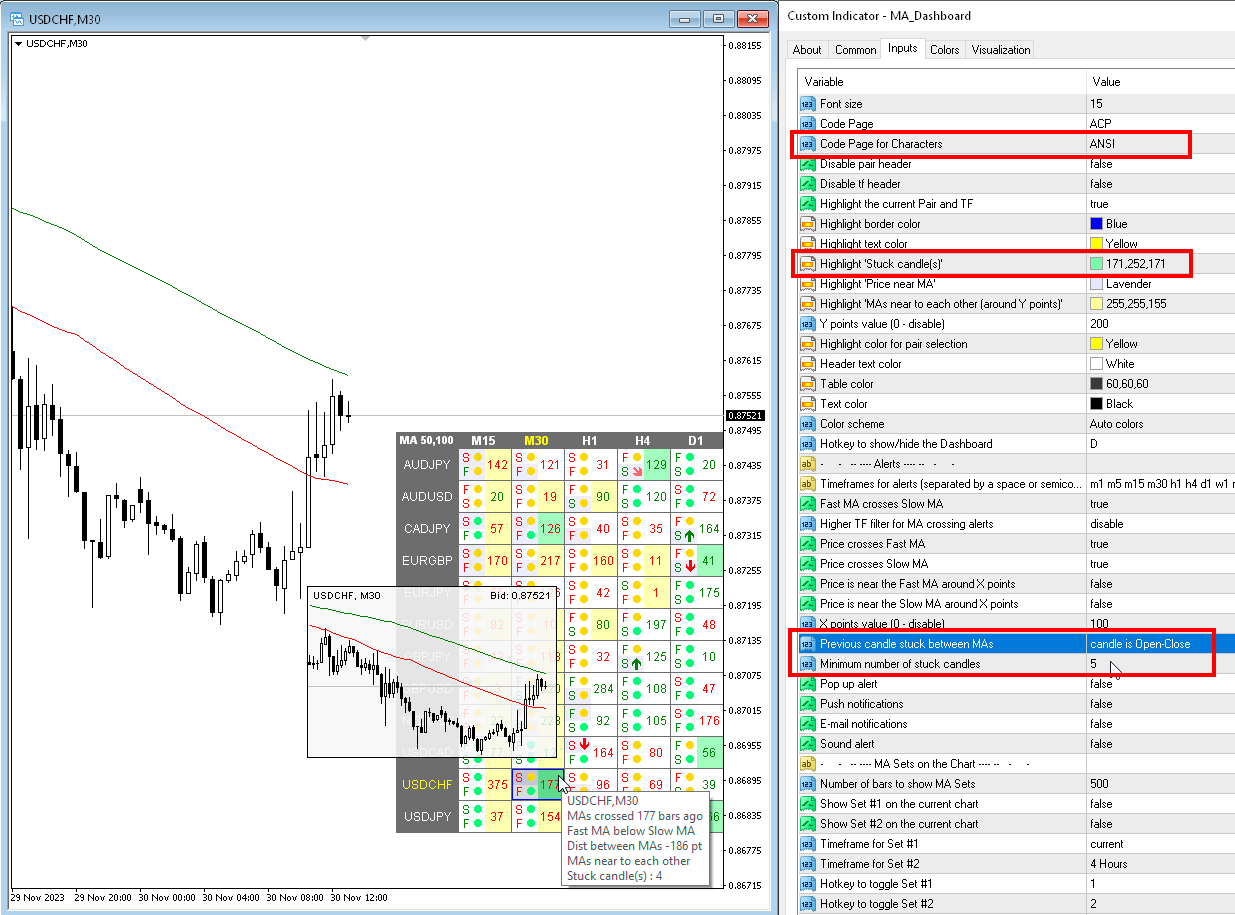
Previous candle stuck between MAs — 이전 캔들이 두 MA 사이에 있는 경우 이에 대한 경고를 받거나 표에서 확인할 수 있습니다.
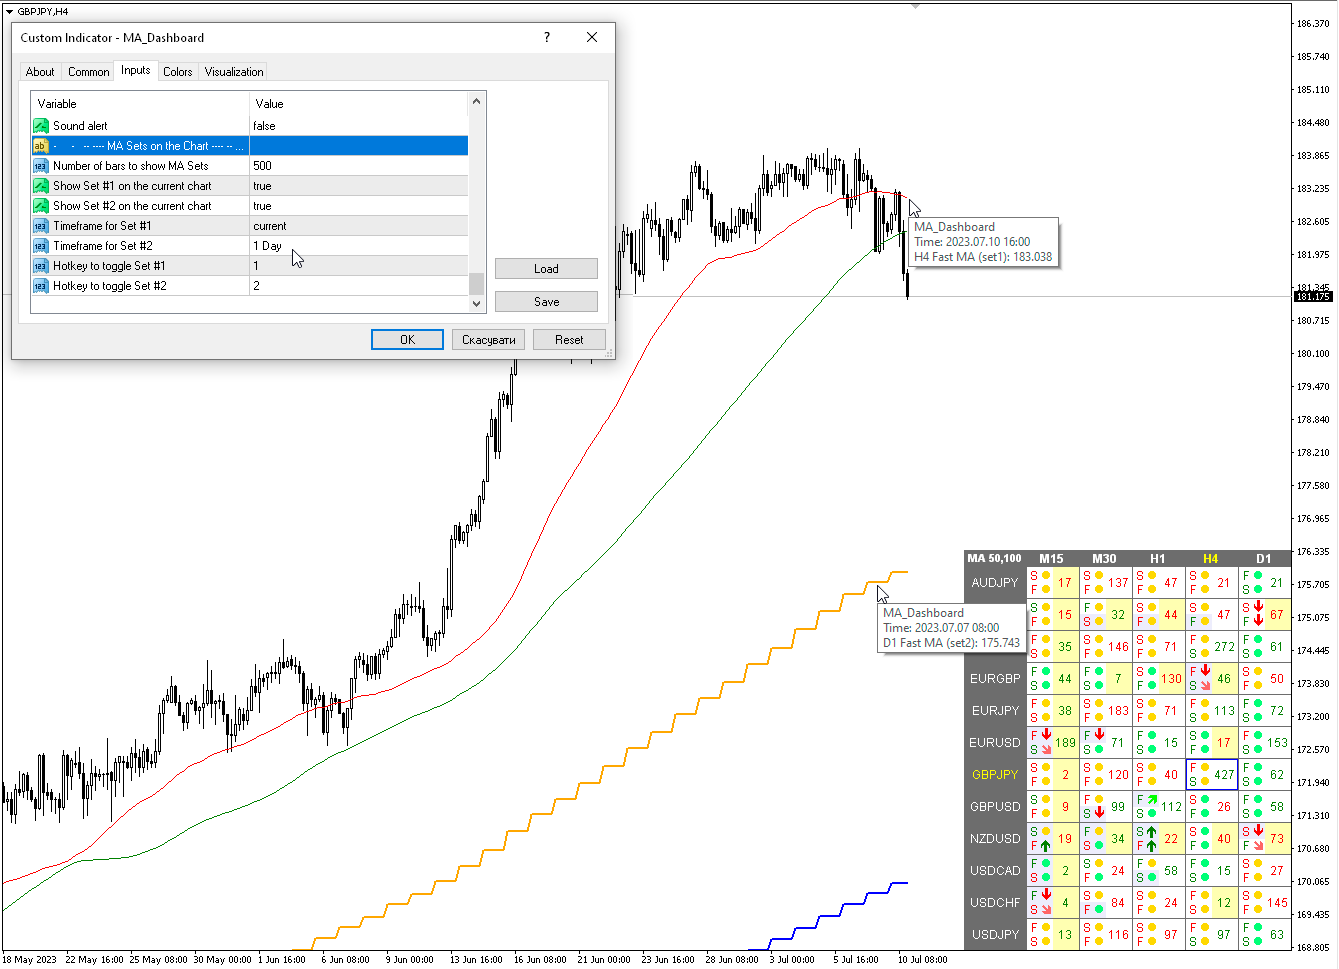
차트의 MA 세트
Number of bars to show MA Sets — MA 세트를 표시할 막대 수
Show Set #1 on the current chart — 현재 차트에 세트 #1 표시
Show Set #2 on the current chart — 현재 차트에 세트 #2 표시
Timeframe for Set #1 — 세트 #1의 기간
Timeframe for Set #2 — 세트 #2의 기간
Hotkey to toggle Set #1 — 세트 #1을 전환하는 단축키
Hotkey to toggle Set #2 — 세트 #2를 전환하는 단축키

팝업 차트
Enable Popup chart — 팝업 차트 활성화
Candle size — 양초 크기
Width (pix) — 너비(픽스)
Height (pix) — 높이(픽스)
Font size — 글꼴 크기
Transparency (0-255) — 투명도(0-255)
리뷰 4
thomas
1409
thomas 2023.11.28 19:12 
 

I bought this indicator a few days ago and I can say it is really very use- and helpful !! As A. Forex already told it would be a good idea to integrate the MT5-standard indicators "Double Exponential Moving Average" and "Triple Exponential Moving Average" to this wonderful tool. To me I am using this both indicators constantly.

IK°L
824
IK°L 2023.11.27 20:50 
 

A great tool, an MA Multicurrency dashboard is essential, it has all kinds of alerts for different setups, it is very easy to read the information on the dashboard, it runs very fluid and without problems. It is a damn delight to explore the markets with these dashboards, I love the little popup window and the extraordinary attention that the developer always provides.

A. Forex
269
A. Forex 2023.10.12 14:57 
 

Great dashboard. Please add DEMA (Double EMA) into the range of MA. WOULD be super. Thank you. Спасибо!

추천 제품
RBreaker
Zhong Long Wu
RBreaker Gold Indicators는 금 선물을 위한 단기 데이 트레이딩 전략으로, 추세 추종과 데이 내 반전의 두 가지 거래 방식을 결합합니다. 추세 장에서 수익을 포착할 수 있을 뿐만 아니라, 시장이 반전될 때 적시에 이익을 확정하고 추세에 맞춰 반대 포지션을 잡을 수 있습니다. 이 전략은 미국 잡지 Futures Truth에서 15년 연속으로 가장 수익성 높은 트레이딩 전략 상위 10위 안에 선정되었습니다. 긴 라이프사이클을 자랑하며, 현재까지 국내외에서 널리 사용되고 연구되고 있습니다. 본 지표는 2026년 금 선물의 움직임을 반영하여 14일 ATR 지표를 기반으로 돌파 계수 A, 관찰 계수 B, 반전 계수 R을 보다 합리적인 값으로 정의했습니다. 매우 훌륭한 지표이며, 안정적인 연간 수익성을 달성했습니다. 강력히 추천합니다~ 위 지표는 변동성이 높은 상품에 적합하며, 매개변수는 금 선물, 주가 지수 선물 등에 적합합니다. 다른 상품이 필요한 경우 돌파 계수 A
MT5용 Crypto_Forex 지표 "동적 과매수/과매수 구간을 포함하는 CCI" (재도색 불필요) - 상품 채널 지수(CCI)는 추세 방향으로의 모멘텀 트레이딩에 매우 유용합니다. - 동적인 과매수 구간에서 매도 진입을, 동적인 과매도 구간에서 매수 진입을 주요 추세 방향으로 유도하는 데 매우 유용합니다. - 이 지표는 가격 움직임 진입과도 결합하면 매우 유용합니다. - 동적인 과매수 구간 - 노란색 선 위. - 동적인 과매도 구간 - 파란색 선 아래. - CCI 오실레이터는 현재 가격과 과거 평균 가격의 차이를 측정합니다. - PC 및 모바일 알림 기능 제공. .................................................................................... 여기를 클릭하여 고품질 트레이딩 로봇과 지표를 확인하세요! MQL5 웹사이트에서만 제공되는 오리지널 상품입니다.
Phantom Bands MT5
Luke Anthony Caras
Phantom Bands – MT5 Indicator Zone-Based Reaction Levels for Price Action Traders Phantom Bands is a MetaTrader 5 custom indicator that draws multiple adaptive bands on your chart. These levels are designed to assist traders in identifying potential price interaction zones based on internal logic — particularly useful for short-term discretionary strategies. Description This indicator creates zone-based bands around internal pivots. The logic behind the bands is based on price interaction
Maximum Trend Arrows OT MT5
Mulweli Valdaz Makulana
STRICTLY FOR BOOM INDEX ONLY!!!!! Here I bring the Maximum Trend Arrows OT1.0 MT5 indicator. This indicator is made up of a combination of different trend indicators for entries and exits, for entries an orange arrow will paint on the chart below the current market and a red flag for closing of trades and it produces buy arrows only. When the orange arrow appears, it will appear along with it's sound to notify you. The 1H timeframe is recommended, don't use it anywhere else than on the 1H timefr
Antique Trend
Nadiya Mirosh
The Antique Trend Indicator is a revolutionary trend trading and filtering solution with all the important features of a trend tool built into one tool! The Antique Trend indicator is good for any trader, suitable for any trader both for Forex and binary options. There is no need to configure anything, everything has been perfected by time and experience, it works great during flats and trends. The Antique Trend indicator is a tool for technical analysis of financial markets, reflecting curren
Supertrend indicator uses a combination of a moving average and average true range to detect the trend of a trading instrument. Supertrend indicator for MetaTrader 5 easily shows the trend as a line following the price. Triple SuperTrend Histo indicator  calculate  three supertrends to show the trend as a histogram. Changing the color from red to green means you can BUY , from green to red means you can SELL . Description of the method of drawing a histogram. The price is above the EMA 200,
Has rsi signal
Evgenii Savinov
HAS RSI Signal — SL/TP 자동 계산 기능이 포함된 전문 트렌드 지표 HAS RSI Signal 은 검증된 클래식 지표와 현대적인 노이즈 필터링 알고리즘을 결합한 강력한 트레이딩 도구입니다. 이 지표는 Heiken Ashi Smoothed (HAS) 캔들과 RSI 오실레이터를 통해 시장을 분석하며, 추세 반전이나 과매수/과매도 구간 이탈 시 트레이더에게 명확한 진입 신호를 제공합니다. 주요 장점: 이중 필터링: Heiken Ashi Smoothed를 사용하여 시장의 '노이즈'를 제거하고, RSI를 통해 모멘텀의 강도를 확인합니다. 자동 레벨 계산: 단순히 신호만 주는 것이 아니라, 변동성( ATR )을 기반으로 최적의 손절매(Stop Loss) 및 이익 실현(Take Profit) 레벨을 자동으로 계산합니다. 시각적 편의성: 신호가 차트 위에 컬러 캔들 형태로 직접 표시되어 복잡하지 않고 직관적으로 추세를 파악할 수 있습니다. 알림 시스템: 터미널 알람, 사운드, 스마
TrendDetect
Pavel Gotkevitch
The Trend Detect indicator combines the features of both trend indicators and oscillators. This indicator is a convenient tool for detecting short-term market cycles and identifying overbought and oversold levels. A long position can be opened when the indicator starts leaving the oversold area and breaks the zero level from below. A short position can be opened when the indicator starts leaving the overbought area and breaks the zero level from above. An opposite signal of the indicator can b
Multiple TimeFrame MACD Confluency Tool
Kelvin Souza Da Costa Oliveira
Multiple Timeframe MACD indicator. This indicator was built for making multiple timeframe analysis possible in MT5 using MACD Indicator. MACD Indicator traditionally shows two lines and one histogram. MACD Line(Yellow) is calculated by subtracting 12period EMA(fast) from 26period EMA (slow). Signal Line(Blue) is created by a 9period EMA from MACD Line. Histogram is just the difference between MACD and Signal lines. Histogram is colored based on the difference between its value and the previous h
An customize Indicator by which you can have Triple moving averages at close prices and send push notification on each crossing.  This indicator is especially useful when you are doing manual trading. Notes: Cation: forex trading is a very risky business,...              don't invest the money you cannot bear to lose.             the probability of losing is high ... more high aaaand exponentially high.... something like EMA enjoy losing with us...
This indicator builds upon the previously posted Nadaraya-Watson smoothers. Here we have created an envelope indicator based on Kernel Smoothing with integrated alerts from crosses between the price and envelope extremities. Unlike the Nadaraya-Watson estimator, this indicator follows a contrarian methodology. Please note that by default this indicator can be subject to repainting. Users can use a non-repainting smoothing method available from the settings. The triangle labels are designed so
First Dawn MT5
Innovicient Limited
The First Dawn indicator uses a unique mechanism to search and plot signals. This keeps searching for signals, making it a great indicator for scaping and identification of changes in direction, swing trading and trend trading. The    First Dawn     helps you get early signals. The backtest gives the true picture of how the indicator works with real/demo accounts. Although this is a tiny indicator it is packed with advantageous settings that will help you whether you desire to: Snap the Peaks a
Discover the Power of the Multi Timeframe MACD Scanner for MT5 The MTF  MACD Scanner indicator is a practical tool for traders using MetaTrader 5 (MT5). It takes the well-known MACD (Moving Average Convergence Divergence) indicator and turns its data into easy-to-read dashboard and candle colors on your chart. This helps you spot market trends, momentum shifts, and potential reversals without needing to analyze separate MACD lines and switch between timeframes. What Does It Do? This indicator cr
Технический индикатор Universal Oscillator является комбинацией торговых сигналов самых популярных и широко используемых осцилляторов. Индикатор представлен гистограммами, а также линиями fast и slow MA, что позволяет расширить список получаемых торговых рекомендаций и работать как по тренду, так и в боковом движении рынка. Таким образом, гистограммы позволяют определить момент пробоя ценовых значений и движение в новой фазе рынка, а линии указывают на зоны перекупленности и перепроданности.  Ос
KasTon Trend System: The Complete 2-in-1 Trading Strategy Identify the Trend, Confirm the Signal, and Trade with Confidence! Do you suffer from confusion while trading? Do you find it difficult to determine the market's direction? Are you tired of losing money on false signals? The KasTon Trend System is here as an integrated solution to all these problems. This is not just an indicator; it is a complete trading strategy built on the synergy of two powerful, custom-built indicators. Our main g
PipFinite Trend PRO MT5
Karlo Wilson Vendiola
4.84 (557)
Breakthrough Solution For Trend Trading And Filtering With All Important Features Built Inside One Tool! Trend PRO's smart algorithm detects the trend, filters out market noise and gives entry signals with exit levels. The new features with enhanced rules for statistical calculation improved the overall performance of this indicator. Important Information Revealed Maximize the potential of Trend Pro, please visit www.mql5.com/en/blogs/post/713938 The Powerful Expert Advisor Version Automatin
Riko Trend mt5
Nadiya Mirosh
The Riko Trend indicator is a revolutionary trend trading and filtering solution with all the important features of a trend tool built into one tool! The Riko Trend indicator is good for any trader, suitable for any trader for both forex and binary options. You don’t need to configure anything, everything is perfected by time and experience, it works great during a flat and in a trend. The Riko Trend indicator is a technical analysis tool for financial markets that reflects the current price f
Hush mt5
Iurii Plokhov
4.33 (3)
Hush mt5 is an advanced indicator that gives a signal about the overbought or oversold market in a certain period of time Hush mt5 the advantage of this indicator is that it does not disappear after the signal on the chart Suitable for any trade: forex, stocks, cryptocurrency, metals Hush mt5 can be used on any time period. The signal goes to the beginning of the next candle after the arrow Hush mt5 performed best on the period H1,H4,daily It can be used in addition to forex, in binary opt
A lot of professional traders use high quality divergence signals as a part of their strategy to enter a position. Spotting correct divergences quickly can often be hard, especially if your eye isn’t trained for it yet. For this reason we’ve created a series of easy to use professional oscillator divergence indicators that are very customisable so you get only the signals you want to trade. We have this divergence indicator for RSI, MACD, Stochastics, CCI and OBV. RSI:   https://www.mql5.com/en/
Directional Force Histogram DFH는 시장 상태를 반영하고 트레이더가 방향성 압력, 움직임의 힘, 둔화 또는 전환 단계를 즉시 해석할 수 있도록 설계된 히스토그램 지표입니다. DFH는 자동 매수 또는 매도 신호를 제공하지 않습니다. 그 목적은 운영적 맥락을 제공하여 의사결정의 질과 포지션 관리를 개선하는 것입니다. DFH가 측정하는 것 상승 압력과 하락 압력 움직임의 강도 둔화와 추진력 상실 전환 및 중립 단계 추세의 품질과 성숙도 정보는 읽기 쉽고 재량 트레이딩에 적합한 색상 히스토그램으로 표시됩니다. 색상과 막대 동역학의 해석 Directional Force Histogram은 시장 상태를 설명하기 위해 색상과 막대의 움직임을 사용합니다. 증가하는 녹색 막대 상승 압력 증가 점진적으로 증가하는 녹색 막대는 상승 압력이 확장되고 있음을 나타냅니다. 시장은 좋은 참여와 함께 상승 방향으로 가속하고 있습니다. 일반적인 사용: long 포지션 유지에 유리한 맥락 증
평면 및 추세를 결정하기 위한 표시기. 가격이 2개의 히스토그램과 2개의 선(빨간색 및 파란색) 중 하나보다 낮으면 판매 영역입니다. 이 버전의 표시기를 구매할 때 하나의 실제 계정과 하나의 데모 계정에 대한 MT4 버전 - 선물로(수신하려면 개인 메시지를 작성하세요)! 가격이 2개의 히스토그램과 2개의 선(빨간색 및 파란색) 중 하나보다 높으면 구매 영역입니다. MT4 버전: https://www.mql5.com/en/market/product/3793 가격이 두 라인 사이 또는 히스토그램 영역에 있으면 시장에 명확한 추세가 없습니다. 간단히 말해서 시장은 평평합니다. 표시기의 작업은 스크린샷에 더 명확하게 표시됩니다. 지표는 선행 데이터를 얻는 데 사용할 수 있습니다. 또는 현재 추세의 상태를 확인합니다.
Bollinger Trend Lines – MT4 & MT5 Bollinger Trend Lines is a professional volatility-based trend indicator designed to clearly identify trend direction and dynamic stop levels using Bollinger Bands. Fuses on one core principle: follow the trend, ignore noise, and let volatility define the stop. How it works The indicator builds trailing trend lines using Bollinger Bands: In an uptrend , the lower band trails price and can only rise In a downtrend , the upper band trails price and can only
# RSI Pro Alert - Advanced RSI Indicator A powerful professional-grade RSI indicator with intelligent alerts, scheduled snapshots, and multi-dimensional notifications to help you capture market opportunities with precision! --- ## Key Features ### Smart Signal Detection - **Precision Cross Detection** : Automatically identifies critical moments when RSI crosses overbought/oversold levels - **State Tracking Mechanism** : Real-time monitoring of market state changes (Overbought/Overso
Ultimate Boom and Crash Indicator The Ultimate Boom and Crash Indicator is a cutting-edge tool developed by  Coetsee Digital , designed to identify potential spike opportunities in the market. Crafted for traders focusing on Deriv and Weltrade synthetic markets, this indicator is optimized to operate exclusively on the 3-minute (M3), 5-minute (M5), 15-minute (M15), 30-minute (M30), and 1-hour (H1) timeframes and supports only the following pairs: PainX 1200, PainX 999, PainX 800, PainX 600, Pai
Overview Donchian Long Edge is a modern take on Richard Donchian’s classic channel breakout strategy — adapted specifically for long-only momentum and reversal entries. It combines the proven logic of Donchian breakouts with ATR-based buffers, rearm logic, and session-aware filters. The indicator highlights buy signals only , designed for trend-following and range-reversal trading approaches. This version introduces session start/end markers and time-based signal filtering , making it especially
PZ Mean Reversion MT5
PZ TRADING SLU
3 (2)
평균 회귀 거래에 대한 전문적이고 정량적인 접근 방식을 구현하는 고유한 지표입니다. 이는 가격이 예측 가능하고 측정 가능한 방식으로 평균으로 전환되고 반환된다는 사실을 이용하여 비정량적 거래 전략을 훨씬 능가하는 명확한 진입 및 퇴장 규칙을 허용합니다. [ Installation Guide | Update Guide | Troubleshooting | FAQ | All Products ] 명확한 거래 신호 놀랍도록 쉬운 거래 사용자 정의 가능한 색상 및 크기 성능 통계 구현 대부분의 거래 전략을 능가합니다. 적절한 SL 및 TP 레벨을 표시합니다. 이메일/음향/시각 알림을 구현합니다. 작동 원리 이 지표는 더 높은 기간에서 완전히 사용자 정의 가능한 이동 평균 주변의 표준 편차를 측정하고 추세 추종 접근 방식을 사용하여 정확하게 거래를 찾습니다. 거래는 현재 차트의 가격 동작을 살펴보고 선택한 더 높은 기간에서 계산된 평균 가격대로 가격이 돌아오면 닫힙니다. 코딩 방식 때문에 지
Heiken Ashi Smoothed Strategy is a very simple but powerful system to get forex market trend direction. This indicator is actually 2 indicators in 1 pack, Heiken Ashi and Heiken Ashi Smoothed Moving Average both included. Because HA (Heiken Ashi) and HAS (Heiken Ashi Smoothed) are calculated in the same one system event with necessary buffers and loop only, so it is the FAST, OPTIMIZED and EFFICIENT HA having the combined indicator of MetaTrader 5. You can choose to display HA and HAS in the sam
Gecko EA MT5
Profalgo Limited
5 (1)
NEW PROMO: Only a few copies copies available at 349$ Next price: 449$ Make sure to check out our " Ultimate EA combo package " in our   promo blog ! Gecko runs a simple, yet very effective, proven strategy.  It looks for important recent support and resistance levels and will trade the breakouts.  This is a "real" trading system, which means it will use a SL to protect the account.  It also means it will not use any dangerous techniques like martingale, grid or averaging down. The EA shows its
SMT DIVERGENCE - GOLD vs SILVER (XAUUSD / XAGUSD) All Timeframe MQL5 Market Product Description ==================================================================== PRODUCT NAME: SMT Divergence Gold vs Silver | Smart Money Scalping Tool SHORT DESCRIPTION (max 63 chars): Catch Gold reversals before they happen using SMT Divergence ---------------------------------------------------------------------- FULL DESCRIPTION ---------------------------------------------------------------------- W
FREE
Faradenza
Tatiana Savkevych
The main application of the Faradenza indicator is to generate buy and sell signals. The indicator tracks the market trend with unrivaled reliability, ignoring sharp market fluctuations and noise around the average price. Determining the market trend is an important task for traders. The Faradenza indicator implements an advanced algorithm for visualizing the market trend. It catches the trend and shows favorable moments of entering the market with arrows. The main purpose of the indicator is to
이 제품의 구매자들이 또한 구매함
ARIPoint
Temirlan Kdyrkhan
ARIPoint is a powerful trading companion designed to generate high-probability entry signals with dynamic TP/SL/DP levels based on volatility. Built-in performance tracking shows win/loss stats, PP1/PP2 hits, and success rates all updated live. Key Features: Buy/Sell signals with adaptive volatility bands Real-time TP/SL/DP levels based on ATR Built-in MA Filter with optional ATR/StdDev volatility Performance stats panel (Success, Profit/Loss, PP1/PP2) Alerts via popup, sound, push, or email Cu
SuperScalp Pro
Van Minh Nguyen
4.63 (24)
SuperScalp Pro – 고급 멀티 필터 스캘핑 지표 시스템 SuperScalp Pro는 클래식 Supertrend와 여러 지능형 확인 필터를 결합한 고급 스캘핑 지표로, 거래 기회를 식별하는 데 도움을 줍니다. M1부터 H4까지 다양한 시간대에서 효율적으로 작동하며, XAUUSD, BTCUSD 및 주요 Forex 통화쌍에 최적화되어 있습니다. 이 지표는 명확한 매수 및 매도 신호를 제공하며, ATR 기반으로 진입가, 손절가, 익절가를 자동 계산하여 보다 효과적인 리스크 관리를 지원합니다. Fibonacci Take Profit 기능은 중요한 가격 구간에서 더 빠르게 포지션을 청산할 수 있도록 하며, 해당 수준 도달 시 알림을 전송합니다. 기본 설정은 Fibonacci Take Profit이 활성화된 상태로 최적화되어 있으며, 보다 안정적이고 일관된 거래 경험에 중점을 둡니다. 차트에 적용하는 것만으로 즉시 사용할 수 있습니다. 고급 사용자를 위해 모든 파라미터는 자유롭게 사용
Divergence Bomber
Ihor Otkydach
4.9 (89)
이 지표를 구매하신 분께는 다음과 같은 혜택이 무료로 제공됩니다: 각 거래를 자동으로 관리하고, 손절/익절 수준을 설정하며, 전략 규칙에 따라 거래를 종료하는 전용 도우미 툴 "Bomber Utility" 다양한 자산에 맞게 지표를 설정할 수 있는 셋업 파일(Set Files) "최소 위험", "균형 잡힌 위험", "관망 전략" 모드로 설정 가능한 Bomber Utility의 셋업 파일 이 전략을 빠르게 설치, 설정, 시작할 수 있도록 돕는 단계별 영상 매뉴얼 주의: 위의 모든 보너스를 받기 위해서는 MQL5 개인 메시지 시스템을 통해 판매자에게 연락해 주세요. 독창적인 커스텀 지표인 “Divergence Bomber(다이버전스 봄버)”를 소개합니다. 이 지표는 MACD 다이버전스(괴리) 전략을 기반으로 한 올인원(All-in-One) 거래 시스템입니다. 이 기술 지표의 주요 목적은 가격과 MACD 지표 간의 다이버전스를 감지하고, **향후 가격이 어느 방향으로 움직일지를 알려주는
Entry In The Zone and SMC Multi Timeframe is a real-time 2-in-1 market analysis tool that combines market structure analysis and a No Repaint BUY / SELL signal system into a single indicator, built on Smart Money Concepts (SMC) — a widely adopted framework used by professional traders to understand market structure. This indicator helps you see the market more clearly, make decisions based on structure rather than guesswork, and focus on high-probability zones where price is more likely to react
SignalTech MT5
Yue Wang
5 (21)
SignalTech MT5 is an unique fully rule based trading system for EURUSD, USDCHF, USDJPY, AUDUSD, NZDUSD, EURJPY, AUDJPY, NZDJPY, CADJPY.  All the winning trades with chart setups are published on the comments page. 2026-05 2802 Pips (Until 05-15 NY Closed) 2026-04 2243 Pips 2026-03 2165 Pips 2026-02 2937 Pips 2026-01 2624 Pips 2025-12 1174 Pips It can generate signals with Buy/Sell Arrows and Pop-Up/Sound Alerts. Each signal has clear Entry and Stop Loss levels, which should be automatically flag
Power Candles MT5
Daniel Stein
5 (8)
Power Candles V3 - 자체 최적화 강도 지표 파워 캔들 V3는 적용된 모든 차트에서 통화 및 상품의 강세를 실행 가능한 거래 계획으로 전환합니다. 단순히 캔들에 색상을 입히는 대신, 백그라운드에서 실시간 자동 최적화를 수행하여 현재 보고 있는 종목에 대한 최적의 손절매, 익절 및 신호 임계값을 제공합니다. 한 번의 클릭으로 실시간 거래에 적용할 수 있으며, 진입점, 손절매 및 익절 선이 정확한 가격에 맞춰 차트에 표시되고, 방향과 함께 알림이 발령됩니다. 이 도구는 Stein Investments 에코시스템의 일부입니다. 18개 이상의 도구와 함께 당신의 1대1 AI 트레이딩 멘토 Max.  항상 대기 중, 모든 인디케이터를 깊이 있게 이해, 무언가를 차근차근 생각해보고 싶은 순간에 도움을 줍니다.  https://stein.investments 에서 만나보세요 매 종가 바마다 3,000회 이상의 트레이딩 시뮬레이션. 9가지 강도 상태. 2가지 전략을 병렬로 테스트.
Gann Made Easy MT5
Oleg Rodin
5 (4)
Gann Made Easy 는 mr.의 이론을 사용하여 최고의 거래 원칙을 기반으로 하는 전문적이고 사용하기 쉬운 Forex 거래 시스템입니다. W.D. 간. 이 표시기는 Stop Loss 및 Take Profit Levels를 포함하여 정확한 BUY 및 SELL 신호를 제공합니다. PUSH 알림을 사용하여 이동 중에도 거래할 수 있습니다. 구매 후 거래 방법 안내 및 유용한 추가 지표를 무료로 받으시려면 저에게 연락주세요! 아마도 Gann 거래 방법에 대해 이미 여러 번 들었을 것입니다. 일반적으로 Gann의 이론은 초보자 거래자뿐만 아니라 이미 거래 경험이 있는 사람들에게도 매우 복잡한 것입니다. Gann의 거래 방식은 이론적으로 적용하기 쉽지 않기 때문입니다. 나는 그 지식을 연마하고 Forex 지표에 최고의 원칙을 적용하기 위해 몇 년을 보냈습니다. 표시기는 적용하기가 매우 쉽습니다. 차트에 첨부하고 간단한 거래 권장 사항을 따르기만 하면 됩니다. 지표는 지속적으로 시장 분석
이 지표를 구매하면 제 프로페셔널 트레이드 매니저를 무료로 드립니다. 우선 이 거래 시스템이 리페인팅, 리드로잉 및 레이그 인디케이터가 아니라는 점을 강조하는 것이 중요합니다. 이는 수동 및 로봇 거래 모두에 이상적인 것으로 만듭니다. 온라인 강좌, 설명서 및 프리셋 다운로드. "스마트 트렌드 트레이딩 시스템 MT5"은 새로운 및 경험이 풍부한 트레이더를 위해 맞춤형으로 제작된 종합적인 거래 솔루션입니다. 10개 이상의 프리미엄 인디케이터를 결합하고 7개 이상의 견고한 거래 전략을 특징으로 하여 다양한 시장 조건에 대한 다목적 선택이 가능합니다. 트렌드 추종 전략: 효과적인 트렌드 추이를 타기 위한 정확한 진입 및 손절 관리를 제공합니다. 반전 전략: 잠재적인 트렌드 반전을 식별하여 트레이더가 범위 시장을 활용할 수 있게 합니다. 스캘핑 전략: 빠르고 정확한 데이 트레이딩 및 단기 거래를 위해 설계되었습니다. 안정성: 모든 인디케이터가 리페인팅, 리드로잉 및 레이그가 아니므로 신뢰
SMC Intraday Formula
Kareem Abbas
5 (9)
먼저 솔직하게 말하겠습니다. 어떤 인디케이터도 단독으로 당신을 수익성 있게 만들어주지 않습니다. 누군가 그렇게 말한다면, 그는 당신에게 꿈을 파는 것입니다. 완벽한 매수/매도 화살표를 보여주는 모든 인디케이터는 완벽하게 보이도록 만들 수 있습니다 — 단지 올바른 과거 구간을 확대하고 승리한 거래만 캡처하면 됩니다. 우리는 그렇게 하지 않습니다.  SMC Intraday Formula는 도구입니다. 시장 구조를 읽고, 가장 높은 확률의 가격 구간을 표시하며, 현재 스마트 머니의 흐름이 어떻게 보이는지 아주 단순한 언어로 보여줍니다. 최종 결정은 여전히 당신이 합니다. 실행도 당신이 합니다. 하지만 이제는 희망이 아니라 정확성으로 거래하게 됩니다. 우리는 이 인디케이터를 지난 약 3년 동안 골드(XAUUSD) 및 주요 외환 통화쌍의 데이 트레이딩 스캘핑에 사용해 왔습니다. M1, M5, M15, M30에서 우리의 핵심 도구입니다. 이 도구는 미래를 예측하려 하지 않습니다 — 지금 형성
소개       Quantum Breakout PRO   , 브레이크아웃 존 거래 방식을 변화시키는 획기적인 MQL5 지표! 13년 이상의 거래 경험을 가진 숙련된 트레이더 팀이 개발한       퀀텀 브레이크아웃 PRO       혁신적이고 역동적인 브레이크아웃 존 전략으로 거래 여정을 새로운 차원으로 끌어올리도록 설계되었습니다. Quantum Breakout Indicator는 5개의 이익 목표 영역이 있는 브레이크아웃 영역의 신호 화살표와 브레이크아웃 상자를 기반으로 한 손절 제안을 제공합니다. 초보자 거래자와 전문 거래자 모두에게 적합합니다. Quantum EA 채널:       여기를 클릭하세요 중요한! 구매 후 설치 매뉴얼을 받으려면 개인 메시지를 보내주십시오. 추천: 기간: M15 통화쌍: GBPJPY, EURJPY, USDJPY,NZDUSD, XAUUSD 계정 유형: 스프레드가 매우 낮은 ECN, Raw 또는 Razor 브로커 시간: GMT +3 중개인 :
Azimuth Pro
Ottaviano De Cicco
5 (7)
Azimuth Pro V2: Synthetic Fractal Structure and Confirmed Entries for MT5 Overview Azimuth Pro is a multi-level swing structure indicator by Merkava Labs . Four nested swing layers, swing-anchored VWAP, ABC pattern detection, three-timeframe structural filtering, and closed-bar confirmed entries — one chart, one workflow from micro-swings to macro-cycles. This is not a blind signal product. It is a structure-first workflow for traders who care about location, context, and timing. V2 Launch Offe
Meridian Pro
Ottaviano De Cicco
5 (2)
Meridian Pro 2.00: Professional Multi-Timeframe Trend Matrix for MT5 Meridian Pro 2.00 is a professional adaptive trend matrix for MetaTrader 5. It combines the original Meridian trend engine, a clean chart ribbon, closed-bar signal arrows, an 8-timeframe dashboard, Fuel momentum, weighted consensus, synthetic HTF processing and chart-native higher-timeframe context lines. The goal is simple: read current trend, multi-timeframe structure, strength, momentum and EA-ready state from one discipline
우선적으로, 이 거래 도구는 전문적인 거래에 이상적인 비-다시 그리기 및 지연되지 않는 지표입니다.  온라인 강좌, 사용자 매뉴얼 및 데모. 스마트 가격 액션 컨셉트 인디케이터는 신규 및 경험 많은 트레이더 모두에게 매우 강력한 도구입니다. Inner Circle Trader Analysis 및 Smart Money Concepts Trading Strategies와 같은 고급 거래 아이디어를 결합하여 20가지 이상의 유용한 지표를 하나로 결합합니다. 이 인디케이터는 스마트 머니 컨셉트에 중점을 두어 대형 기관의 거래 방식을 제공하고 이동을 예측하는 데 도움을 줍니다.  특히 유동성 분석에 뛰어나 기관이 어떻게 거래하는지 이해하는 데 도움을 줍니다. 시장 트렌드를 예측하고 가격 변동을 신중하게 분석하는 데 탁월합니다. 귀하의 거래를 기관 전략에 맞추어 시장의 동향에 대해 더 정확한 예측을 할 수 있습니다. 이 인디케이터는 시장 구조를 분석하고 중요한 주문 블록을 식별하고 다양
FX Trend MT5 NG
Daniel Stein
5 (4)
FX Trend NG: 차세대 멀티 마켓 트렌드 인텔리전스 개요 FX Trend NG 는 다중 시간 프레임 기반의 전문 트렌드 분석 및 시장 모니터링 도구입니다. 몇 초 만에 전체 시장 구조를 파악할 수 있도록 설계되었습니다. 여러 차트를 일일이 전환할 필요 없이, 어떤 종목이 추세에 있는지, 어디에서 모멘텀이 약화되고 있는지, 그리고 어떤 시간 프레임이 서로 정렬되어 있는지 즉시 확인할 수 있습니다. 출시 기념 특별 혜택 – FX Trend NG 를 $30 (6개월) 또는 $80 평생 라이선스 로 이용할 수 있습니다. 이미 Stein Investments 고객이신가요? -> 메시지를 보내 전용 고객 그룹에 참여하세요. 설정이나 사용 방법이 필요하신가요? -> Stein Investments 공식 페이지 를 방문하세요. 1. FX Trend NG가 특별한 이유 3단계 추세 로직 – 단순한 Buy / Sell이 아닙니다 • 대부분의 지표는 Buy 또는 Sell 두 가지 상태만 제
Trend Screener Pro MT5
STE S.S.COMPANY
4.85 (104)
트렌드 표시기, 트렌드 트레이딩 및 필터링을 위한 획기적인 고유 솔루션, 하나의 도구 안에 내장된 모든 중요한 트렌드 기능! Forex, 상품, 암호 화폐, 지수 및 주식과 같은 모든 기호/도구에 사용할 수 있는 100% 다시 칠하지 않는 다중 시간 프레임 및 다중 통화 표시기입니다. Trend Screener는 차트에 점이 있는 화살표 추세 신호를 제공하는 효율적인 지표 추세 추종 지표입니다. 추세 분석기 표시기에서 사용할 수 있는 기능: 1. 트렌드 스캐너. 2. 최대 이익 분석이 있는 추세선. 3. 추세 통화 강도 측정기. 4. 경고가 있는 추세 반전 점. 5. 경고가 있는 강력한 추세 점. 6. 추세 화살표 Trend Screener Indicator가 있는 일일 분석 예, 일일 신호 성능...등은 여기에서 찾을 수 있습니다. 여기를 클릭하십시오. LIMITED TIME OFFER : Trend Screener Indicator는 50$ 및 평생 동안만 사용할 수 있습니다.
KT Alpha Hunter Arrows MT5
KEENBASE SOFTWARE SOLUTIONS
대부분의 화살표 인디케이터는 신호만 보여주고, 나머지 판단은 모두 트레이더에게 맡깁니다. KT Alpha Hunter Arrows는 완성된 트레이딩 플랜을 제공합니다. 각 신호 화살표가 표시될 때마다 진입선, 손절선, 네 개의 익절 목표, 그리고 현재 심볼과 시간대가 지금 거래할 가치가 있는지 알려주는 실시간 엣지 판정이 함께 그려집니다. 포함된 Trade Manager EA는 사용자가 직접 진입한 뒤의 실행 관리를 맡아, 시장이 흔들리고 감정이 개입되기 쉬운 상황에서도 거래 원칙을 유지할 수 있도록 도와줍니다. 리페인트 없음. 종가 확정 후 신호만 표시. Forex, Gold, Indices 및 사용자가 거래하는 다양한 MT5 지원 상품에 맞게 설계되었습니다. 주요 기능 캔들이 마감된 후에만 표시되는 리페인트 없는 매수 및 매도 화살표. 각 신호마다 진입선, 구조적 손절선, 네 개의 익절 목표 표시. 현재 차트에서 매수와 매도 셋업을 별도로 평가하는 Edge Dashboard.
Gem SIGNAL
Shengzu Zhong
5 (1)
GEM Signal Pro GEM Signal Pro는 MetaTrader 5용 추세추종형 지표로, 차트에서 더 명확한 신호, 더 구조적인 트레이드 설정, 그리고 더 실용적인 리스크 관리를 원하는 트레이더를 위해 설계되었습니다. 단순한 화살표만 표시하는 것이 아니라, GEM Signal Pro는 전체 트레이드 아이디어를 더 깔끔하고 읽기 쉬운 방식으로 보여줍니다. 조건이 확인되면 진입가, 손절가, 목표가를 차트에 표시하여 트레이더가 설정을 더 효율적으로 검토할 수 있도록 도와줍니다. 작동 방식 이 지표는 먼저 내부 로직에 따라 유효한 초기 신호를 식별합니다. 확인 조건이 충족되면, GEM Signal Pro는 차트에 전체 설정을 표시합니다. 이를 통해 트레이더는 거래 구조를 더 명확하게 보고, 수동 분석 작업을 줄일 수 있습니다. 차트에 표시되는 거래 레벨 확인된 신호에 대해, GEM Signal Pro는 다음을 표시할 수 있습니다. 진입가 손절가 목표가 1 목표가 2 목표가 3 손
Entry Points Pro for MT5
Yury Orlov
4.48 (138)
다시 색을 칠하지 않고 거래에 진입할 수 있는 정확한 신호를 제공하는 MT5용 지표입니다. 외환, 암호화폐, 금속, 주식, 지수 등 모든 금융 자산에 적용할 수 있습니다. 매우 정확한 추정값을 제공하고 매수와 매도의 가장 좋은 시점을 알려줍니다. 하나의 시그널로 수익을 내는 지표의 예와 함께 비디오 (6:22)시청하십시오! 대부분의 거래자는 Entry Points Pro 지표의 도움으로 첫 거래 주 동안 트레이딩 결과를 개선합니다. 저희의   Telegram Group 을 구독하세요! Entry Points Pro 지표의 좋은점. 재도색이 없는 진입 신호 신호가 나타나고 확인되면(시그널 캔들이 완성된 경우) 신호는 더 이상 사라지지 않습니다. 여타 보조지표의 경우 신호를 표시한 다음 제거되기 때문에 큰 재정적 손실로 이어집니다. 오류 없는 거래 게시 알고리즘을 통해 트레이드(진입 또는 청산)를 할 이상적인 순간을 찾을 수 있으며, 이를 통해 이를 사용하는 모든 거래자의 성공률이
Basic Harmonic Patterns Dashboard MT5
Mehran Sepah Mansoor
4.36 (11)
이 대시보드는 선택한 심볼에 대해 사용 가능한 최신 고조파 패턴을 표시하므로 시간을 절약하고 더 효율적으로 사용할 수 있습니다 /   MT4 버전 . 무료 인디케이터:   Basic Harmonic Pattern 인디케이터 열 Symbol :   선택한 심볼이 나타납니다 Trend :   강세 또는 약세 Pattern :   패턴 유형(가틀리, 나비, 박쥐, 게, 상어, 사이퍼 또는 ABCD) Entry :   진입 가격 SL:   스톱로스 가격 TP1:   1차 테이크프로핏 가격 TP2:   2차 테이크프로핏 가격 TP3:   3차 테이크프로핏 가격 Current price:   현재 가격 Age (in bars):   마지막으로 그려진 패턴의 나이 주요 입력 Symbols :   "28개 주요 통화쌍" 또는 "선택한 심볼" 중에서 선택합니다. Selected Symbols :   쉼표로 구분하여 모니터링하려는 원하는 심볼("EURUSD,GBPUSD,XAUUSD")을 선택
Btmm state engine pro
Garry James Goodchild
5 (4)
BTMM State Engine Pro is a MetaTrader 5 indicator for traders who use the Beat The Market Maker approach: Asian session context, kill zone timing, level progression, peak formation detection, and a multi-pair scanner from a single chart. It combines cycle state logic with a built-in scanner dashboard so you do not need the same tool on many charts at once. What it does Draws the Asian session range; session times can follow broker server offset or be set in inputs. Tracks level progression (L
Market Structure Order Block Dashboard MT5는 시장 구조와 주요 가격 반응 구역을 차트에서 직접 읽고자 하는 트레이더를 위해 설계된 MT5 지표입니다. BOS, ChoCH, 오더 블록, Fair Value Gap (FVG), 유동성, Kill Zones, Volume Profile 그리고 빠른 분석을 위한 콤팩트한 대시보드를 결합합니다. 이 지표는 시장 구조, ICT 및 Smart Money 개념을 의사결정 프레임워크로 사용하는 트레이더를 대상으로 합니다. 추세 지속, 가능한 반전, 가격 불균형, 유동성 타겟 및 관심 구역을 보다 체계적으로 식별하는 데 도움을 줄 수 있습니다. 구매자를 위한 포함 리소스 구매 후 MQL5 개인 메시지로 요청하시면 완전한 PDF 사용 설명서와 파라미터 설정 팁을 제공해 드립니다. MQL5 개인 메시지를 통한 직접 기술 지원. 1.20 버전은 두 가지 주요 추가 기능을 제공합니다: Pending BOS / Pending
Trend Forecaster
Alexey Minkov
5 (7)
Trend Forecaster – Since 2023. The Trend Forecaster indicator utilizes a unique proprietary algorithm to determine entry points for a breakout trading strategy. The indicator identifies price clusters, analyzes price movement near levels, and provides a signal when the price breaks through a level. The Trend Forecaster indicator is suitable for all financial assets, including currencies (Forex), metals, stocks, indices, and cryptocurrencies. You can also adjust the indicator to work on any time
Quantum TrendPulse
Bogdan Ion Puscasu
5 (25)
SuperTrend   ,   RSI   ,   Stochastic   의 힘을 하나의 포괄적인 지표로 결합하여 트레이딩 잠재력을 극대화하는 궁극의 트레이딩 도구   인 Quantum TrendPulse를   소개합니다. 정밀성과 효율성을 추구하는 트레이더를 위해 설계된 이 지표는 시장 추세, 모멘텀 변화, 최적의 진입 및 종료 지점을 자신 있게 식별하는 데 도움이 됩니다. 주요 특징: SuperTrend 통합:   주요 시장 추세를 쉽게 따라가고 수익성의 물결을 타세요. RSI 정밀도:   매수 과다 및 매도 과다 수준을 감지하여 시장 반전 시점을 파악하는 데 적합하며 SuperTrend 필터로 사용 가능 확률적 정확도:   변동성이 큰 시장에서 숨겨진 기회를 찾기 위해 확률적 진동   을 활용하고 SuperTrend의 필터로 사용 다중 시간대 분석:   M5부터 H1 또는 H4까지 다양한 시간대에 걸쳐 시장을 최신 상태로 유지하세요. 맞춤형 알림:   맞춤형 거래 조건이 충족되면
Grabber System MT5
Ihor Otkydach
4.83 (23)
탁월한 기술적 지표인 Grabber를 소개합니다. 이 도구는 즉시 사용 가능한 “올인원(All-Inclusive)” 트레이딩 전략으로 작동합니다. 하나의 코드 안에 강력한 시장 기술 분석 도구, 매매 신호(화살표), 알림 기능, 푸시 알림이 통합되어 있습니다. 이 인디케이터를 구매하신 모든 분들께는 다음의 항목이 무료로 제공됩니다: Grabber 유틸리티: 오픈 포지션을 자동으로 관리하는 도구 단계별 영상 매뉴얼: 설치, 설정, 그리고 실제 거래 방법을 안내 맞춤형 세트 파일: 인디케이터를 빠르게 자동 설정하여 최고의 성과를 낼 수 있도록 도와줍니다 다른 전략은 이제 잊어버리세요! Grabber만이 여러분을 새로운 트레이딩의 정점으로 이끌어 줄 수 있습니다. Grabber 전략의 주요 특징: 거래 시간 프레임: M5부터 H4까지 거래 가능한 자산: 어떤 자산이든 사용 가능하지만, 제가 직접 테스트한 종목들을 추천드립니다 (GBPUSD, GBPCAD, GBPCHF, AUDCAD, AU
FX Power MT5 NG
Daniel Stein
5 (31)
FX Power: 통화 강세 분석으로 더 스마트한 거래 결정을 개요 FX Power 는 어떤 시장 상황에서도 주요 통화와 금의 실제 강세를 이해하기 위한 필수 도구입니다. 강한 통화를 매수하고 약한 통화를 매도함으로써 FX Power 는 거래 결정을 단순화하고 높은 확률의 기회를 발견합니다. 트렌드를 따르거나 극단적인 델타 값을 사용해 반전을 예측하고자 한다면, 이 도구는 귀하의 거래 스타일에 완벽히 적응합니다. 단순히 거래하지 말고, FX Power 로 더 스마트하게 거래하세요. 1. FX Power가 거래자에게 매우 유용한 이유 통화와 금의 실시간 강세 분석 • FX Power 는 주요 통화와 금의 상대적 강세를 계산하고 표시하여 시장 역학에 대한 명확한 통찰력을 제공합니다. • 어떤 자산이 앞서고 있고 어떤 자산이 뒤처지는지 모니터링하여 보다 현명한 거래 결정을 내릴 수 있습니다. 포괄적인 멀티 타임프레임 뷰 • 단기, 중기 및 장기 타임프레임에서 통화와 금의 강세를
Atomic Analyst MT5
Issam Kassas
3.94 (31)
우선적으로 언급할 점은이 거래 지표가 다시 그리지 않고 지연되지 않으며 이를 통해 수동 및 로봇 거래 모두에 이상적이라는 점입니다. 사용자 매뉴얼: 설정, 입력 및 전략. Atomic Analyst는 가격의 강도와 모멘텀을 활용하여 시장에서 더 나은 이점을 찾는 PA Price Action Indicator입니다. 고급 필터를 장착하여 잡음과 거짓 신호를 제거하고 거래 잠재력을 높이는 데 도움이 됩니다. 복잡한 지표의 다중 레이어를 사용하여 Atomic Analyst는 차트를 스캔하고 복잡한 수학적 계산을 간단한 신호와 색상으로 변환하여 초보 트레이더가 이해하고 일관된 거래 결정을 내릴 수 있도록합니다. "Atomic Analyst"는 새로운 및 경험이 풍부한 트레이더를위한 종합적인 거래 솔루션입니다. 프리미엄 지표와 최고 수준의 기능을 하나의 거래 전략에 결합하여 모든 종류의 트레이더에 대한 다재다능한 선택지가되었습니다. 인트라데이 거래 및 스캘핑 전략 : 빠르고 정확한 일일
OrderFlux | MetaTrader 5용 풋프린트 오더플로우 버전 2.0 – 액티브 트레이더를 위한 실시간 Bid/Ask 시각화 OrderFlux는 MT5를 위한 풋프린트 및 오더플로우 지표입니다. 가격이 어디로 이동했는지뿐만 아니라, 그 움직임 내부에서 어떤 일이 발생하고 있는지(가격 수준별 Bid/Ask 거래량, 델타, 임밸런스, 거래량 분포)를 보여줍니다. 많은 차트가 캔들의 최종 결과만 보여줍니다. OrderFlux는 그곳에 도달하기까지의 과정을 보여줍니다. 이것이 바로 캔들 모양뿐만 아니라 시장 참여자들의 동향을 읽고자 할 때 정확히 도움이 되는 부분입니다. 라이브 차트에서 OrderFlux는 주로 다음 세 가지 질문에 답합니다: 현재 어디에서 공격적인 매수 또는 매도 압력이 시장에 진입하고 있는가? 어떤 가격 수준에서 거래량이 흡수되거나 거부되고 있는가? 현재의 움직임이 세션 컨텍스트(배경)에 어떻게 부합하는가? 인터페이스에서 제공되는 기능 메인 차트는 Canvas
RelicusRoad Pro MT5
Relicus LLC
4.96 (24)
RelicusRoad Pro: 퀀트 시장 운영 체제 70% 할인 평생 이용권 (한정 시간) - 2,000명 이상의 트레이더와 함께하세요 왜 대부분의 트레이더는 "완벽한" 지표를 가지고도 실패할까요? 진공 상태에서 단일 개념 만으로 거래하기 때문입니다. 문맥 없는 신호는 도박입니다. 지속적인 승리를 위해서는 컨플루언스(중첩) 가 필요합니다. RelicusRoad Pro는 단순한 화살표 지표가 아닙니다. 완전한 퀀트 시장 생태계 입니다. 독점적인 변동성 모델링을 사용하여 가격이 이동하는 "공정 가치 로드"를 매핑하고, 단순 노이즈와 실제 구조적 돌파를 구분합니다. 추측은 그만두세요. 기관급 로드 로직으로 거래를 시작하세요. 핵심 엔진: "Road" 알고리즘 시스템의 중심에는 시장 상황에 실시간으로 적응하는 동적 변동성 채널인 Road Algo 가 있습니다. 세이프 라인(평형) 과 가격이 수학적으로 반전될 가능성이 높은 확장 레벨 을 투영합니다. Simple Road: 일반적인 시장을 위
Hydra Trend Rider is a non-repainting, multi-timeframe trend indicator that delivers precise buy/sell signals and real-time alerts for high-probability trade setups. With its color-coded trend line, customizable dashboard, and mobile notifications, it's perfect for traders seeking clarity, confidence, and consistency in trend trading. Setup & Guide:  Download  MT4 Version here. To learn how to use the Indicator: Indicator Manual & Guide -   Read Here Follow our MQL5 channel for daily market ins
Trend Lines PRO MT5
Roman Podpora
5 (1)
트렌드 라인즈 프로       이 지표는 시장이 실제로 어떤 방향으로 전환되는지 파악하는 데 도움이 됩니다. 실제 추세 반전 지점과 주요 시장 참여자들이 다시 진입하는 지점을 보여줍니다. 보시다시피       BOS 라인       복잡한 설정이나 불필요한 노이즈 없이 더 높은 시간대의 추세 변화와 주요 레벨을 확인할 수 있습니다. 신호는 차트에 다시 그려지지 않고 캔들이 마감된 후에도 계속 표시됩니다. MT4 버전   -   RFI LEVELS PRO   표시기   와 결합 시 최대 잠재력을 발휘합니다. 지표가 보여주는 내용: 실제 변화       추세(BOS 라인) 한 번 신호가 나타나면 그 신호는 계속 유효합니다! 이는 신호를 발생시킨 후 변경될 수 있는 리페인팅 방식의 지표와 중요한 차이점입니다. 리페인팅 방식의 지표는 잠재적으로 자금 손실로 이어질 수 있습니다. 이제 더욱 높은 확률과 정확도로 시장에 진입할 수 있습니다. 또한 화살표가 나타난 후 목표가(익절)에 도달하거나
제작자의 제품 더 보기
ZigZag Lines MTF
Taras Slobodyanik
4.38 (13)
Multi timeframe ZigZag indicator. It displays the support/resistance horizontal lines and their breakouts, as well as draws the current targets of the market. It can also display lines of the Fractals indicator and candles from other periods (up to Quarterly). So, you can actually see the supply and demand levels. Indicator – connects key lows and highs to show trend lines. You can also use it as indicator for the Break of Structure(BOS) & Market Structure Shift(MSS). The indicator redraws the
ZigZag Lines MTF for MT5
Taras Slobodyanik
5 (11)
Multi timeframe ZigZag indicator. It displays the support/resistance horizontal lines and their breakouts, as well as draws the current targets of the market. It can also display lines of the Fractals indicator and candles from other periods (up to Quarterly). So, you can actually see the supply and demand levels. Indicator – connects key lows and highs to show trend lines. You can also use it as indicator for the Break of Structure(BOS) & Market Structure Shift(MSS). The indicator redraws the
ZigZag Dashboard for MT5
Taras Slobodyanik
5 (4)
Multicurrency and multitimeframe modification of the ZigZag indicator. Displays the current direction of the market, the height of the last movement, the number of bars in this movement and the breaking of the previous point of the ZigZag (horizontal line). This is MTF Scanner, you can actually see the supply and demand levels. You can specify any desired currencies and timeframes in the parameters. Also, the panel can send notifications when the ZigZag changes direction or when there was a br
The indicator has three main tools: Magnifier (Zoom chart), Ruler  ( Time and Price scales ),   and Crosshair. You can move it all around with your mouse and customize different formats for  displaying , customize   size and color of each element. The Magnifier (zoom chart) allows you to display candles from any time frame and at different scales. Hotkeys: 'Q' - higher timeframe, 'A' - lower timeframe, 'W' - decrease candle size, 'S' - increase candle size, 'Z' - show/hide zoom chart. You can
MACD Dashboard
Taras Slobodyanik
5 (2)
Multi-currency and multi-timeframe indicator MACD. The dashboard can display both the Traditional (true) MACD and the MACD which is built into MetaTrader. On the panel you can see the current state of the indicator — the direction of movement of the MACD lines, their intersection and a pop-up window with the indicator chart. In the parameters you can specify any desired pairs-symbols and timeframes. The scanner can also send notifications about lines crossing each other and about lines crossing
Time Scale for MT5
Taras Slobodyanik
4.77 (30)
The indicator draws the time scale on the chart. You can specify the time offset, adjust the size and font to display on the chart ( it is displaying your local time on your chart instead of MT time ). You can also select the desired format for displaying the date and time. You may be interested in my other product , which contains a more advanced version of the Time Scale . You can also find my other products here . Parameters Hours (time shift) — time shift (hours); Minutes (time shift) — tim
FREE
Heikin Ashi Dashboard MT5
Taras Slobodyanik
5 (4)
Multi-currency and multitimeframe Heikin Ashi indicator. Shows the current state of the market. On the scanner panel you can see the direction, strength and number of bars of the current trend. The Consolidation/Reversal candles are also shown using color. You can specify any desired currencies and periods in the parameters. Also, the indicator can send notifications when the trend changes or when reversal and consolidation candles (dojis) appear. By clicking on a cell, this symbol and period wi
Lines Profit Loss MT5
Taras Slobodyanik
4.62 (13)
표시기는 현재 기호에 이익(손실)을 표시합니다. 라인을 자유롭게 드래그 앤 드롭하여 현재 손익을 표시할 수 있습니다. You can find my products   here . 매개변수 Calculation in money or in points — 포인트나 돈으로 이익/손실을 계산합니다. Add pending orders to calculate — 계산 시 지정가 주문을 고려하세요. Magic Number (0 - all orders on symbol) — 기호의 모든 주문) — 특정 주문을 평가하는 데 필요한 경우 매직 넘버입니다. Offset for first drawing (points from the average price) — 첫 번째 시작 시 평균 가격의 라인 오프셋입니다. Decimal places for calculating the Sum — 합계를 표시하기 위한 소수점 뒤의 자릿수입니다. Decimal places for calculating the Pe
FREE
CCI Dashboard for MT5
Taras Slobodyanik
5 (1)
Multicurrency and multitimeframe modification of the Commodity Channel Index (CCI) indicator. You can specify any desired currencies and timeframes in the parameters. Also, the panel can send notifications when crossing overbought and oversold levels. By clicking on a cell with a period, this symbol and period will be opened. This is MTF Scanner. The key to hide the dashboard from the chart is "D" by default. Parameters CCI Period  — averaging period. CCI Applied price  — price type. Clear th
Symbol Manager for MT5
Taras Slobodyanik
5 (3)
Symbol Manager or Grid Manager, designed to group orders into one position (by Symbol or by Magic Number). This utility will be useful to multi-currency traders (many EAs), who can have multiple orders on several pairs. You will be able to see the total number of lots, the total profit, and set virtual stop loss and virtual take profit. To set a real TP (or SL), you must first set the virtual value, and then enter the command in this cell: "set". If you want to set real TP/SL for all orders at
Symbol Manager
Taras Slobodyanik
5 (4)
Symbol Manager or Grid Manager, designed to group orders into one position (by Symbol or by Magic Number). This utility will be useful to multi-currency traders (many EAs), who can have multiple orders on several pairs. You will be able to see the total number of lots, the total profit, and set virtual stop loss and virtual take profit. To set a real TP (or SL), you must first set the virtual value, and then enter the command in this cell: "set". If you want to set real TP/SL for all orders at
RSI(상대강도지수) 지표의 다중 통화 및 다중 시간대 수정. 매개변수에서 원하는 통화와 기간을 지정할 수 있습니다. 또한 패널은 과매수 및 과매도 수준을 넘을 때 알림을 보낼 수 있습니다. 마침표가 있는 셀을 클릭하면 해당 기호와 마침표가 열립니다. MTF 스캐너입니다. 차트에서 대시보드를 숨기는 키는 기본적으로 "D"입니다. 통화 강도 측정기(CSM)와 마찬가지로 대시보드는 지정된 통화가 포함된 쌍 또는 해당 통화가 기본 통화로 포함된 쌍을 자동으로 선택할 수 있습니다. 표시기는 "쌍 집합"에 지정된 모든 쌍에서 통화를 검색합니다. 다른 쌍은 무시됩니다. 그리고 이 쌍을 기반으로 이 통화의 총 RSI가 계산됩니다. 그리고 그 통화가 얼마나 강하거나 약한지 알 수 있습니다. 매개변수 RSI Period — 평균 기간. RSI Applied price — 가격 유형. Clear the chart at startup — 시작 시 차트를 지웁니다 Set of Pairs — 기
ADX Dashboard MT5
Taras Slobodyanik
5 (4)
ADX 지표는 추세와 강도를 결정하는 데 사용됩니다. 가격의 방향은 +DI와 -DI 값으로 표시되며, ADX 값은 추세의 강도를 나타냅니다. +DI가 -DI보다 높으면 시장은 상승 추세에 있고, 반대로이면 하락 추세에 있습니다. ADX가 20 미만이면 명확한 방향이 없습니다. 지표가 이 수준을 돌파하자마자 중간 강도의 추세가 시작됩니다. 40보다 큰 값은 강한 추세(하락 추세 또는 상승 추세)를 나타냅니다. 평균 방향 이동 지수(ADX) 지표의 다중 통화 및 다중 시간대 수정. 매개변수에서 원하는 통화와 기간을 지정할 수 있습니다. 또한 지표는 추세 강도 수준이 교차할 때, 그리고 +DI 및 -DI 선이 교차할 때 알림을 보낼 수 있습니다. 마침표가 있는 셀을 클릭하면 해당 기호와 마침표가 열립니다. MTF 스캐너입니다. 통화 강도 측정기(CSM)와 마찬가지로 대시보드는 지정된 통화가 포함된 쌍 또는 해당 통화가 기본 통화로 포함된 쌍을 자동으로 선택할 수 있습니다. 표시기는
Dashboard RSI Multicurrency
Taras Slobodyanik
5 (6)
RSI(상대강도지수) 지표의 다중 통화 및 다중 시간대 수정. 매개변수에서 원하는 통화와 기간을 지정할 수 있습니다. 또한 패널은 과매수 및 과매도 수준을 넘을 때 알림을 보낼 수 있습니다. 마침표가 있는 셀을 클릭하면 해당 기호와 마침표가 열립니다. MTF 스캐너입니다. 차트에서 대시보드를 숨기는 키는 기본적으로 "D"입니다.      통화 강도 측정기(CSM)와 마찬가지로 대시보드는 지정된 통화가 포함된 쌍 또는 해당 통화가 기본 통화로 포함된 쌍을 자동으로 선택할 수 있습니다. 표시기는 "쌍 집합"에 지정된 모든 쌍에서 통화를 검색합니다. 다른 쌍은 무시됩니다. 그리고 이 쌍을 기반으로 이 통화의 총 RSI가 계산됩니다. 그리고 그 통화가 얼마나 강하거나 약한지 알 수 있습니다. 매개변수 RSI Period — 평균 기간. RSI Applied price — 가격 유형. Clear the chart at startup — 시작 시 차트를 지웁니다 Set of Pair
Stochastic Oscillator의 다중 통화 및 다중 시간 프레임 수정. 매개변수에서 원하는 통화와 기간을 지정할 수 있습니다. 패널에는 신호 및 기본(확률적 교차) 선의 현재 값과 교차점이 표시됩니다. 또한 지표는 과매수 및 과매도 수준을 넘을 때 알림을 보낼 수 있습니다. 마침표가 있는 셀을 클릭하면 해당 기호와 마침표가 열립니다. MTF 스캐너입니다. 통화 강도 측정기(CSM)와 마찬가지로 대시보드는 지정된 통화가 포함된 쌍 또는 해당 통화가 기본 통화로 포함된 쌍을 자동으로 선택할 수 있습니다. 표시기는 "쌍 집합"에 지정된 모든 쌍에서 통화를 검색합니다. 다른 쌍은 무시됩니다. 그리고 이 쌍을 기반으로 이 통화에 대한 총 확률론적 금액이 계산됩니다. 그리고 그 통화가 얼마나 강하거나 약한지 알 수 있습니다. 차트에서 대시보드를 숨기는 키는 기본적으로 "D"입니다. 매개변수 %K Period — K 라인의 기간입니다. %D Period — D 라인의 기간입니다
Fibo Candle Previous for MT5
Taras Slobodyanik
5 (2)
이 지표는 지그재그 지표, 거래 세션, 프랙탈 또는 양초(비표준 기간 포함: 연도, 6개월, 4개월, 3개월, 2개월)(자동 Fibo 되돌림)를 기반으로 피보나치 레벨을 자동으로 그립니다. 피보나치 계산을 위해 더 높은 기간을 선택할 수 있습니다. 현재 막대가 닫힐 때마다 레벨이 다시 그려집니다. 지정된 수준을 넘을 때 경고를 활성화하는 것이 가능합니다. 기록의 수준을 분석할 수도 있습니다. 이를 위해서는 "과거 Fibo 수" 매개변수에서 Fibo 수준 수를 지정해야 합니다. 매개변수 Calculate Fibo according to — 피보나치 계산 모드: Candles (High-Low) — 고저를 기반으로 Fibo를 구축합니다. Candles (Close-Close) — 닫기-닫기를 기반으로 Fibo를 구축합니다. ZigZags — ZigZag 포인트로 fibo를 구축합니다. Sessions — 거래 세션을 통해 fibo를 구축합니다. Fractals — 프랙탈 포인트
MACD Dashboard MT5
Taras Slobodyanik
5 (2)
Multi-currency and multi-timeframe indicator MACD. The dashboard can display both the Traditional (true) MACD and the MACD which is built into MetaTrader. On the panel you can see the current state of the indicator — the direction of movement of the MACD lines, their intersection and a pop-up window with the indicator chart. In the parameters you can specify any desired pairs-symbols and timeframes. The scanner can also send notifications about lines crossing each other and about lines crossing
Lines Profit Loss
Taras Slobodyanik
4.65 (17)
표시기는 현재 기호에 이익(손실)을 표시합니다. 라인을 자유롭게 드래그 앤 드롭하여 현재 손익을 표시할 수 있습니다. You can find my products   here . 매개변수 Calculation in money or in points — 포인트나 돈으로 이익/손실을 계산합니다. Add pending orders to calculate — 계산 시 지정가 주문을 고려하세요. Magic Number (0 - all orders on symbol) — 기호의 모든 주문) — 특정 주문을 평가하는 데 필요한 경우 매직 넘버입니다. Offset for first drawing (points from the average price) — 첫 번째 시작 시 평균 가격의 라인 오프셋입니다. Decimal places for calculating the Sum — 합계를 표시하기 위한 소수점 뒤의 자릿수입니다. Decimal places for calculating the Pe
FREE
Pro Sessions MT4
Taras Slobodyanik
4.75 (4)
This is an indicator of trading sessions  that can display all levels (Open-High-Low-Close) for four sessions. The indicator can also predict session levels. Sessions can be drawn with lines or rectangles (empty or filled), lines can be extended to the next session. You can easily hide/show each session by pressing hotkeys (by default '1', '2', '3', '4'). You can see ASR (Average Session Range) lines  (default hotkey 'A'). This is similar to the ADR calculation, only it is calculated based on t
Time Scale
Taras Slobodyanik
4.87 (15)
The indicator draws the time scale on the chart. You can specify the time offset, adjust the size and font to display on the chart (it is displaying your local time on your chart instead of MT time). You can also select the desired format for displaying the date and time. While holding down the middle mouse button, and moving the cursor, a slider will appear on the scale. You may be interested in my other product , which contains a more advanced version of the Time Scale. You can also find my o
FREE
Inside Bar Dashboard for MT5
Taras Slobodyanik
5 (5)
Multicurrency and multi-timeframe indicator Inside Bar (IB). In the parameters, you can specify any desired currencies and timeframes. The panel displays the last found Inside Bar (and Mother Bar) pattern, the current price position and the breakout of the levels of the Mother and Inside Bars. You can set the size and color for bars and text in the cells. The indicator can also send notifications when levels are broken. The dashboard highlights Double Inside Bar in a special color. By clicking
Levels of Timeframes
Taras Slobodyanik
5 (2)
표시기는 기타(및 비표준) 기간(연도, 6개월, 4개월, 3개월, 2개월, 월, 주, 일, H3-H6-H8-H12 시간)의 고가/저/시가/종가 수준을 표시합니다. . 양초를 여는 교대근무를 설정하고 가상 양초를 만들 수도 있습니다. 이러한 기간 중 하나에 대한 '기간 구분 기호'는 수직선 형태로 제공됩니다. 현재 또는 이전 수준의 돌파에 대해 경고를 구성할 수 있습니다(어제/지난주 라인의 고/저 돌파 등). 모든 수준을 한 기간씩 오른쪽으로 이동할 수도 있습니다. 즉, 이전 기간의 고가/저가가 현재 기간에 표시됩니다. 매개변수 Number of levels to calculate (0-all) — 화면에 표시되는 막대 수입니다. Change the opening of bars (hours) — 캔들의 오프닝을 n시간만큼 이동합니다. 표시기는 새로운 개장 시간을 고려하여 가상 막대를 그립니다. MN1 이상의 기간은 변경되지 않습니다. Move the levels to the r
Stochastic Oscillator의 다중 통화 및 다중 시간 프레임 수정. 매개변수에서 원하는 통화와 기간을 지정할 수 있습니다. 패널에는 신호 및 기본(확률적 교차) 선의 현재 값과 교차점이 표시됩니다. 또한 지표는 과매수 및 과매도 수준을 넘을 때 알림을 보낼 수 있습니다. 마침표가 있는 셀을 클릭하면 해당 기호와 마침표가 열립니다. MTF 스캐너입니다. 통화 강도 측정기(CSM)와 마찬가지로 대시보드는 지정된 통화가 포함된 쌍 또는 해당 통화가 기본 통화로 포함된 쌍을 자동으로 선택할 수 있습니다. 표시기는 "쌍 집합"에 지정된 모든 쌍에서 통화를 검색합니다. 다른 쌍은 무시됩니다. 그리고 이 쌍을 기반으로 이 통화에 대한 총 확률론적 금액이 계산됩니다. 그리고 그 통화가 얼마나 강하거나 약한지 알 수 있습니다. 차트에서 대시보드를 숨기는 키는 기본적으로 "D"입니다. 매개변수 %K Period — K 라인의 기간입니다. %D Period — D 라인의 기간입니다
The indicator has three main tools: Magnifier (Zoom chart), Ruler  ( Time and Price scales ),   and Crosshair. You can move it all around with your mouse and customize different formats for  displaying , customize   size and color of each element. The Magnifier (zoom chart) allows you to display candles from any time frame and at different scales. Hotkeys: 'Q' - higher timeframe, 'A' - lower timeframe, 'W' - decrease candle size, 'S' - increase candle size, 'Z' - show/hide zoom chart You can
Levels of Timeframes for MT5
Taras Slobodyanik
5 (1)
표시기는 기타(및 비표준) 기간(연도, 6개월, 4개월, 3개월, 2개월, 월, 주, 일, H3-H6-H8-H12 시간)의 고가/저/시가/종가 수준을 표시합니다. . 양초를 여는 교대근무를 설정하고 가상 양초를 만들 수도 있습니다. 이러한 기간 중 하나에 대한 '기간 구분 기호'는 수직선 형태로 제공됩니다. 현재 또는 이전 수준의 돌파에 대해 경고를 구성할 수 있습니다(어제/지난주 라인의 고/저 돌파 등). 모든 수준을 한 기간씩 오른쪽으로 이동할 수도 있습니다. 즉, 이전 기간의 고가/저가가 현재 기간에 표시됩니다. 매개변수 Number of levels to calculate (0-all) — 화면에 표시되는 막대 수입니다. Change the opening of bars (hours) — 캔들의 오프닝을 n시간만큼 이동합니다. 표시기는 새로운 개장 시간을 고려하여 가상 막대를 그립니다. MN1 이상의 기간은 변경되지 않습니다. Move the levels to the r
Pro Sessions MT5
Taras Slobodyanik
5 (1)
This is an indicator of trading sessions  that can display all levels (Open-High-Low-Close) for four sessions . The indicator can also predict session levels. Sessions can be drawn with lines or rectangles (empty or filled), lines can be extended to the next session. You can easily hide/show each session by pressing hotkeys (by default '1', '2', '3', '4'). You can see ASR (Average Session Range) lines  (default hotkey 'A'). This is similar to the ADR calculation, only it is calculated based on
MTF RSI for MT5
Taras Slobodyanik
Multi-timeframe indicator Relative Strength Index displays information simultaneously from different periods in one subwindow of the chart. Parameters Period of averaging — averaging period for the RSI calculation. Type of price — price used. Timeframes for RSI — list of periods, separated by a space or comma or semicolon. Number of bars for each period — the number of bars displayed for each period. Sort periods — sort periods if they are listed in no particular order. Current period first — d
Stochastic Oscillator displays information simultaneously from different periods in one subwindow of the chart. Parameters %K Period — K-period (number of bars for calculations). %D Period — D-period (period of first smoothing). Slowing — final smoothing. Method — type of smoothing. Price field — stochastic calculation method . Timeframes for Stochastic — list of periods, separated by a space or comma or semicolon. Number of bars for each period — the number of bars displayed for each period. S
This is the famous FX Sniper's T3 CCI indicator. It is a fixed version additionally containing search for classical and reverse (hidden) divergence. The classical divergence is displayed as a solid line, the reverse divergence is shown as a dotted line. Divergences are drawn in the indicator and on the chart (if you select the appropriate options). Parameters CCI Period — Commodity Channel Index indicator period CCI Type of price — price used for indicator calculation T3 Period — Sniper period
Angle High Low MT5
Taras Slobodyanik
The indicator calculates the inclination angle between the Highs, Lows and Closes of adjacent bars. The angle can be measured in degrees or radians. A linear graph or a histogram is drawn in a subwindow. You can set the scale for the calculation — floating or fixed. For use in Expert Advisors or indicators, you need to specify a fixed scale. Parameters Angular measure — degrees or radians. Scale mode for calculation — scaling mode. Free scale — free transformation, the indicator will calculate
FREE
필터:
thomas
1409
thomas 2023.11.28 19:12 
 

I bought this indicator a few days ago and I can say it is really very use- and helpful !! As A. Forex already told it would be a good idea to integrate the MT5-standard indicators "Double Exponential Moving Average" and "Triple Exponential Moving Average" to this wonderful tool. To me I am using this both indicators constantly.

IK°L
824
IK°L 2023.11.27 20:50 
 

A great tool, an MA Multicurrency dashboard is essential, it has all kinds of alerts for different setups, it is very easy to read the information on the dashboard, it runs very fluid and without problems. It is a damn delight to explore the markets with these dashboards, I love the little popup window and the extraordinary attention that the developer always provides.

A. Forex
269
A. Forex 2023.10.12 14:57 
 

Great dashboard. Please add DEMA (Double EMA) into the range of MA. WOULD be super. Thank you. Спасибо!

Taras Slobodyanik
95724
개발자의 답변 Taras Slobodyanik 2023.10.12 15:17
Hello. It's not clear what you're talking about, what range? What is Double EMA? You can set both MAs to EMA.
nolimitzfx
148
nolimitzfx 2022.05.19 23:47 
 

If you use ma's for your trading/ analysis this is a must have! Works as indicated, clean, great user interface. Makes my charting analysis much faster then scrolling through ea chart individually. Highly recommend. Guys/ gals keep in mind this is not some holy grail. If you don't currently understand how to use ma's correctly then this won't be of much use to you. This will however be a godsend to those who already have a method/ system that utilizes ma's and are just looking for a tool that will aid in the whole process.

리뷰 답변