MA Dashboard MT5

5
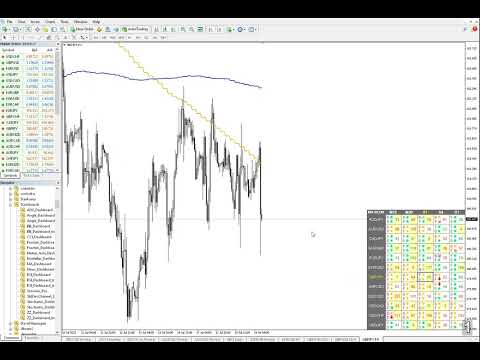
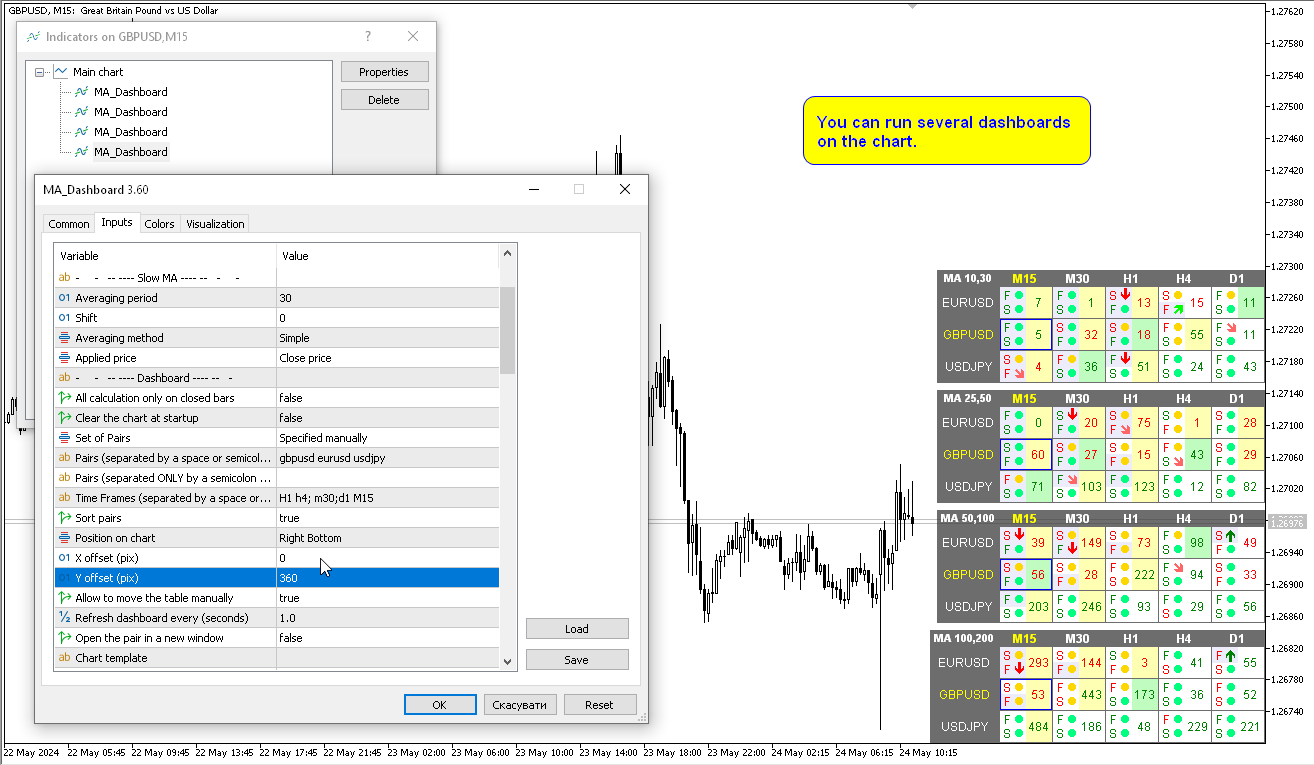
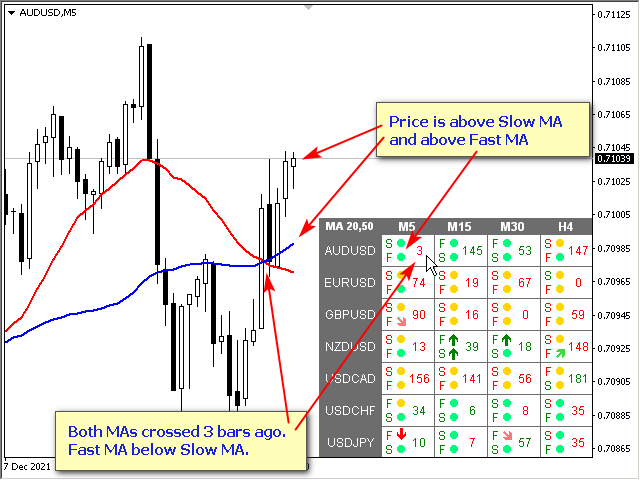
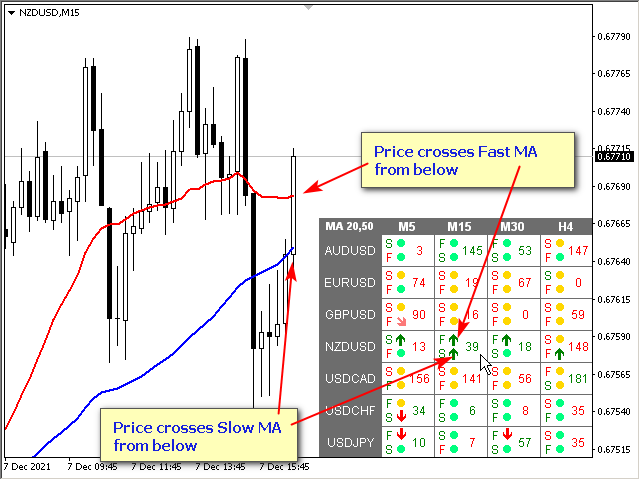
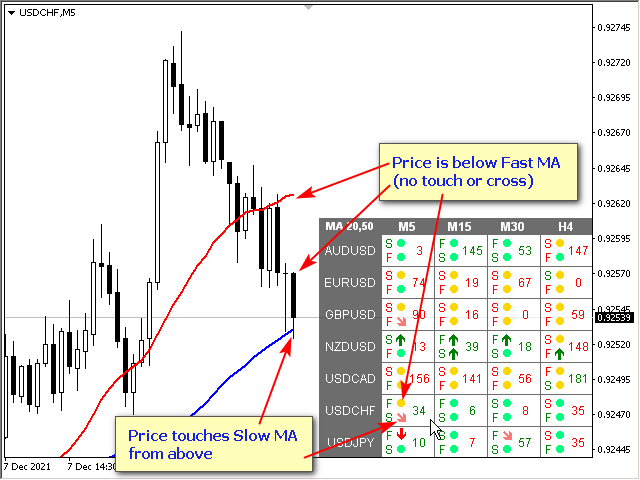
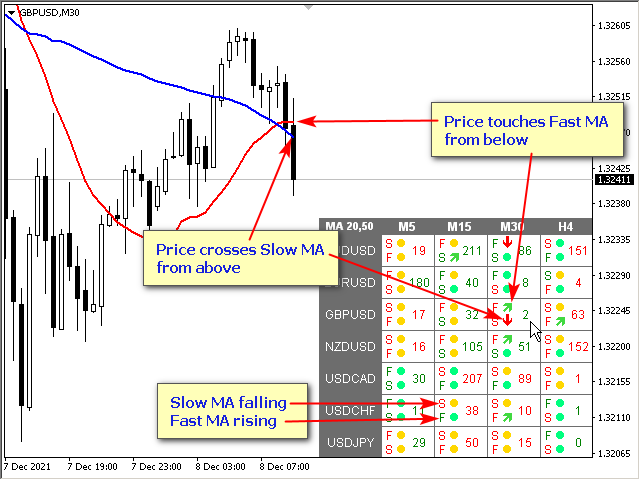
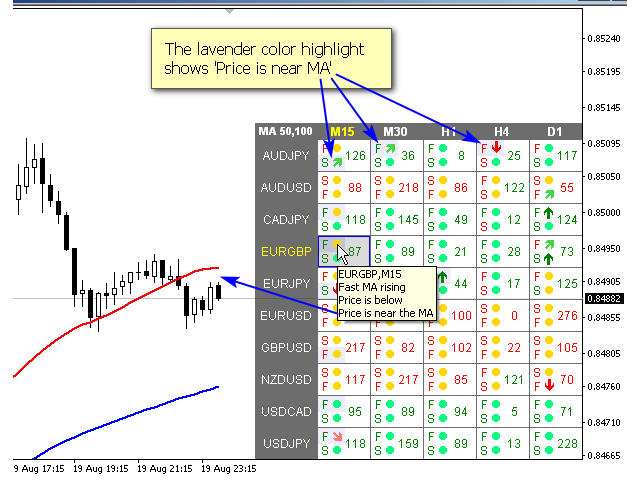
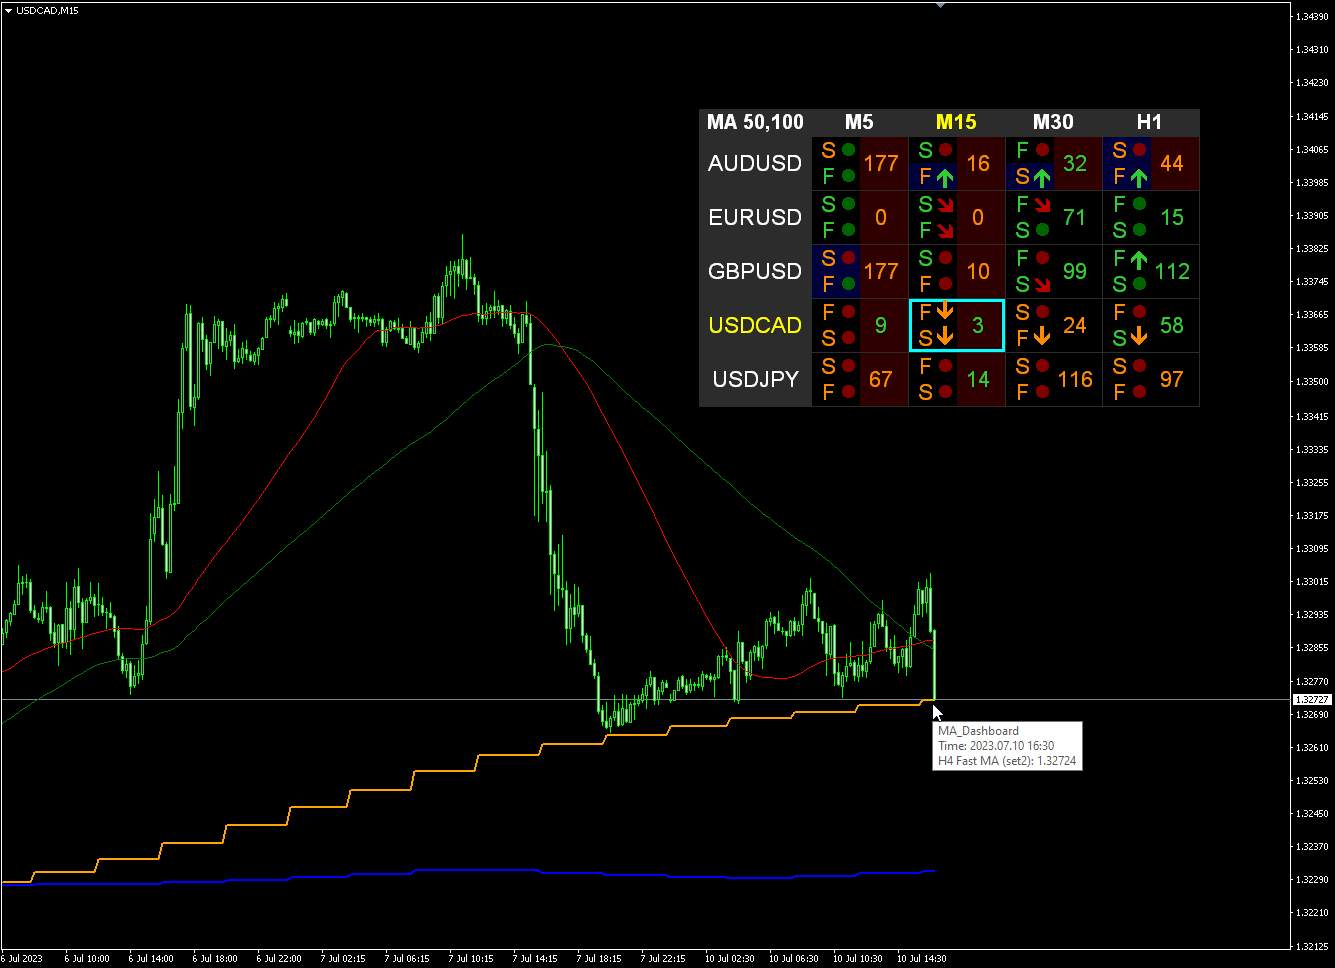
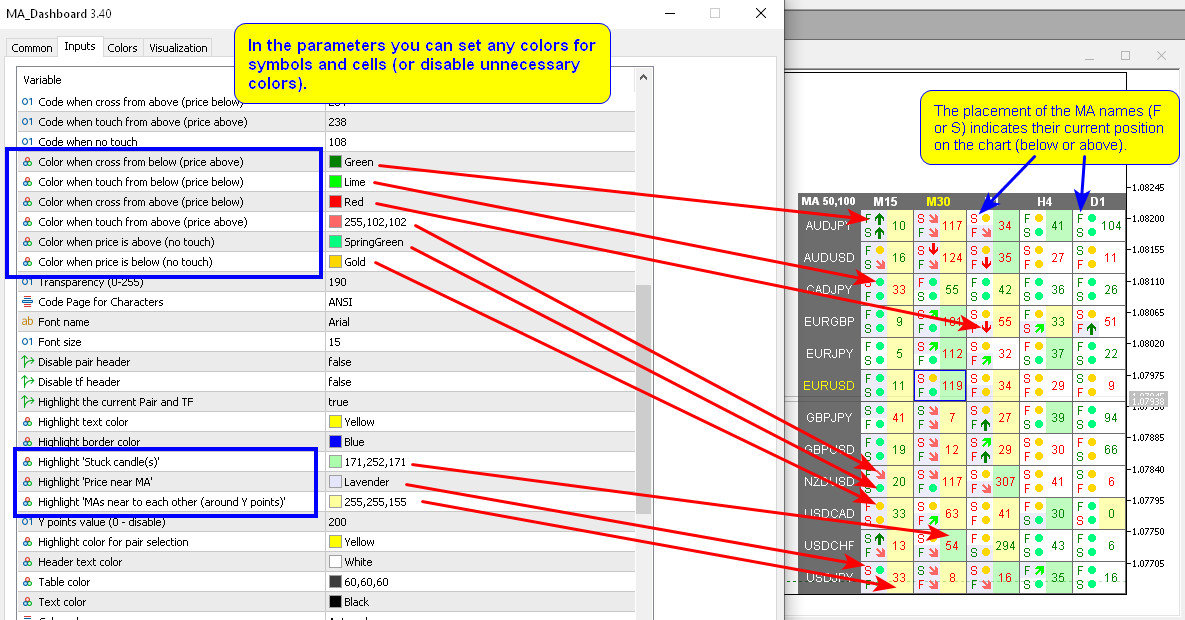
Modifica multivaluta e multitimeframe dell'indicatore Moving Average (MA). Sulla dashboard puoi vedere lo stato attuale dell'indicatore: breakout e tocchi (per prezzo) della MA veloce e della MA lenta, nonché l'intersezione delle linee MA tra loro (crossover della media mobile). Nei parametri è possibile specificare le valute e i tempi desiderati. Inoltre, l'indicatore può inviare notifiche sul prezzo che tocca le linee e sul loro attraversamento. Cliccando su una cella con un punto, questo simbolo e punto verranno aperti. Questo è lo scanner MTF. È possibile eseguire diversi dashboard sul grafico.

L'indicatore visualizza le linee MA veloce e MA lenta sul grafico corrente. È possibile selezionare l'intervallo temporale MA per il grafico e guardare MA da altri intervalli temporali (MTF MA). I tasti di scelta rapida per i due set di MA sono "1" e "2" per impostazione predefinita.

La chiave per nascondere la dashboard dal grafico è "D" per impostazione predefinita


Parametri

Fast MA
Averaging period — Periodo di media.
Shift — Spostare.
Averaging method — Metodo della media.
Applied price — Prezzo applicato.

Slow MA
Averaging period — Periodo di media.
Shift — Spostare.
Averaging method — Metodo della media.
Applied price — Prezzo applicato.

Dashboard
All calculation only on closed bar — Tutti i calcoli solo a barra chiusa.
Clear the chart at startup — cancella il grafico all'avvio.
Set of Pairs — Set di coppie
— Market Watch — Coppie da "Market Watch" del MT.
— Specified manually — coppie specificate manualmente, nei parametri "Coppie".
— Current pair — mostra solo la coppia attuale.
Pairs (separated by a space or semicolon) — elenco di simboli separati da spazi o punto e virgola. I nomi delle valute dovrebbero essere scritti esattamente come quelli del broker, mantenendo maiuscole e minuscole e prefisso/suffisso.
Time Frames (separated by a space or semicolon) — elenco di intervalli temporali separati da spazi o punti e virgola (intervallo temporale multiplo).
Sort pairs — ordina l'elenco delle coppie.
Position on chart — angolo per visualizzare il pannello sulla carta.
X offset (pix) — sposta il pannello lungo l'asse X;
Y offset (pix) — sposta il pannello lungo l'asse Y;
Refresh dashboard every (seconds) — periodo di aggiornamento per tutte le coppie e gli intervalli di tempo.
Open the pair in a new window — apri un simbolo in una nuova finestra del grafico facendo clic.
Chart template — il nome del modello per il grafico, se il grafico si apre in una nuova finestra.
Code when cross from below (price above) — Codice quando incrociato dal basso (prezzo sopra);
Code when touch from below (price below) — Codice quando toccato dal basso (prezzo inferiore);
Code when cross from above (price below) — Codice quando incrociato dall'alto (prezzo sotto);
Code when touch from above (price above) — Codice al tocco dall'alto (prezzo sopra);
Code when no touch — Codice quando non si tocca;
Transparency (0-255) — Trasparenza (0-255);
Font name — Nome del carattere;
Font size — Dimensione del font.

Avvisi
Timeframes for alerts (separated by a space or semicolon) — Intervalli temporali per gli avvisi (separati da uno spazio o un punto e virgola).
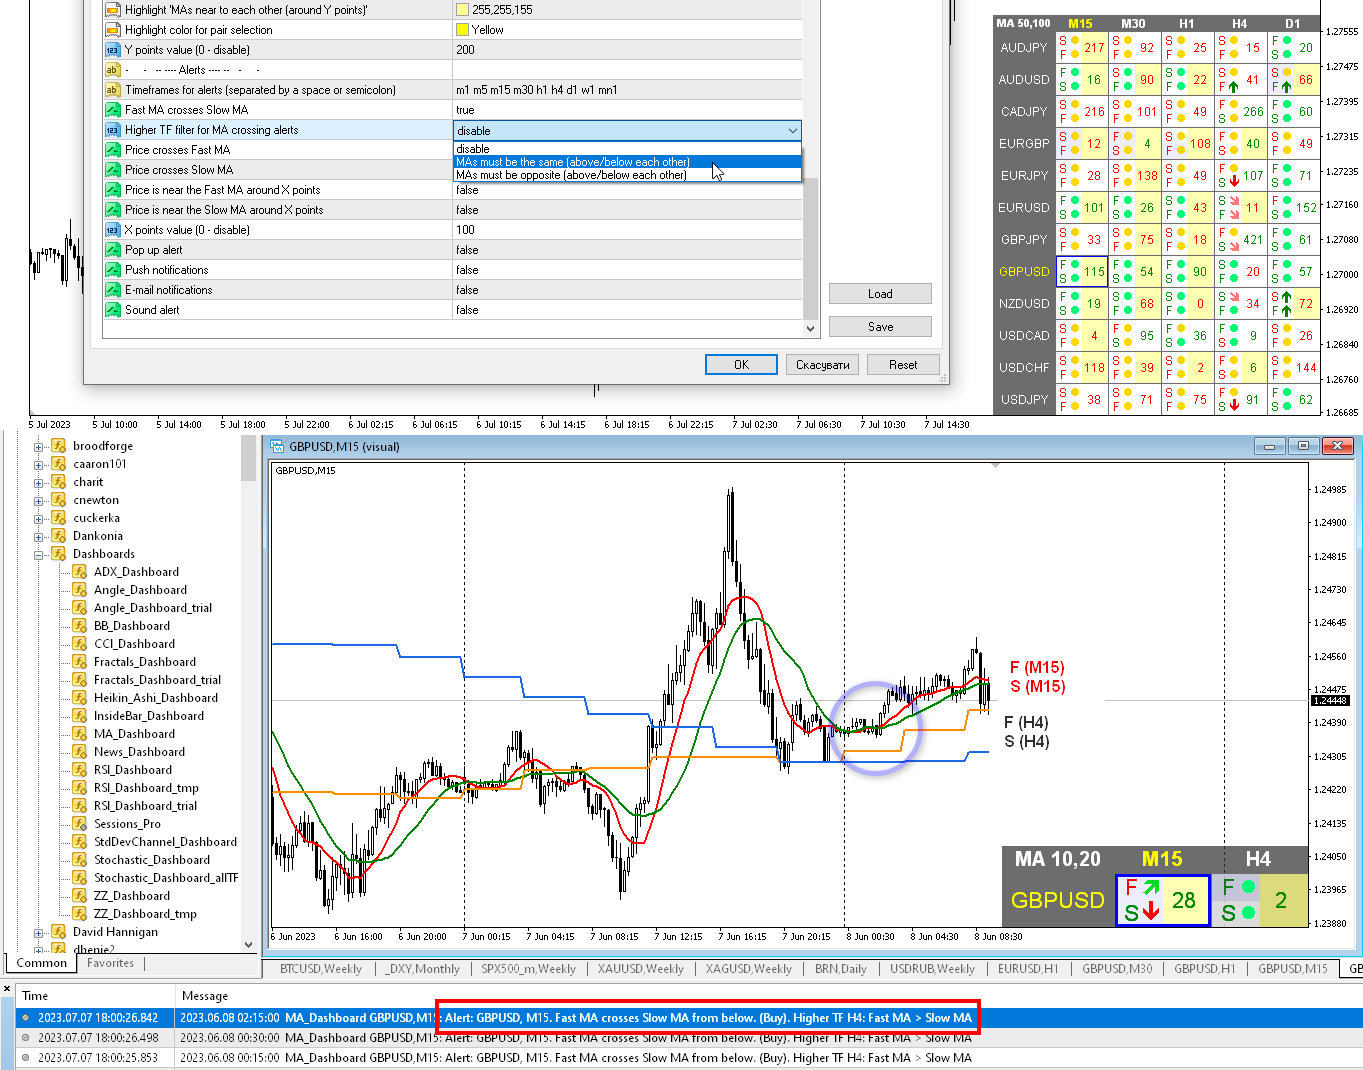
Fast MA crosses Slow MA — La MA veloce incrocia la MA lenta;
Higher TF filter for MA crossing alerts — quando il filtro è abilitato, quando le MA si incrociano, l'indicatore controllerà i valori MA dal successivo intervallo di tempo superiore (sulla dashboard). Se le MA dell'intervallo temporale superiore soddisfano le condizioni specificate, verrà inviato l'avviso di attraversamento MA, altrimenti non ci sarà alcun avviso.
  • disable — disattivare
  • MAs must be the same (above/below each other) — Gli MA devono essere uguali (sopra/sotto l'altro)
  • MAs must be opposite (above/below each other) — Gli MA devono essere opposti (uno sopra/sotto l'altro)
Price crosses Fast MA — Il prezzo attraversa Fast MA;
Price crosses Slow MA — Il prezzo attraversa la MA lenta;
Price is near the Fast MA around X points — Il prezzo è vicino alla MA veloce intorno a X punti
Price is near the Slow MA around X points — Il prezzo è vicino alla MA lenta attorno a X punti
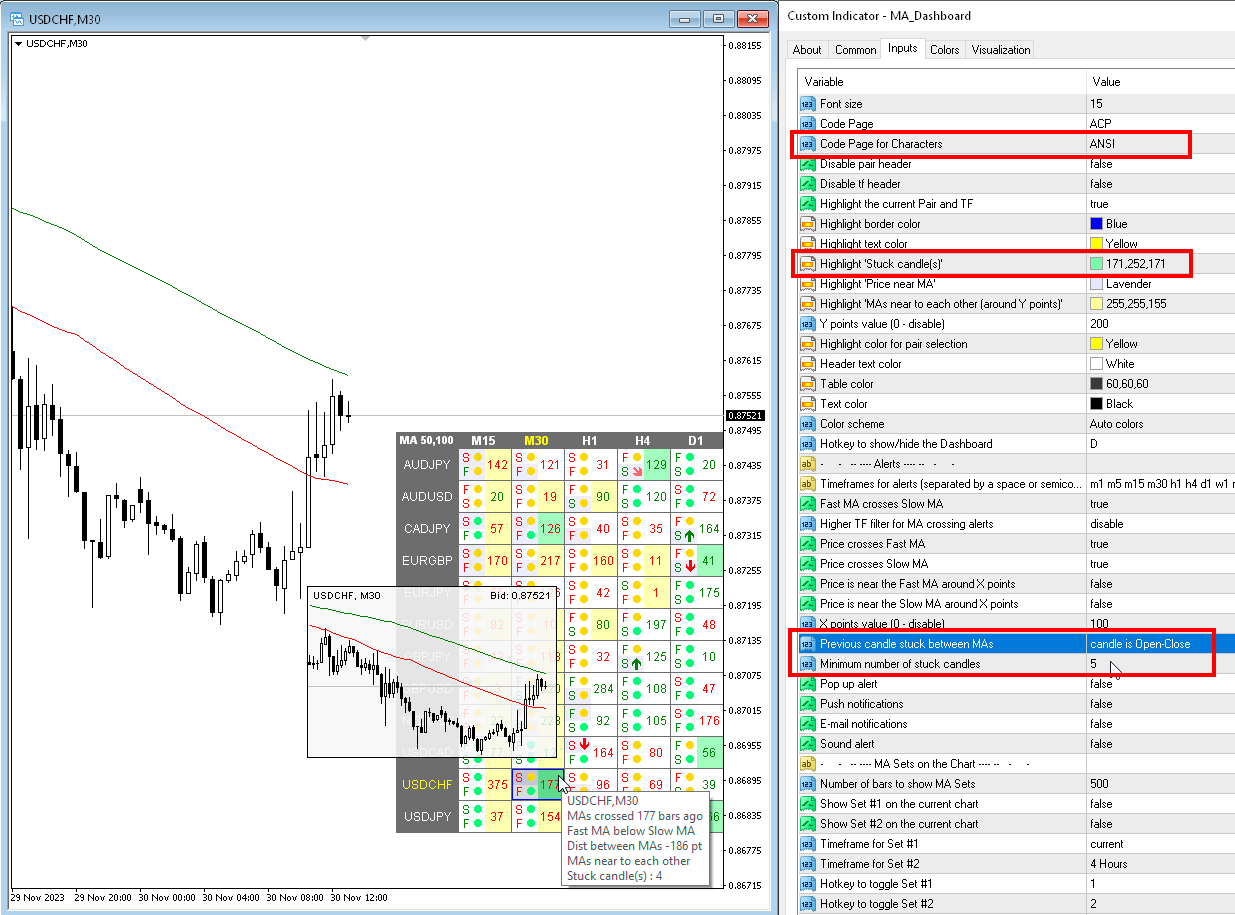
Previous candle stuck between MAs — Se le candele precedenti sono tra due MA, puoi ricevere un avviso a riguardo o vederlo nella tabella.

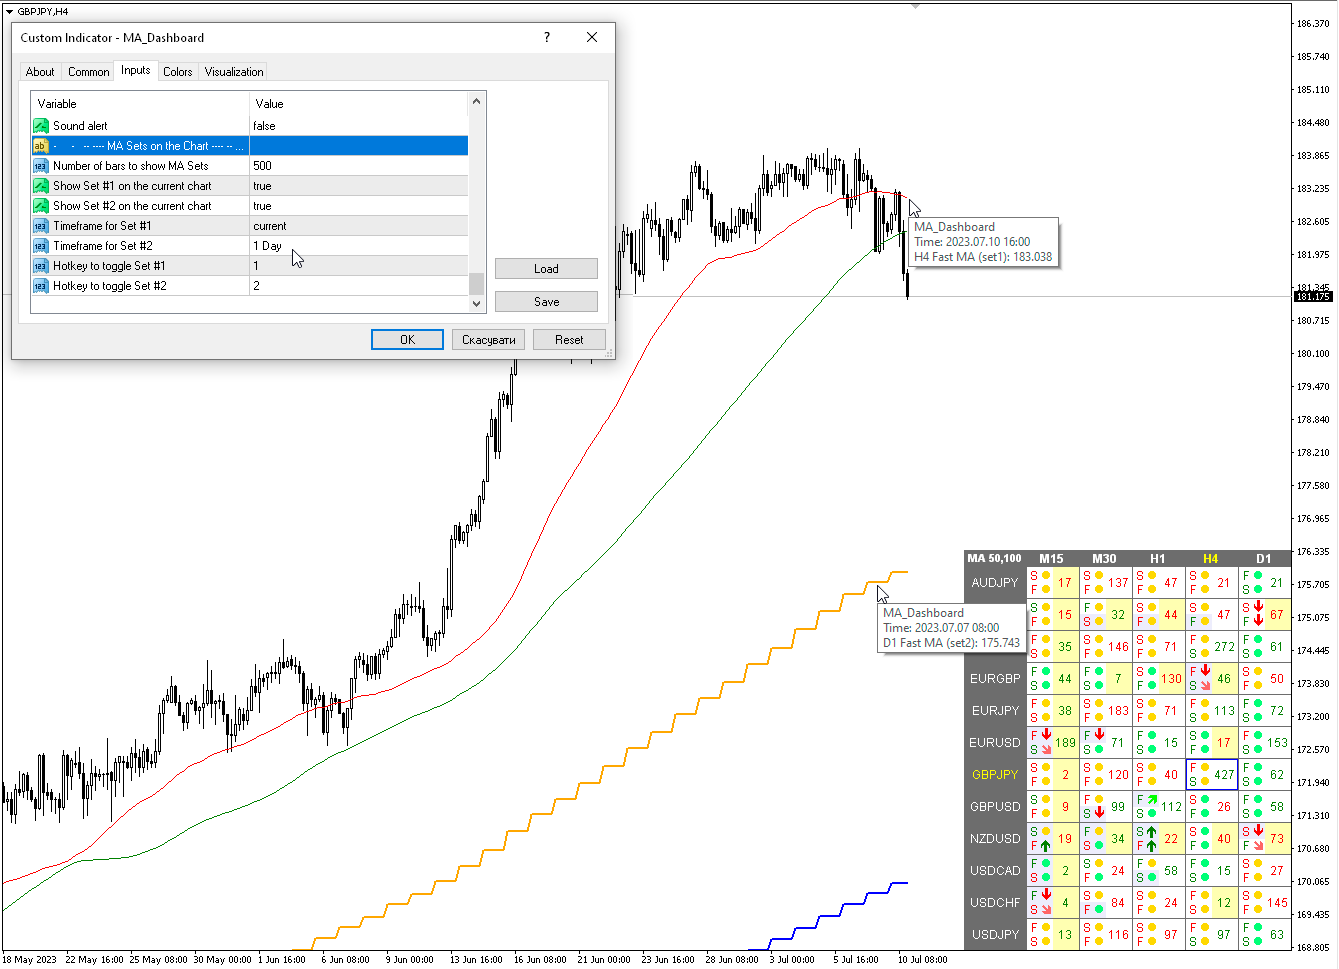
MA imposta sul grafico
Number of bars to show MA Sets — Numero di barre per mostrare i set MA
Show Set #1 on the current chart — Mostra il set n. 1 nel grafico corrente
Show Set #2 on the current chart — Mostra il set n. 2 sul grafico corrente
Timeframe for Set #1 — Tempistiche per il set n. 1
Timeframe for Set #2 — Tempistiche per il set n. 2
Hotkey to toggle Set #1 — Tasto di scelta rapida per attivare/disattivare il Set n.1
Hotkey to toggle Set #2 — Tasto di scelta rapida per attivare/disattivare il Set n.2
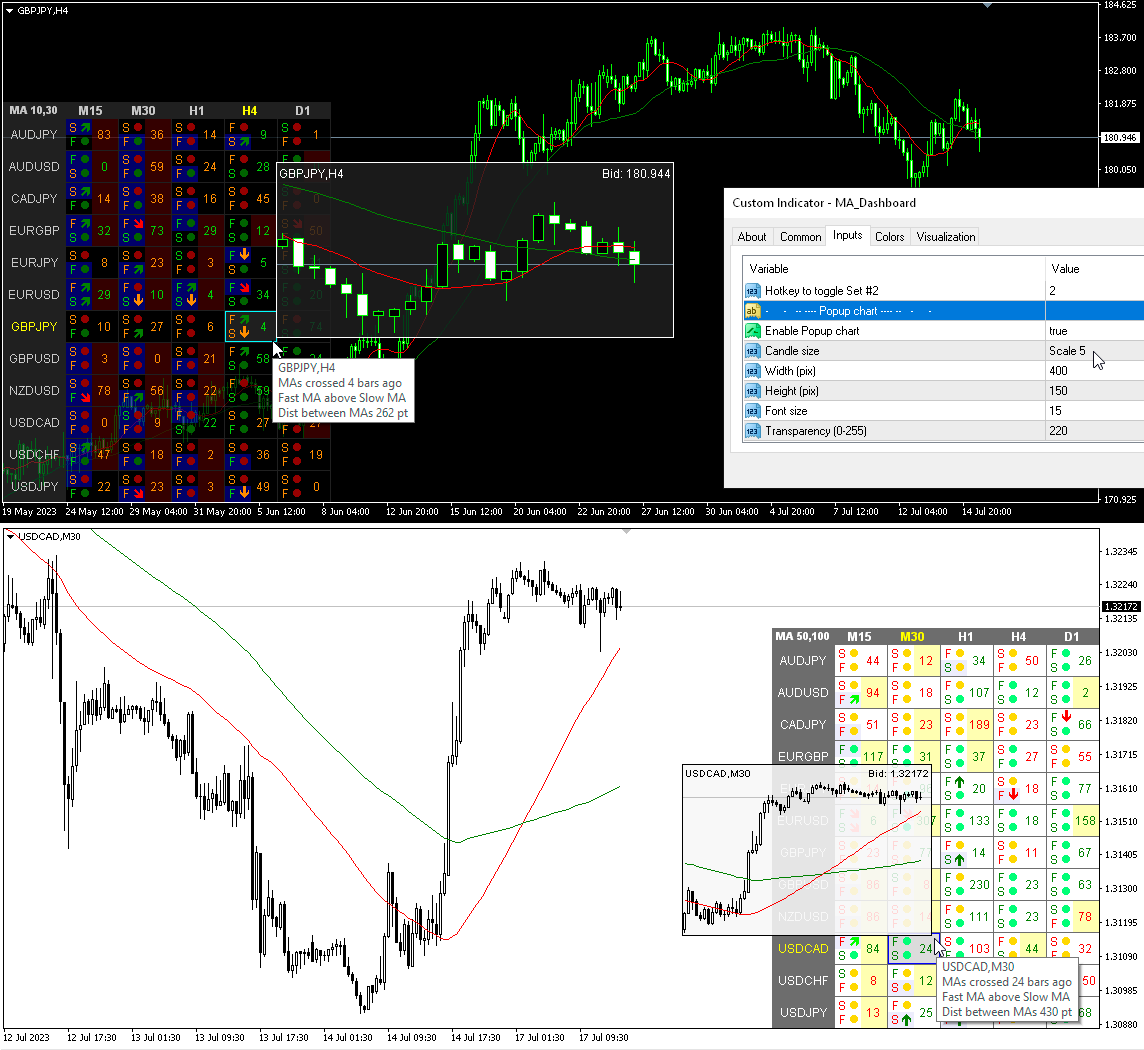
Grafico popup
Enable Popup chart — Abilita grafico popup
Candle size — Dimensione della candela
Width (pix) — Larghezza (pix)
Height (pix) — Altezza (pix)
Font size — Dimensione del font
Transparency (0-255) — Trasparenza (0-255)

Recensioni 4
thomas
1409
thomas 2023.11.28 19:12 
 

I bought this indicator a few days ago and I can say it is really very use- and helpful !! As A. Forex already told it would be a good idea to integrate the MT5-standard indicators "Double Exponential Moving Average" and "Triple Exponential Moving Average" to this wonderful tool. To me I am using this both indicators constantly.

IK°L
824
IK°L 2023.11.27 20:50 
 

A great tool, an MA Multicurrency dashboard is essential, it has all kinds of alerts for different setups, it is very easy to read the information on the dashboard, it runs very fluid and without problems. It is a damn delight to explore the markets with these dashboards, I love the little popup window and the extraordinary attention that the developer always provides.

A. Forex
269
A. Forex 2023.10.12 14:57 
 

Great dashboard. Please add DEMA (Double EMA) into the range of MA. WOULD be super. Thank you. Спасибо!

Prodotti consigliati
RBreaker
Zhong Long Wu
RBreaker Gold Indicators is a short-term intraday trading strategy for gold futures that combines trend following and intraday reversal approaches. It not only captures profits during trending markets but also enables timely profit-taking and counter-trend trading during market reversals. This strategy has been ranked among the top ten most profitable trading strategies by the American magazine   Futures Truth   for 15 consecutive years. It boasts a long lifecycle and remains widely used and st
Indicatore Crypto_Forex "CCI con zone di ipervenduto/ipercomprato dinamiche" per MT5, senza ridisegno. - Il Commodity Channel Index (CCI) è eccellente per il trading di momentum nella direzione del trend. - È ottimo per prendere posizioni di vendita dalla zona di ipercomprato dinamica e posizioni di acquisto dalla zona di ipervenduto dinamica nella direzione del trend principale. - Questo indicatore è eccellente anche da combinare con posizioni di price action. - Zona di ipercomprato dinamica -
STRICTLY FOR BOOM INDEX ONLY!!!!! Here I bring the Maximum Trend Arrows OT1.0 MT5 indicator. This indicator is made up of a combination of different trend indicators for entries and exits, for entries an orange arrow will paint on the chart below the current market and a red flag for closing of trades and it produces buy arrows only. When the orange arrow appears, it will appear along with it's sound to notify you. The 1H timeframe is recommended, don't use it anywhere else than on the 1H timefr
The Antique Trend Indicator is a revolutionary trend trading and filtering solution with all the important features of a trend tool built into one tool! The Antique Trend indicator is good for any trader, suitable for any trader both for Forex and binary options. There is no need to configure anything, everything has been perfected by time and experience, it works great during flats and trends. The Antique Trend indicator is a tool for technical analysis of financial markets, reflecting curren
Rapid Pulse Scalper
Muhammad Mustajab Bajwa Muhammad Ri
Rapid Pulse Scalper Fast Signals. Precise Entries. Smart H1 Scalping Control. Rapid Pulse Scalper is a professional MT5 scalping indicator designed for traders who want clean, fast, and filtered Buy/Sell signals on major forex pairs using the H1 timeframe . It uses a multi-confirmation signal system to help reduce market noise and focus on higher-quality trading opportunities. This indicator is built for disciplined traders who want simple chart signals, structured trade levels, and smart trade
Supertrend indicator uses a combination of a moving average and average true range to detect the trend of a trading instrument. Supertrend indicator for MetaTrader 5 easily shows the trend as a line following the price. Triple SuperTrend Histo indicator  calculate  three supertrends to show the trend as a histogram. Changing the color from red to green means you can BUY , from green to red means you can SELL . Description of the method of drawing a histogram. The price is above the EMA 200,
TCT BB PANEL - Bollinger Bands Dashboard MASTER VOLATILITY WITH BOLLINGER BANDS The TCT BB PANEL monitors Bollinger Bands, identifying volatility squeezes and price extremes. WHAT YOUR DASHBOARD DISPLAYS Account: Balance, Equity, Profit, Drawdown Positions: Buys, Sells, Total BB: Upper, Middle, and Lower Bands Milestones: Detection, Last Touched, Next
HAS RSI Signal — Indicatore di Tendenza Professionale con Calcolo SL/TP HAS RSI Signal è un potente strumento di trading che combina classici intramontabili con moderni algoritmi di filtraggio del rumore. L'indicatore analizza il mercato attraverso le candele Heiken Ashi Smoothed (HAS) e l'oscillatore RSI , fornendo al trader segnali di ingresso chiari durante le inversioni di tendenza o l'uscita dalle zone di ipercomprato/ipervenduto. Vantaggi Principali: Doppio Filtraggio: L'uso di Heiken Ashi
TrendDetect
Pavel Gotkevitch
The Trend Detect indicator combines the features of both trend indicators and oscillators. This indicator is a convenient tool for detecting short-term market cycles and identifying overbought and oversold levels. A long position can be opened when the indicator starts leaving the oversold area and breaks the zero level from below. A short position can be opened when the indicator starts leaving the overbought area and breaks the zero level from above. An opposite signal of the indicator can b
Multiple Timeframe MACD indicator. This indicator was built for making multiple timeframe analysis possible in MT5 using MACD Indicator. MACD Indicator traditionally shows two lines and one histogram. MACD Line(Yellow) is calculated by subtracting 12period EMA(fast) from 26period EMA (slow). Signal Line(Blue) is created by a 9period EMA from MACD Line. Histogram is just the difference between MACD and Signal lines. Histogram is colored based on the difference between its value and the previous h
An customize Indicator by which you can have Triple moving averages at close prices and send push notification on each crossing.  This indicator is especially useful when you are doing manual trading. Notes: Cation: forex trading is a very risky business,...              don't invest the money you cannot bear to lose.             the probability of losing is high ... more high aaaand exponentially high.... something like EMA enjoy losing with us...
This indicator builds upon the previously posted Nadaraya-Watson smoothers. Here we have created an envelope indicator based on Kernel Smoothing with integrated alerts from crosses between the price and envelope extremities. Unlike the Nadaraya-Watson estimator, this indicator follows a contrarian methodology. Please note that by default this indicator can be subject to repainting. Users can use a non-repainting smoothing method available from the settings. The triangle labels are designed so
First Dawn MT5
Innovicient Limited
The First Dawn indicator uses a unique mechanism to search and plot signals. This keeps searching for signals, making it a great indicator for scaping and identification of changes in direction, swing trading and trend trading. The    First Dawn     helps you get early signals. The backtest gives the true picture of how the indicator works with real/demo accounts. Although this is a tiny indicator it is packed with advantageous settings that will help you whether you desire to: Snap the Peaks a
Discover the Power of the Multi Timeframe MACD Scanner for MT5 The MTF  MACD Scanner indicator is a practical tool for traders using MetaTrader 5 (MT5). It takes the well-known MACD (Moving Average Convergence Divergence) indicator and turns its data into easy-to-read dashboard and candle colors on your chart. This helps you spot market trends, momentum shifts, and potential reversals without needing to analyze separate MACD lines and switch between timeframes. What Does It Do? This indicator cr
Технический индикатор Universal Oscillator является комбинацией торговых сигналов самых популярных и широко используемых осцилляторов. Индикатор представлен гистограммами, а также линиями fast и slow MA, что позволяет расширить список получаемых торговых рекомендаций и работать как по тренду, так и в боковом движении рынка. Таким образом, гистограммы позволяют определить момент пробоя ценовых значений и движение в новой фазе рынка, а линии указывают на зоны перекупленности и перепроданности.  Ос
KasTon Trend System: The Complete 2-in-1 Trading Strategy Identify the Trend, Confirm the Signal, and Trade with Confidence! Do you suffer from confusion while trading? Do you find it difficult to determine the market's direction? Are you tired of losing money on false signals? The KasTon Trend System is here as an integrated solution to all these problems. This is not just an indicator; it is a complete trading strategy built on the synergy of two powerful, custom-built indicators. Our main g
PipFinite Trend PRO MT5
Karlo Wilson Vendiola
4.84 (557)
Breakthrough Solution For Trend Trading And Filtering With All Important Features Built Inside One Tool! Trend PRO's smart algorithm detects the trend, filters out market noise and gives entry signals with exit levels. The new features with enhanced rules for statistical calculation improved the overall performance of this indicator. Important Information Revealed Maximize the potential of Trend Pro, please visit www.mql5.com/en/blogs/post/713938 The Powerful Expert Advisor Version Automatin
The Riko Trend indicator is a revolutionary trend trading and filtering solution with all the important features of a trend tool built into one tool! The Riko Trend indicator is good for any trader, suitable for any trader for both forex and binary options. You don’t need to configure anything, everything is perfected by time and experience, it works great during a flat and in a trend. The Riko Trend indicator is a technical analysis tool for financial markets that reflects the current price f
Hush mt5
Iurii Plokhov
4.33 (3)
Hush mt5 is an advanced indicator that gives a signal about the overbought or oversold market in a certain period of time Hush mt5 the advantage of this indicator is that it does not disappear after the signal on the chart Suitable for any trade: forex, stocks, cryptocurrency, metals Hush mt5 can be used on any time period. The signal goes to the beginning of the next candle after the arrow Hush mt5 performed best on the period H1,H4,daily It can be used in addition to forex, in binary opt
A lot of professional traders use high quality divergence signals as a part of their strategy to enter a position. Spotting correct divergences quickly can often be hard, especially if your eye isn’t trained for it yet. For this reason we’ve created a series of easy to use professional oscillator divergence indicators that are very customisable so you get only the signals you want to trade. We have this divergence indicator for RSI, MACD, Stochastics, CCI and OBV. RSI:   https://www.mql5.com/en/
Indicatore per determinare flat e trend. Se il prezzo è inferiore a uno qualsiasi dei due istogrammi e delle due linee (rossa e blu), questa è una zona di vendita. Quando acquisti questa versione dell'indicatore, versione MT4 per un conto reale e uno demo - in regalo (per ricevere, scrivimi un messaggio privato)! Se il prezzo è al di sopra di uno dei due istogrammi e delle due linee (rossa e blu), questa è una zona di acquisto. Versione MT4: https://www.mql5.com/en/market/product/3793 Se il
Bollinger Trend Lines – MT4 & MT5 Bollinger Trend Lines is a professional volatility-based trend indicator designed to clearly identify trend direction and dynamic stop levels using Bollinger Bands. Fuses on one core principle: follow the trend, ignore noise, and let volatility define the stop. How it works The indicator builds trailing trend lines using Bollinger Bands: In an uptrend , the lower band trails price and can only rise In a downtrend , the upper band trails price and can only
WaveTrend Clarity PRO was built for traders who use WaveTrend-style momentum analysis but want more context than a simple WT1/WT2 cross. On fast charts such as XAUUSD M5/M15, WaveTrend crosses can appear frequently. Some crosses happen near useful overbought or oversold areas, while others appear inside noisy price movement. This tool focuses on one main purpose: making WaveTrend momentum easier to read with multi-timeframe context, Clarity Score, trend filter, divergence and a compact dashboard
# RSI Pro Alert - Advanced RSI Indicator A powerful professional-grade RSI indicator with intelligent alerts, scheduled snapshots, and multi-dimensional notifications to help you capture market opportunities with precision! --- ## Key Features ### Smart Signal Detection - **Precision Cross Detection** : Automatically identifies critical moments when RSI crosses overbought/oversold levels - **State Tracking Mechanism** : Real-time monitoring of market state changes (Overbought/Overso
Kalman Cone Forecast MT5 Adaptive forecast cone, trend pressure, and exhaustion detection in one clean trading panel. Kaman Cone Forecast is an adaptive predictive indicator for MetaTrader 5. It uses Kalman filter smoothing to reduce market noise, estimate current trend pressure, and project a forward price cone based on live volatility conditions. Instead of showing only a moving average line or a basic volatility band, Kalman Cone Forecast gives you a clearer answer to three important questi
Ultimate Boom and Crash Indicator The Ultimate Boom and Crash Indicator is a cutting-edge tool developed by  Coetsee Digital , designed to identify potential spike opportunities in the market. Crafted for traders focusing on Deriv and Weltrade synthetic markets, this indicator is optimized to operate exclusively on the 3-minute (M3), 5-minute (M5), 15-minute (M15), 30-minute (M30), and 1-hour (H1) timeframes and supports only the following pairs: PainX 1200, PainX 999, PainX 800, PainX 600, Pai
Overview Donchian Long Edge is a modern take on Richard Donchian’s classic channel breakout strategy — adapted specifically for long-only momentum and reversal entries. It combines the proven logic of Donchian breakouts with ATR-based buffers, rearm logic, and session-aware filters. The indicator highlights buy signals only , designed for trend-following and range-reversal trading approaches. This version introduces session start/end markers and time-based signal filtering , making it especially
PZ Mean Reversion MT5
PZ TRADING SLU
3 (2)
Indicatore unico che implementa un approccio professionale e quantitativo al trading di reversione. Sfrutta il fatto che il prezzo devia e ritorna alla media in modo prevedibile e misurabile, il che consente regole di entrata e uscita chiare che superano di gran lunga le strategie di trading non quantitative. [ Installation Guide | Update Guide | Troubleshooting | FAQ | All Products ] Segnali di trading chiari Incredibilmente facile da scambiare Colori e dimensioni personalizzabili Implementa l
Heiken Ashi Smoothed Strategy is a very simple but powerful system to get forex market trend direction. This indicator is actually 2 indicators in 1 pack, Heiken Ashi and Heiken Ashi Smoothed Moving Average both included. Because HA (Heiken Ashi) and HAS (Heiken Ashi Smoothed) are calculated in the same one system event with necessary buffers and loop only, so it is the FAST, OPTIMIZED and EFFICIENT HA having the combined indicator of MetaTrader 5. You can choose to display HA and HAS in the sam
Gecko EA MT5
Profalgo Limited
5 (1)
NEW PROMO: Only a few copies copies available at 349$ Next price: 449$ Make sure to check out our " Ultimate EA combo package " in our   promo blog ! Gecko runs a simple, yet very effective, proven strategy.  It looks for important recent support and resistance levels and will trade the breakouts.  This is a "real" trading system, which means it will use a SL to protect the account.  It also means it will not use any dangerous techniques like martingale, grid or averaging down. The EA shows its
Gli utenti di questo prodotto hanno anche acquistato
Neuro Poseidon MT5
Daria Rezueva
4.96 (27)
Neuro Poseidon is a new indicator by Daria Rezueva. It combines precise trading signals with adaptive TP/SL levels - creating best possible trades as a result! Message me and get  Neuro Poseidon Assistant  as a gift to automize your trading process! What makes it stand out? 1. Proven profitability on all assets and timeframes 2. Only confirmed BUY and SELL signals present on the chart 3. Adaptive TP & SL levels generated by the software for each trade 4. Easy to understand - suitable for al
SuperScalp Pro
Van Minh Nguyen
4.65 (26)
SuperScalp Pro – Sistema avanzato di indicatore scalping multi-filtro SuperScalp Pro è un indicatore di scalping avanzato che combina il classico Supertrend con molteplici filtri intelligenti di conferma per aiutare a identificare opportunità di trading. Funziona in modo efficiente su diversi timeframe da M1 a H4, con prestazioni ottimizzate su XAUUSD, BTCUSD e principali coppie Forex. L’indicatore fornisce chiari segnali Buy e Sell, insieme a livelli di ingresso, stop loss e take profit calcola
Divergence Bomber
Ihor Otkydach
4.9 (90)
Ogni acquirente dell’indicatore riceverà inoltre gratuitamente: L’utilità esclusiva “Bomber Utility”, che gestisce automaticamente ogni operazione, imposta i livelli di Stop Loss e Take Profit e chiude le posizioni secondo le regole della strategia I file di configurazione (set file) per adattare l’indicatore a diversi asset I set file per configurare il Bomber Utility in tre modalità: “Rischio Minimo”, “Rischio Bilanciato” e “Strategia di Attesa” Una guida video passo-passo per installare, conf
Entry In The Zone and SMC Multi Timeframe is a real-time 2-in-1 market analysis tool that combines market structure analysis and a No Repaint BUY / SELL signal system into a single indicator, built on Smart Money Concepts (SMC) — a widely adopted framework used by professional traders to understand market structure. This indicator helps you see the market more clearly, make decisions based on structure rather than guesswork, and focus on high-probability zones where price is more likely to react
Cominciamo con la verità. Nessun indicatore da solo ti renderà profittevole. Se qualcuno ti dice il contrario, ti sta vendendo un sogno. Qualsiasi indicatore che mostra frecce perfette di acquisto/vendita può essere reso impeccabile — basta ingrandire la giusta sezione della storia e catturare solo i trade vincenti. Noi non lo facciamo.  SMC Intraday Formula è uno strumento. Legge la struttura del mercato per te, identifica le zone a più alta probabilità e ti mostra esattamente come appare la t
Questo prodotto è stato aggiornato per il mercato 2026 e ottimizzato per le ultime build di MT5. AVVISO DI AGGIORNAMENTO PREZZO: Smart Trend Trading System è attualmente disponibile a $99 . Il prezzo aumenterà a $199 dopo i prossimi 30 acquisti . OFFERTA SPECIALE: Dopo aver acquistato Smart Trend Trading System, inviami un messaggio privato per ricevere Smart Universal EA GRATIS e trasformare i tuoi segnali Smart Trend in operazioni automatiche. Smart Trend Trading System è un sistema di tradin
Power Candles MT5
Daniel Stein
5 (8)
Power Candles V3 - Indicatore di forza ad ottimizzazione automatica Power Candles V3 trasforma la forza delle valute e degli strumenti in un piano di trading attuabile su ogni grafico a cui è collegato. Invece di limitarsi a colorare le candele, esegue un'auto-ottimizzazione in tempo reale in background e ti fornisce i migliori valori di Stop Loss, Take Profit e soglia di segnale per il simbolo che hai davanti. Basta un clic per adottarlo nel trading live: i raggi di ingresso, Stop Loss e Take P
SignalTech is an unique fully rule based trading system delivers an Institutional approach for both Independent Traders and Prop Firm Challengers. Never Repaint. Push Notification available. No over-optimization. All the winning trades with chart setups are published on the comments page. 2026-05 4107 Pips (Until 05-29 NY Closed) 2026-04 2243 Pips 2026-03 2165 Pips 2026-02 2937 Pips 2026-01 2624 Pips 2025-12 1174 Pips It can generate signals with Buy/Sell Arrows, Push Notification (To Mobile) an
PrimeScalping
Temirlan Kdyrkhan
PrimeScalping is a powerful trading companion designed to generate high-probability entry signals with dynamic TP/SL/DP levels based on volatility. Built-in performance tracking shows win/loss stats, PP1/PP2 hits, and success rates — all updated live. Key Features: Buy/Sell signals with adaptive volatility bands Real-time TP/SL/DP levels based on ATR Built-in MA Filter with optional ATR/StdDev volatility Performance stats panel (Success, Profit/Loss, PP1/PP2) Alerts via popup, sound, push, or e
Quantum TrendPulse
Bogdan Ion Puscasu
5 (25)
Ecco   Quantum TrendPulse   , lo strumento di trading definitivo che combina la potenza di   SuperTrend   ,   RSI   e   Stocastico   in un unico indicatore completo per massimizzare il tuo potenziale di trading. Progettato per i trader che cercano precisione ed efficienza, questo indicatore ti aiuta a identificare con sicurezza le tendenze di mercato, i cambiamenti di momentum e i punti di entrata e uscita ottimali. Caratteristiche principali: Integrazione SuperTrend:   segui facilmente l'andame
Trend Catcher ind mt5
Ramil Minniakhmetov
5 (4)
INDICATORE TREND CATCHER L'indicatore Trend Catcher analizza i movimenti dei prezzi di mercato, utilizzando una combinazione di indicatori di analisi del trend proprietari dell'autore e personalizzati. Identifica la vera direzione del mercato filtrando il rumore a breve termine e concentrandosi sulla forza del momentum sottostante, sull'espansione della volatilità e sul comportamento della struttura dei prezzi. Utilizza inoltre una combinazione di indicatori personalizzati di smoothing e filtr
Presentazione       Quantum Breakout PRO   , l'innovativo indicatore MQL5 che sta trasformando il modo in cui scambi le zone di breakout! Sviluppato da un team di trader esperti con un'esperienza di trading di oltre 13 anni,       Quantum Breakout PRO       è progettato per spingere il tuo viaggio di trading a nuovi livelli con la sua strategia innovativa e dinamica della zona di breakout. Quantum Breakout Indicator ti fornirà frecce di segnalazione sulle zone di breakout con 5 zone target di
Gann Made Easy è un sistema di trading Forex professionale e facile da usare che si basa sui migliori principi del trading utilizzando la teoria di mr. WD Gann. L'indicatore fornisce segnali ACQUISTA e VENDI accurati, inclusi i livelli di Stop Loss e Take Profit. Puoi fare trading anche in movimento utilizzando le notifiche PUSH. CONTATTAMI DOPO L'ACQUISTO PER RICEVERE GRATUITAMENTE LE ISTRUZIONI DI TRADING E OTTIMI INDICATORI EXTRA! Probabilmente hai già sentito parlare molte volte dei metodi d
FX Trend MT5 NG
Daniel Stein
5 (6)
FX Trend NG: La Nuova Generazione di Intelligenza di Trend Multi-Mercato Panoramica FX Trend NG è uno strumento professionale di analisi del trend multi-timeframe e monitoraggio dei mercati. Ti consente di comprendere la struttura completa del mercato in pochi secondi. Invece di passare tra numerosi grafici, puoi identificare immediatamente quali strumenti sono in trend, dove il momentum sta diminuendo e dove esiste un forte allineamento tra i timeframe. Offerta di Lancio – Ottieni FX Trend NG
M1 Quantum MT5
Hamed Dehgani
5 (1)
M1 Quantum è un sistema di trading professionale per M1 che fornisce segnali di trading rapidi e precisi con Stop Loss, Take Profit e gestione intelligente del capitale integrati. M1 Quantum include un sistema professionale di gestione del capitale progettato per far crescere rapidamente il conto concentrandosi su vittorie consecutive . Caratteristiche principali dell' Indicatore M1 Quantum Progettato per il time frame M1 e tutte le principali coppie di valute Tutti i trade hanno Stop Loss e Tak
Reversion King Indicator
Eugen-alexandru Zibileanu
5 (4)
Un nuovo Re in città - Indicatore + Gestione ordini (TP1 + TP2 + TP3) + Invio opzionale di segnali Telegram INCLUSO (GRATIS) (SISTEMA COMPLETO DI TRADING e SEGNALI) Il nostro miglior EA per l’Oro: Gold Slayer Questo indicatore include una strategia avanzata, un sistema di trading con gestione ordini personalizzabile e un sistema mean reversion che combina estensioni di envelope, supportato da molteplici filtri intelligenti di conferma come RSI per individuare ingressi di inversione ad alta proba
Meridian Pro
Ottaviano De Cicco
5 (2)
Meridian Pro 2.00: Professional Multi-Timeframe Trend Matrix for MT5 Meridian Pro 2.00 is a professional adaptive trend matrix for MetaTrader 5. It combines the original Meridian trend engine, a clean chart ribbon, closed-bar signal arrows, an 8-timeframe dashboard, Fuel momentum, weighted consensus, synthetic HTF processing and chart-native higher-timeframe context lines. The goal is simple: read current trend, multi-timeframe structure, strength, momentum and EA-ready state from one discipline
Atomic Analyst MT5
Issam Kassas
4.26 (35)
Questo prodotto è stato aggiornato per il mercato 2026 e ottimizzato per le ultime build di MT5. AVVISO DI AGGIORNAMENTO PREZZO: Atomic Analyst è attualmente disponibile a $99 . Il prezzo aumenterà a $199 dopo i prossimi 30 acquisti . OFFERTA SPECIALE: Dopo aver acquistato Atomic Analyst, inviami un messaggio privato per ricevere Smart Universal EA GRATIS e trasformare i tuoi segnali Atomic Analyst in operazioni automatiche. Atomic Analyst è un indicatore di trading Price Action non-repainting
SmartScalping
Temirlan Kdyrkhan
SmartScalping is a powerful trading companion designed to generate high-probability entry signals with dynamic TP/SL/DP levels based on volatility. Built-in performance tracking shows win/loss stats, PP1/PP2 hits, and success rates — all updated live. Key Features: Buy/Sell signals with adaptive volatility bands Real-time TP/SL/DP levels based on ATR Built-in MA Filter with optional ATR/StdDev volatility Performance stats panel (Success, Profit/Loss, PP1/PP2) Alerts via popup, sound, push, or e
ARIPoint
Temirlan Kdyrkhan
1 (1)
ARIPoint is a powerful trading companion designed to generate high-probability entry signals with dynamic TP/SL/DP levels based on volatility. Built-in performance tracking shows win/loss stats, PP1/PP2 hits, and success rates all updated live. Key Features: Buy/Sell signals with adaptive volatility bands Real-time TP/SL/DP levels based on ATR Built-in MA Filter with optional ATR/StdDev volatility Performance stats panel (Success, Profit/Loss, PP1/PP2) Alerts via popup, sound, push, or email Cu
Questo prodotto è stato aggiornato per il mercato 2026 e ottimizzato per le ultime build di MT5. AVVISO DI AGGIORNAMENTO PREZZO: Smart Price Action Concepts è attualmente disponibile a $200 . Il prezzo aumenterà a $299 dopo i prossimi 30 acquisti . OFFERTA SPECIALE: Dopo l’acquisto, inviami un messaggio privato per ricevere un bonus gratuito + regalo . Prima di tutto, vale la pena sottolineare che questo strumento di trading è un indicatore non-repainting, non-redrawing e non-lagging, il che lo
TrendProMaster
Temirlan Kdyrkhan
MasterTrend Indicator for MT5 A powerful trend-following and signal-evaluation tool MasterTrend   is a custom MT5 indicator that combines Moving Averages and ATR-based risk/reward logic to generate clear buy/sell signals. It visualizes dynamic SL/TP levels, evaluates past trade outcomes, and displays win/loss statistics in a clean on-chart panel. Key features include: Buy/Sell signals based on MA crossovers ATR-based SL/TP1/TP2/TP3 levels with visual lines and labels Signal outcome tracking wit
Versione Swing M30/H1/H4 disponibile Vuoi catturare i grandi movimenti? Gold Signal Swing Pro (M30/H1/H4). Obiettivo: $20-$80+ per trade. https://www.mql5.com/en/market/product/177643 KURAMA GOLD SIGNAL PRO (MT5) — Sistema di Trading XAUUSD Completo a 7 Strati di Filtri Nessun repaint. Nessun ridisegno. Nessun ritardo. Ogni segnale rimane fissato una volta confermato. Bonus acquirente: Chiunque acquisti la licenza di acquisto riceve AI Zone Radar (v
Azimuth Pro
Ottaviano De Cicco
5 (7)
Azimuth Pro V2: Synthetic Fractal Structure and Confirmed Entries for MT5 Overview Azimuth Pro is a multi-level swing structure indicator by Merkava Labs . Four nested swing layers, swing-anchored VWAP, ABC pattern detection, three-timeframe structural filtering, and closed-bar confirmed entries — one chart, one workflow from micro-swings to macro-cycles. This is not a blind signal product. It is a structure-first workflow for traders who care about location, context, and timing. V2 Launch Offe
RelicusRoad Pro MT5
Relicus LLC
4.96 (24)
RelicusRoad Pro: Sistema Operativo Quantitativo di Mercato 70% DI SCONTO ACCESSO A VITA (TEMPO LIMITATO) - UNISCITI A 2.000+ TRADER Perché la maggior parte dei trader fallisce anche con indicatori "perfetti"? Perché operano su Singoli Concetti isolati. Un segnale senza contesto è una scommessa. Per vincere serve CONFLUENZA . RelicusRoad Pro non è un semplice indicatore. È un Ecosistema Quantitativo completo . Mappa la "Fair Value Road", distinguendo tra rumore e rotture strutturali. Smetti di in
ScalpPoint
Temirlan Kdyrkhan
ScalpPoint is a powerful trading companion designed to generate high-probability entry signals with dynamic TP/SL/DP levels based on volatility. Built-in performance tracking shows win/loss stats, PP1/PP2 hits, and success rates — all updated live. Key Features: Buy/Sell signals with adaptive volatility bands Real-time TP/SL/DP levels based on ATR Built-in MA Filter with optional ATR/StdDev volatility Performance stats panel (Success, Profit/Loss, PP1/PP2) Alerts via popup, sound, push, or emai
Crystal Heikin Ashi Signals
Muhammad Jawad Shabir
5 (2)
Crystal Heikin Ashi Signals - Professional Trend & Signal Detection Indicator Advanced Heikin Ashi Visualization with Intelligent Signal System for Manual & Automated Trading Final Price: $149 ---------> Price goes up $10 after every 10 sales . Limited slots available — act fast . Overview Crystal Heikin Ashi Signals is a professional-grade MetaTrader 5 indicator that combines pure Heikin Ashi candle visualization with an advanced momentum-shift detection system. Designed for both manual traders
FX Power MT5 NG
Daniel Stein
5 (32)
FX Power: Analizza la Forza delle Valute per Decisioni di Trading Più Intelligenti Panoramica FX Power è lo strumento essenziale per comprendere la reale forza delle principali valute e dell'oro in qualsiasi condizione di mercato. Identificando le valute forti da comprare e quelle deboli da vendere, FX Power semplifica le decisioni di trading e rivela opportunità ad alta probabilità. Che tu segua le tendenze o anticipi inversioni utilizzando valori estremi di Delta, questo strumento si adatta
Meta Trend PRO MT5
Roman Podpora
5 (1)
META TREND PRO       — è uno strumento di trend following che elimina le incertezze dal trading e mostra dove il mercato ha già preso la sua decisione. L'indicatore identifica i punti chiave in cui cambiano trend, tendenze e strutture, ed evidenzia le aree in cui il prezzo ritorna, consentendo ai principali operatori di prendere posizione. Non solo visualizzi il movimento, ma ne comprendi anche la logica sottostante. Tutti i segnali vengono registrati dopo la chiusura della candela, non vengono
FX Levels MT5
Daniel Stein
5 (14)
FX Levels: Supporti e Resistenze di Precisione Eccezionale per Tutti i Mercati Panoramica Rapida Cercate un modo affidabile per individuare livelli di supporto e resistenza in ogni mercato—coppie di valute, indici, azioni o materie prime? FX Levels fonde il metodo tradizionale “Lighthouse” con un approccio dinamico all’avanguardia, offrendo una precisione quasi universale. Basato sulla nostra esperienza reale con i broker e su aggiornamenti automatici giornalieri più quelli in tempo reale, FX
Altri dall’autore
Time Scale for MT5
Taras Slobodyanik
4.77 (30)
The indicator draws the time scale on the chart. You can specify the time offset, adjust the size and font to display on the chart ( it is displaying your local time on your chart instead of MT time ). You can also select the desired format for displaying the date and time. You may be interested in my other product , which contains a more advanced version of the Time Scale . You can also find my other products here Parameters Hours (time shift) — time shift (hours); Minutes (time shift) — time
FREE
ZigZag Lines MTF
Taras Slobodyanik
4.38 (13)
Multi timeframe ZigZag indicator. It displays the support/resistance horizontal lines and their breakouts, as well as draws the current targets of the market. It can also display lines of the Fractals indicator and candles from other periods (up to Quarterly). So, you can actually see the supply and demand levels. Indicator – connects key lows and highs to show trend lines. You can also use it as indicator for the Break of Structure(BOS) & Market Structure Shift(MSS). The indicator redraws the
Heikin Ashi Dashboard MT5
Taras Slobodyanik
5 (4)
Multi-currency and multitimeframe Heikin Ashi indicator. Shows the current state of the market. On the scanner panel you can see the direction, strength and number of bars of the current trend. The Consolidation/Reversal candles are also shown using color. You can specify any desired currencies and periods in the parameters. Also, the indicator can send notifications when the trend changes or when reversal and consolidation candles (dojis) appear. By clicking on a cell, this symbol and period wi
ZigZag Lines MTF for MT5
Taras Slobodyanik
5 (11)
Multi timeframe ZigZag indicator. It displays the support/resistance horizontal lines and their breakouts, as well as draws the current targets of the market. It can also display lines of the Fractals indicator and candles from other periods (up to Quarterly). So, you can actually see the supply and demand levels. Indicator – connects key lows and highs to show trend lines. You can also use it as indicator for the Break of Structure(BOS) & Market Structure Shift(MSS). The indicator redraws the
Lines Profit Loss MT5
Taras Slobodyanik
4.62 (13)
L'indicatore mostra il profitto (perdita) sul simbolo corrente. Puoi trascinare e rilasciare liberamente la linea per visualizzare il profitto o la perdita corrente. Puoi trovare i miei prodotti   qui Parametri Calculation in money or in points — calcola il profitto/perdita in punti o denaro. Add pending orders to calculate — prendi in considerazione gli ordini in sospeso nei calcoli. Magic Number (0 - all orders on symbol) — numero magico, se è necessario valutare ordini specifici. Offset f
FREE
ZigZag Dashboard for MT5
Taras Slobodyanik
5 (4)
Multicurrency and multitimeframe modification of the ZigZag indicator. Displays the current direction of the market, the height of the last movement, the number of bars in this movement and the breaking of the previous point of the ZigZag (horizontal line). This is MTF Scanner, you can actually see the supply and demand levels. You can specify any desired currencies and timeframes in the parameters. Also, the panel can send notifications when the ZigZag changes direction or when there was a br
The indicator has three main tools: Magnifier (Zoom chart), Ruler  ( Time and Price scales ),   and Crosshair. You can move it all around with your mouse and customize different formats for  displaying , customize   size and color of each element. The Magnifier (zoom chart) allows you to display candles from any time frame and at different scales. Hotkeys: 'Q' - higher timeframe, 'A' - lower timeframe, 'W' - decrease candle size, 'S' - increase candle size, 'Z' - show/hide zoom chart. You can
MACD Dashboard
Taras Slobodyanik
5 (2)
Multi-currency and multi-timeframe indicator MACD. The dashboard can display both the Traditional (true) MACD and the MACD which is built into MetaTrader. On the panel you can see the current state of the indicator — the direction of movement of the MACD lines, their intersection and a pop-up window with the indicator chart. In the parameters you can specify any desired pairs-symbols and timeframes. The scanner can also send notifications about lines crossing each other and about lines crossing
ADX Dashboard MT5
Taras Slobodyanik
5 (4)
L'indicatore ADX viene utilizzato per determinare la tendenza e la sua forza. La direzione del prezzo è mostrata dai valori +DI e -DI e il valore ADX mostra la forza del trend. Se +DI è superiore a -DI, ​​il mercato è in un trend rialzista, se al contrario è in un trend al ribasso. Se l'ADX è inferiore a 20, non esiste una direzione definita. Non appena l'indicatore supera questo livello, inizia un trend di media forza. Valori superiori a 40 indicano un trend forte (un trend al ribasso o al ria
Modifica multivaluta e multitimeframe dell'oscillatore stocastico. È possibile specificare qualsiasi valuta e intervallo di tempo desiderati nei parametri. Il pannello visualizza i valori correnti e le intersezioni delle linee: Segnale e Principale (crossover stocastico). Inoltre, l'indicatore può inviare notifiche quando si attraversano i livelli di ipercomprato e ipervenduto. Cliccando su una cella con un punto, questo simbolo e punto verranno aperti. Questo è lo scanner MTF. Similmente al V
MACD Dashboard MT5
Taras Slobodyanik
5 (2)
Multi-currency and multi-timeframe indicator MACD. The dashboard can display both the Traditional (true) MACD and the MACD which is built into MetaTrader. On the panel you can see the current state of the indicator — the direction of movement of the MACD lines, their intersection and a pop-up window with the indicator chart. In the parameters you can specify any desired pairs-symbols and timeframes. The scanner can also send notifications about lines crossing each other and about lines crossing
Modifica multivaluta e multitimeframe dell'indicatore Relative Strength Index (RSI). È possibile specificare qualsiasi valuta e intervallo di tempo desiderati nei parametri. Inoltre, il pannello può inviare notifiche quando si attraversano i livelli di ipercomprato e ipervenduto. Cliccando su una cella con un punto, questo simbolo e punto verranno aperti. Questo è lo scanner MTF. La chiave per nascondere la dashboard dal grafico è "D" per impostazione predefinita Similmente al Valuta Strength
Lines Profit Loss
Taras Slobodyanik
4.65 (17)
L'indicatore mostra il profitto (perdita) sul simbolo corrente. Puoi trascinare e rilasciare liberamente la linea per visualizzare il profitto o la perdita corrente. Puoi trovare i miei prodotti qui Parametri Calculation in money or in points — calcola il profitto/perdita in punti o denaro. Add pending orders to calculate — prendi in considerazione gli ordini in sospeso nei calcoli. Magic Number (0 - all orders on symbol) — numero magico, se è necessario valutare ordini specifici. Offset for
FREE
Pro Sessions MT4
Taras Slobodyanik
4.75 (4)
This is an indicator of trading sessions  that can display all levels (Open-High-Low-Close) for four sessions. The indicator can also predict session levels. Sessions can be drawn with lines or rectangles (empty or filled), lines can be extended to the next session. You can easily hide/show each session by pressing hotkeys (by default '1', '2', '3', '4') You can see ASR (Average Session Range) lines  (default hotkey 'A'). This is similar to the ADR calculation, only it is calculated based on th
Time Scale
Taras Slobodyanik
4.87 (15)
The indicator draws the time scale on the chart. You can specify the time offset, adjust the size and font to display on the chart (it is displaying your local time on your chart instead of MT time). You can also select the desired format for displaying the date and time. While holding down the middle mouse button, and moving the cursor, a slider will appear on the scale. You may be interested in my other product , which contains a more advanced version of the Time Scale. You can also find my o
FREE
L'indicatore disegna automaticamente i livelli di Fibonacci in base all'indicatore ZigZag, alle sessioni di trading, ai frattali o alle candele (inclusi intervalli di tempo non standard: anno, 6 mesi, 4 mesi, 3 mesi, 2 mesi) (ritracciamento automatico di Fibonacci). Puoi scegliere qualsiasi intervallo di tempo più lungo per il calcolo di Fibonachi. I livelli vengono ridisegnati ogni volta che la barra corrente si chiude. È possibile abilitare gli avvisi quando si superano i livelli specificati.
Multicurrency and multi-timeframe indicator Inside Bar (IB). In the parameters, you can specify any desired currencies and timeframes. The panel displays the last found Inside Bar (and Mother Bar) pattern, the current price position and the breakout of the levels of the Mother and Inside Bars. You can set the size and color for bars and text in the cells. The indicator can also send notifications when levels are broken. The dashboard highlights Double Inside Bar in a special color. By clicking
Levels of Timeframes
Taras Slobodyanik
5 (2)
L'indicatore mostra i livelli Alto/Basso/Apertura/Chiusura da altri intervalli di tempo (e non standard): Anno, 6 Mesi, 4 Mesi, 3 Mesi, 2 Mesi, Mese, Settimana, Giorno, H3-H6-H8-H12 Ore . Puoi anche impostare lo spostamento per l'apertura delle candele e costruire candele virtuali. I "separatori di periodo" per uno di questi intervalli di tempo sono disponibili sotto forma di linee verticali. Gli avvisi possono essere configurati per i breakout dei livelli attuali o precedenti (breakout della l
Symbol Manager for MT5
Taras Slobodyanik
5 (3)
Symbol Manager or Grid Manager, designed to group orders into one position (by Symbol or by Magic Number). This utility will be useful to multi-currency traders (many EAs), who can have multiple orders on several pairs. You will be able to see the total number of lots, the total profit, and set virtual stop loss and virtual take profit. To set a real TP (or SL), you must first set the virtual value, and then enter the command in this cell: "set". If you want to set real TP/SL for all orders at
Modifica multivaluta e multitimeframe dell'oscillatore stocastico. È possibile specificare qualsiasi valuta e intervallo di tempo desiderati nei parametri. Il pannello visualizza i valori correnti e le intersezioni delle linee: Segnale e Principale (crossover stocastico). Inoltre, l'indicatore può inviare notifiche quando si attraversano i livelli di ipercomprato e ipervenduto. Cliccando su una cella con un punto, questo simbolo e punto verranno aperti. Questo è lo scanner MTF. Similmente al V
L'indicatore mostra i livelli Alto/Basso/Apertura/Chiusura da altri intervalli di tempo (e non standard): Anno, 6 Mesi, 4 Mesi, 3 Mesi, 2 Mesi, Mese, Settimana, Giorno, H3-H6-H8-H12 Ore . Puoi anche impostare lo spostamento per l'apertura delle candele e costruire candele virtuali. I "separatori di periodo" per uno di questi intervalli di tempo sono disponibili sotto forma di linee verticali. Gli avvisi possono essere configurati per i breakout dei livelli attuali o precedenti (breakout della l
CCI Dashboard for MT5
Taras Slobodyanik
5 (1)
Multicurrency and multitimeframe modification of the Commodity Channel Index (CCI) indicator. You can specify any desired currencies and timeframes in the parameters. Also, the panel can send notifications when crossing overbought and oversold levels. By clicking on a cell with a period, this symbol and period will be opened. This is MTF Scanner. The key to hide the dashboard from the chart is "D" by default Parameters CCI Period  — averaging period. CCI Applied price  — price type. Clear the
Pro Sessions MT5
Taras Slobodyanik
5 (1)
This is an indicator of trading sessions  that can display all levels (Open-High-Low-Close) for four sessions . The indicator can also predict session levels. Sessions can be drawn with lines or rectangles (empty or filled), lines can be extended to the next session. You can easily hide/show each session by pressing hotkeys (by default '1', '2', '3', '4') You can see ASR (Average Session Range) lines  (default hotkey 'A'). This is similar to the ADR calculation, only it is calculated based on t
Symbol Manager
Taras Slobodyanik
5 (4)
Symbol Manager or Grid Manager, designed to group orders into one position (by Symbol or by Magic Number). This utility will be useful to multi-currency traders (many EAs), who can have multiple orders on several pairs. You will be able to see the total number of lots, the total profit, and set virtual stop loss and virtual take profit. To set a real TP (or SL), you must first set the virtual value, and then enter the command in this cell: "set". If you want to set real TP/SL for all orders at
MTF RSI for MT5
Taras Slobodyanik
Multi-timeframe indicator Relative Strength Index displays information simultaneously from different periods in one subwindow of the chart. Parameters Period of averaging — averaging period for the RSI calculation. Type of price — price used. Timeframes for RSI — list of periods, separated by a space or comma or semicolon. Number of bars for each period — the number of bars displayed for each period. Sort periods — sort periods if they are listed in no particular order. Current period first — d
Stochastic Oscillator displays information simultaneously from different periods in one subwindow of the chart. Parameters %K Period — K-period (number of bars for calculations). %D Period — D-period (period of first smoothing). Slowing — final smoothing. Method — type of smoothing. Price field — stochastic calculation method . Timeframes for Stochastic — list of periods, separated by a space or comma or semicolon. Number of bars for each period — the number of bars displayed for each period. S
This is the famous FX Sniper's T3 CCI indicator. It is a fixed version additionally containing search for classical and reverse (hidden) divergence. The classical divergence is displayed as a solid line, the reverse divergence is shown as a dotted line. Divergences are drawn in the indicator and on the chart (if you select the appropriate options). Parameters CCI Period — Commodity Channel Index indicator period CCI Type of price — price used for indicator calculation T3 Period — Sniper period
The indicator calculates the inclination angle between the Highs, Lows and Closes of adjacent bars. The angle can be measured in degrees or radians. A linear graph or a histogram is drawn in a subwindow. You can set the scale for the calculation — floating or fixed. For use in Expert Advisors or indicators, you need to specify a fixed scale. Parameters Angular measure — degrees or radians. Scale mode for calculation — scaling mode. Free scale — free transformation, the indicator will calculate
FREE
Angle High Low
Taras Slobodyanik
The indicator calculates the angle between the Highs, Lows and Closes of neighboring bars. The angle can be measured in degrees or radians. A linear chart or a histogram is drawn in a subwindow. You can set the scale for the calculation — floating or fixed. For use in the EA, you need to specify a fixed scale. Parameters Angular measure — degrees or radians. Scale mode for calculation — scaling mode. Free scale — free transformation, the indicator will calculate values each time the chart scale
FREE
Filtro:
thomas
1409
thomas 2023.11.28 19:12 
 

I bought this indicator a few days ago and I can say it is really very use- and helpful !! As A. Forex already told it would be a good idea to integrate the MT5-standard indicators "Double Exponential Moving Average" and "Triple Exponential Moving Average" to this wonderful tool. To me I am using this both indicators constantly.

IK°L
824
IK°L 2023.11.27 20:50 
 

A great tool, an MA Multicurrency dashboard is essential, it has all kinds of alerts for different setups, it is very easy to read the information on the dashboard, it runs very fluid and without problems. It is a damn delight to explore the markets with these dashboards, I love the little popup window and the extraordinary attention that the developer always provides.

A. Forex
269
A. Forex 2023.10.12 14:57 
 

Great dashboard. Please add DEMA (Double EMA) into the range of MA. WOULD be super. Thank you. Спасибо!

Taras Slobodyanik
96271
Risposta dello sviluppatore Taras Slobodyanik 2023.10.12 15:17
Hello. It's not clear what you're talking about, what range? What is Double EMA? You can set both MAs to EMA.
nolimitzfx
148
nolimitzfx 2022.05.19 23:47 
 

If you use ma's for your trading/ analysis this is a must have! Works as indicated, clean, great user interface. Makes my charting analysis much faster then scrolling through ea chart individually. Highly recommend. Guys/ gals keep in mind this is not some holy grail. If you don't currently understand how to use ma's correctly then this won't be of much use to you. This will however be a godsend to those who already have a method/ system that utilizes ma's and are just looking for a tool that will aid in the whole process.

Rispondi alla recensione