Elliott Wave Radar

What This Indicator Does

This indicator automatically analyzes the chart to identify Elliott Wave patterns (impulses and corrections) and shows you where waves 1, 2, 3, 4, and 5 are in real-time. It also includes price projections, volume validation, and triangle detection.

How Does the "Radar" Version Improve on It?

  • Target Projection: It suggests where the price might be headed in wave 5.

  • Volume Validation: It confirms whether volume supports the detected pattern.

  • Triangle Detection: It identifies complex corrections (contracting, expanding, symmetrical).

  • Probabilistic Analysis: It tells you how reliable the detected pattern is (%).

  • Multiple Alternative Counts: It offers more than one valid option if the market is ambiguous.

How to Understand the Colors and Lines

Wave Lines

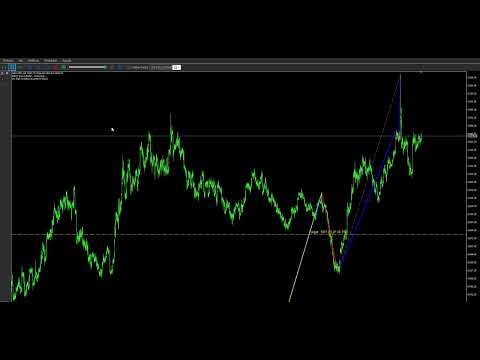
  • BLUE: Impulsive waves (1, 3, 5) — the primary trend.

  • RED: Corrective waves (2, 4) — retracements within the trend.

YELLOW LINE (Suggested Retracement)

This line marks the levels where a correction is most likely to end.

If the price pulls back and breaks the base of the yellow line (the point closest to the price, which acts as an entry level), the probability increases that it will continue toward the projection located at the other end of the line. This signal is only reliable when a complete trend change has already been confirmed, which validates both the starting and ending points of the yellow line.

GRAY LINE (Trend Channel)

This line outlines the path of impulsive waves and helps project where wave 5 might end. If the price respects the channel, it confirms the trend's strength; if it breaks it early, it could signal an upcoming correction or a change in the market scenario.

Practical Example: Bullish Trend

  • Wave 1 (Blue): First bullish impulse.

  • Wave 2 (Red): Retracement (typically 50% or 61.8% of wave 1).

  • Wave 3 (Blue): Strong bullish move (the longest wave).

  • Wave 4 (Red): Smaller retracement (does not overlap wave 1).

  • Yellow line: If the price is here, it suggests the end of the correction and a potential entry.

  • Gray channel: If the price breaks through it, it confirms the strength of the trend.

Key Signals for Trading

  • ENTRY: When the price touches the yellow line during a correction and bounces.

  • TARGET: Where the wave 5 projection suggests (based on Fibonacci).

  • CONFIRMATION: Volume should be higher in impulsive waves than in corrective ones.

Early Potential Entry (Higher Risk)

  • When: The price touches or gets close to the red line (wave 2 or 4).

  • Confirmation: A bounce with volume and continuation of the pattern.

  • Signal: The yellow line is active with a high probability.

Remember

  • It's not 100% foolproof: use stops.

  • It works best on 1H charts or higher.

  • Combine it with support/resistance for greater accuracy.

The indicator does the heavy lifting of technical analysis for you! You just need to identify the lines and follow the logic of the trend.


Recommended products
Necessary for traders: tools and indicators Waves automatically calculate indicators, channel trend trading Perfect trend-wave automatic calculation channel calculation , MT4 Perfect trend-wave automatic calculation channel calculation , MT5 Local Trading copying Easy And Fast Copy , MT4 Easy And Fast Copy , MT5 Local Trading copying For DEMO Easy And Fast Copy , MT4 DEMO Easy And Fast Copy , MT5 DEMO The homeopathic indicator is also called the CCI indicator. The CCI indicator was proposed
FREE
1. Overview The Scalping PullBack Signal indicator is a powerful technical analysis tool designed to help traders identify scalping opportunities based on potential pullback and reversal signals. This tool is particularly useful on lower timeframes (below 15 minutes) but can also be applied on higher timeframes for longer-term trades. This indicator integrates several key analytical components, providing a comprehensive view of trends and potential entry/exit points, helping you make quick and e
FREE
RSI abcd
Francisco Gomes Da Silva
4.33 (3)
RSI ABCD Pattern Finder: Technical Strategy 1. How the Indicator Works Combines the classic RSI with automatic detection of ABCD harmonic patterns . Key Components Standard RSI (adjustable period) Peak and Trough Markers (arrows) ABCD Patterns (green/red lines) Overbought (70) and Oversold (30) Filters 2. MT5 Setup period = 14 ; // RSI period size = 4 ; // Maximum pattern size OverBought = 70 ; // Overbought level OverSold = 30 ; // Oversold level Filter = USE_FILTER_ YES ; // Confirmation filte
FREE
STM Signal MT5
Aren Davidian
5 (1)
Introducing the Professional Arka STM Signal Indicator With Arka Candle Close Time – 100% Free Version Fast, Accurate, and Unmatched in Identifying Trading Opportunities This indicator is the result of combining advanced price action analysis with specialized market algorithms, delivering clear, timely, and profitable signals. Completely Free – No Installation or Usage Limits ️ An automated trading bot, fully synchronized with it, is also ready to run. The Power of ARKA STM Signa
FREE
Bounce Zone MT5
Nguyen Thanh Cong
4.56 (9)
Introduction The Bounce Zone indicator is a cutting-edge non-repainting technical tool built to identify key areas on the price chart where market sentiment is likely to cause a significant price reversal. Using advanced algorithms and historical price data analysis, this indicator pinpoints potential bounce zones. Combined with other entry signal, this indicator can help forex traders place the best trades possible Signal A possible buy signal is generated when price is in the green zone an
FREE
OmniSignal Navigator – Smart Entries at Key Levels Trade Like a Professional  with this daily/weekly High-Low-Close indicator, designed for   scalping or intraday short term trading   and precision breakout trading. Suggested Timeframes to trade with: M5 |  DONT USE THE INDICATOR ON THE M1 TIMEFRAME!!! Why It Works   Perfect for Scalping/Intraday:   Targets key zones ( PDH/PDL/PDC & PWH/PWL/PWC ) on   M2, M3, M5, M15   timeframes. (Lower Timeframes = More Signals, Higher Timeframes = Le
FREE
Necessary for traders: tools and indicators Waves automatically calculate indicators, channel trend trading Perfect trend-wave automatic calculation channel calculation , MT4 Perfect trend-wave automatic calculation channel calculation , MT5 Local Trading copying Easy And Fast Copy , MT4 Easy And Fast Copy , MT5 Local Trading copying For DEMO Easy And Fast Copy , MT4 DEMO Easy And Fast Copy , MT5 DEMO Can set the cycle for other varieties of K line graph covered this window, fluctuations obser
FREE
PROMETHEUS TECHNICAN VERSION Free | By THE SONS A gift from The Sons — no strings, no trial, no expiry. Every trader deserves access to professional-grade market intelligence. That belief is why Prometheus Technical Version exists, and why it costs nothing. Consider it our handshake to the trading community. What You're Getting This is not a simplified tool dressed up as a gift. Prometheus Technican Version is a fully built, institutional-quality technical analysis indicator running a dual-model
FREE
Necessary for traders: tools and indicators Waves automatically calculate indicators, channel trend trading Perfect trend-wave automatic calculation channel calculation , MT4 Perfect trend-wave automatic calculation channel calculation , MT5 Local Trading copying Easy And Fast Copy , MT4 Easy And Fast Copy , MT5 Local Trading copying For DEMO Easy And Fast Copy , MT4 DEMO Easy And Fast Copy , MT5 DEMO Advanced Bollinger Bands: 1. The Bollinger rail will change color with the direction" 2. The
FREE
GDXM Session Open Line PO3
Gustavo Barros Alexandre D Almeida
This indicator is a specialized utility for traders following the ICT (Inner Circle Trader) methodology, specifically focusing on the Power of Three (PO3) concept: Accumulation, Manipulation, and Distribution. The ICT PO3 Open Line automatically identifies and plots critical opening prices from specific market sessions, allowing you to visualize price action relative to the "True Open" of the day or specific sessions. Key Features 1. Daily PO3 Open Levels The indicator tracks and draws horizonta
FREE
Little useful tool - you manually select range on chart by dragging vertical blue lines and indicator shows support and resistance zones for this range and extends them outside of selected range.  Useful for: * Range trading * Range breakout * Range breakout & retest * Good entry during pullback in trend phase when previous high is retested * Good for scalping on short timeframes * Good for trades on longer timeframes around selected important zones like daily high or low
FREE
Best SAR MT5
Ashkan Hazegh Nikrou
4.33 (3)
Description :  we are happy to introduce our new free indicator based on one of professional and popular indicators in forex market (Parabolic SAR) this indicator is new modification on original Parabolic SAR indicator, in pro SAR indicator you can see cross over between dots and price chart, this crossover is not signal but talk about end of movement potential, you can start buy by new blue dot, and place stop loss one atr before first blue dot, and finally you can exit as soon as dots cross p
FREE
Auto Fibonacci
Ali Gokay Duman
5 (3)
This indicator calculates fibonacci levels via moving averages trend and draw these lines. You can change fast and slow Moving Averages settings for customization. Inputs: Fast MA Time Period :  64 Fast MA Shift: 0 Fast MA Method: Smoothed Fast MA Apply To: Median Price Slow MA Time Period: 32 Slow MA Shift: 0 Slow MA Method: Smoothed Slow MA Apply To: Median Price ZigZag: False ZigZag Color: Red ZigZag Type: DashDot ZigZag Width: VeryThin Fibo Settings TrendFibonacci: True FiboTrendColor: Black
FREE
KTrade Fibo For MT5
Kaijun Wang
4.5 (2)
Necessary for traders: tools and indicators Waves automatically calculate indicators, channel trend trading Perfect trend-wave automatic calculation channel calculation , MT4 Perfect trend-wave automatic calculation channel calculation , MT5 Local Trading copying Easy And Fast Copy , MT4 Easy And Fast Copy , MT5 Local Trading copying For DEMO Easy And Fast Copy , MT4 DEMO Easy And Fast Copy , MT5 DEMO Fibo: from KTrade 1. Automatically calculate and analyze the band. -> Get the desired band 2.
FREE
ACI Bollinger Bands
Marat Sultanov
4 (3)
Tired of adjusting the indicator settings losing precious time? Tired of the uncertainty regarding their efficiency? Afraid of the uncertainty in their profitability? Then the indicator ACI (automatically calibrateable indicator) is designed exactly for you. Launching it, you can easily solve these three issues just performing the simplest action: clicking a single Calibrate button. To achieve the highest efficiency, you should perform another additional action: move the power slider to the maxi
FREE
Super Trend eu
Emin Ulucanli
4.83 (6)
SUPERTREND; It is a trend following indicator based on the SuperTrend ATR created by Olivier Seban. It can be used to detect changes in trend direction and locate stops. When the price falls below the indicator curve, it turns red and indicates a downtrend. Conversely, when the price moves above the curve, the indicator turns green, indicating an uptrend. Like other indicators, it works well on SuperTrend when used in conjunction with other indicators such as MACD, parabolik SAR, Bollinger Band
FREE
AI Channels MT5
Duc Hoan Nguyen
5 (1)
Special offer : ALL TOOLS , just $35 each! New tools   will be   $30   for the   first week   or the   first 3 purchases !  Trading Tools Channel on MQL5 : Join my MQL5 channel to update the latest news from me The AI Channels Indicator utilizes rolling K-means clustering —a powerful machine learning technique in clustering analysis—to deliver real-time insights into underlying price trends. This indicator creates adaptive channels based on clustered price data, enabling traders to make informe
FREE
Smart Finder Order Block The Ritz Smart Finder Order Block is a next-generation market structure recognition tool, designed to intelligently detect and highlight institutional footprints within price action. Built on a dynamic blend of order block theory, consolidation tracking, and adaptive volatility modeling, it provides traders with a sophisticated lens to anticipate high-probability market reactions. Core Capabilities Smart Order Block Detection Identifies both Bullish and Bearish Order Blo
FREE
Swing High & Low Trendline Indicator is a professional tool that automatically identifies swing points on your chart and draws trendlines for easy visualization. No need to manually scan candles, the indicator highlights key highs and lows based on your chosen settings, helping you analyze market structure and trade with confidence. Features: Automatically detects swing highs & swing lows Draws clean trendlines directly on the chart Works on all symbols (forex, indices, crypto, stocks,
FREE
Linear Regression Trending indicator analyzes price trends by plotting a linear regression channel based on user-defined parameters such as source (for example, close prices), channel length, and deviation multiplier. How It Works: - The indicator calculates a linear regression line over the specified length, forming a channel with upper and lower boundaries offset by the deviation value. - It detects price breaks from the channel and optionally displays broken channel lines (in a customizable
FREE
-- Simple but effective. Inversion Indicator -  What is it? A trend-following overlay indicator that combines SuperTrend logic with exponential curve technology. It detects trend direction, draws a dynamic channel on the chart, and sends real-time alerts when the trend reverses. How does it work? The indicator calculates an exponential baseline using ATR and a SuperTrend factor. When price closes above or below this baseline, a trend reversal is confirmed. A green arrow marks the start of a
FREE
StopLevel
Iurii Tokman
StopLevel   The meter controls the STOPLEVEL level. When the level changes, it signals with an alert. STOPLEVEL - the   minimum offset in points from the current closing price for placing Stop orders, or the minimum allowable stop loss / take profit level in points. A zero value of STOPLEVEL means either the absence of a restriction on the minimum distance for stop loss / take profit, or the fact that the trading server uses external mechanisms for dynamic level control that cannot be transmitte
FREE
Time to Trade Trading timing indicator is based on market volatility through 2 ATR indicators to determine the timing of a transaction. The indicator determines the times when the market has strong volatility in trend. When histogram is greater than 0 (blue) is a strong market, when histogram is less than 0 (yellow) is a weak market. Should only trade within histograms greater than 0. Based on the histogram chart, the first histogram value is greater than 0 and the second histogram appears, this
FREE
Stochastic Signal Pro
Albert Kassina Diatta
What does this indicator do? Stochastic Signal Pro analyzes market momentum using an optimized Stochastic Oscillator to detect: Overbought zones Oversold zones High-probability reversal points It automatically generates Buy and Sell signals directly on the chart. Key Features Buy & Sell arrows No repaint signals Works on MT5 All timeframes All symbols (Forex, Gold, Indices, Crypto) Beginner friendly Lightweight & fast Alerts Included MT5 popup alert Sound alert Push notif
FREE
This Mt5 Indicator Signals when there is two opposite direction bars engulfed by current bar.  has a recent Exponential Moving Average Cross and past bar was oversold/bought Expert Advisor Available in Comments  Free Version Here : https://www.mql5.com/en/market/product/110114?source=Site&nbsp ; Full Alerts for mt5 terminal , phone , email, print to file, print to journal  Buy Signal ( blue line ) Past ema cross ( set at 30 bars back ) Past bar rsi is oversold ( level 40  ) Engulfing bar closes
FREE
WaveTrend Plus
Nguyen Thanh Cong
4.86 (7)
Introduction WaveTrend Plus is an amazing oscillator that can detect optimal entry points in the market with high precision using complex computations of price and momentum. This version packs many improvements compared to the original WaveTrend such as cleaner visuals, oversold/overbought signals and divergence detection Signal Buy when oversold signal appear (green dot below) or when a bullish divergence is detected (green dashed line) Sell when overbought signal appear (red dot above) or
FREE
OWL Divergence Scanner
Gabriel Alejandro Sanchez Lledo
OWL Divergence Scanner is a professional-grade multi-timeframe, multi-symbol divergence detection tool for MetaTrader 5. Built with precision and speed in mind, this advanced scanner automatically identifies Regular and Hidden divergences across your favorite oscillators, helping traders spot high-probability trend reversal and continuation setups before the market moves. Key Features Powerful Divergence Detection — Accurately detects both bullish and bearish regular divergences (for potential r
RSI Divergence MT5 Scanner
Duc Hoan Nguyen
3.33 (3)
Special offer : ALL TOOLS , just $35 each! New tools   will be   $30   for the   first week   or the   first 3 purchases !  Trading Tools Channel on MQL5 : Join my MQL5 channel to update the latest news from me In the dynamic financial markets, identifying trend reversal signals is essential for effective trading. The RSI Divergence Scanner is designed to help you detect RSI divergence signals across various currency pairs and timeframes accurately and efficiently. See more MT4 version at:    R
FREE
The Dual WMA Entry System is a clean, no-nonsense indicator that plots two Weighted Moving Averages directly on your price chart and automatically detects low-momentum (sideways) market conditions. WMA1 is calculated on the open price with a slight offset and acts as a trend bias line. WMA2 is calculated on the close price and acts as a momentum confirmation line. When the distance between the two WMAs narrows, the market is entering consolidation. During these periods, candles are automatically
FREE
Rule Plotter Scanner
Francisco Gomes Da Silva
5 (1)
Have you ever thought about having a scanner that scans all strategies and shows the buy and sell points for all timeframes of that asset, all at the same time? That's exactly what this scanner does. This scanner is designed to display the buy and sell signals you created in the Rule Plotter: strategy creator without programming and run them within this scanner on various assets and different timeframes. The default strategy for Rule Plotter is only bullish and bearish candles. This means that i
FREE
Buyers of this product also purchase
ARIPoint
Temirlan Kdyrkhan
ARIPoint is a powerful trading companion designed to generate high-probability entry signals with dynamic TP/SL/DP levels based on volatility. Built-in performance tracking shows win/loss stats, PP1/PP2 hits, and success rates all updated live. Key Features: Buy/Sell signals with adaptive volatility bands Real-time TP/SL/DP levels based on ATR Built-in MA Filter with optional ATR/StdDev volatility Performance stats panel (Success, Profit/Loss, PP1/PP2) Alerts via popup, sound, push, or email Cu
SuperScalp Pro
Van Minh Nguyen
4.63 (24)
SuperScalp Pro – Advanced Multi-Filter Scalping Indicator System SuperScalp Pro is an advanced scalping indicator that combines the classic Supertrend with multiple intelligent confirmation filters to help identify trading opportunities. It works efficiently across multiple timeframes from M1 to H4, with optimized performance on XAUUSD, BTCUSD, and major Forex pairs. The indicator provides clear Buy and Sell signals, along with automatically calculated entry price, stop loss, and take profit lev
Divergence Bomber
Ihor Otkydach
4.9 (89)
Each buyer of this indicator also receives the following for free: The custom utility "Bomber Utility", which automatically manages every trade, sets Stop Loss and Take Profit levels, and closes trades according to the rules of this strategy Set files for configuring the indicator for various assets Set files for configuring Bomber Utility in the following modes: "Minimum Risk", "Balanced Risk", and "Wait-and-See Strategy" A step-by-step video manual to help you quickly install, configure, and s
Entry In The Zone and SMC Multi Timeframe is a real-time 2-in-1 market analysis tool that combines market structure analysis and a No Repaint BUY / SELL signal system into a single indicator, built on Smart Money Concepts (SMC) — a widely adopted framework used by professional traders to understand market structure. This indicator helps you see the market more clearly, make decisions based on structure rather than guesswork, and focus on high-probability zones where price is more likely to react
Gold Entry Sniper
Tahir Mehmood
5 (9)
Gold Entry Sniper – Professional Multi-Timeframe ATR Dashboard for Gold Scalping & Swing Trading Gold Entry Sniper is a cutting-edge MetaTrader 5 indicator designed to give traders precise buy/sell signals for XAUUSD and other symbols, powered by ATR Trailing Stop logic and a multi-timeframe analysis dashboard . Built for both scalpers and swing traders, it combines real-time market direction , dynamic stop levels , and professional visual dashboards to help you identify high-probability gold en
Power Candles MT5
Daniel Stein
5 (8)
Power Candles V3 - Self-Optimizing Strength Indicator Power Candles V3 turns currency and instrument strength into an actionable trade plan on every chart it is attached to. Instead of just coloring candles, it runs a live auto-optimization in the background and hands you the best Stop Loss, Take Profit and signal threshold for the symbol in front of you. One click adopts it for live trading - entry, Stop Loss and Take Profit rays appear on the chart at the exact prices, and alerts fire with dir
SignalTech MT5 is a fully rule based trading system for EURUSD, USDCHF, USDJPY, AUDUSD, NZDUSD, EURJPY, AUDJPY, NZDJPY, CADJPY.  All the winning trades with chart setups are published on the comments page. 2025-12 1174 Pips 2026-01 2624 Pips 2026-02 2937 Pips 2026-03 2165 Pips 2026-04 2243 Pips It can generate signals with Buy/Sell Arrows and Pop-Up/Sound Alerts. Each signal has clear Entry and Stop Loss levels, which should be automatically flagged on the chart, as well as potential Targets 1,
Gann Made Easy   is a professional and easy to use Forex trading system which is based on the best principles of trading using the theory of W.D. Gann. The indicator provides accurate BUY and SELL signals including Stop Loss and Take Profit levels. You can trade even on the go using PUSH notifications. PLEASE CONTACT ME AFTER PURCHASE TO GET TRADING  INSTRUCTIONS   AND GREAT EXTRA INDICATORS   FOR FREE! Probably you already   heard   about the Gann trading methods before. Usually the Gann theory
Introducing   Quantum Breakout PRO , the groundbreaking MQL5 Indicator that's transforming the way you trade Breakout Zones! Developed by a team of experienced traders with trading experience of over 13 years,   Quantum Breakout PRO   is designed to propel your trading journey to new heights with its innovative and dynamic breakout zone strategy. Quantum Breakout Indicator will give you signal arrows on breakout zones with 5 profit target zones and stop loss suggestion based on the breakout b
New Update of   Smart Trend Trading System MT5 For  2026 Market: If You Buy this Indicator you will Get my Professional Trade Manager + EA  for FREE . First of all Its worth emphasizing here that this Trading System is Non-Repainting   , Non Redrawing and Non Lagging Indicator Which makes it ideal from both manual and robot trading .  [Online course] , [manual] and [download presets] . The Smart Trend Trading System MT5 is a comprehensive trading solution tailored for new and experienced traders
Let's be honest first. No indicator will make you profitable on its own. If someone tells you otherwise, they're selling you a dream. Every indicator that shows perfect buy/sell arrows can be made to look flawless — just zoom into the right window of history and screenshot the winners. We won't do that. SMC Intraday Formula is a tool. It reads the market structure for you, maps the highest-probability price zones, and tells you exactly what the smart money footprint looks like right now — in pl
Azimuth Pro
Ottaviano De Cicco
5 (7)
Azimuth Pro V2: Synthetic Fractal Structure and Confirmed Entries for MT5 Overview Azimuth Pro is a multi-level swing structure indicator by Merkava Labs . Four nested swing layers, swing-anchored VWAP, ABC pattern detection, three-timeframe structural filtering, and closed-bar confirmed entries — one chart, one workflow from micro-swings to macro-cycles. This is not a blind signal product. It is a structure-first workflow for traders who care about location, context, and timing. V2 Launch Offe
Meridian Pro
Ottaviano De Cicco
5 (2)
Meridian Pro 2.00: Professional Multi-Timeframe Trend Matrix for MT5 Meridian Pro 2.00 is a professional adaptive trend matrix for MetaTrader 5. It combines the original Meridian trend engine, a clean chart ribbon, closed-bar signal arrows, an 8-timeframe dashboard, Fuel momentum, weighted consensus, synthetic HTF processing and chart-native higher-timeframe context lines. The goal is simple: read current trend, multi-timeframe structure, strength, momentum and EA-ready state from one discipline
Quantum TrendPulse
Bogdan Ion Puscasu
5 (25)
Introducing Quantum TrendPulse , the ultimate trading tool that combines the power of SuperTrend , RSI , and Stochastic into one comprehensive indicator to maximize your trading potential. Designed for traders who seek precision and efficiency, this indicator helps you identify market trends, momentum shifts, and optimal entry and exit points with confidence. Key Features: SuperTrend Integration: Easily follow the prevailing market trend and ride the wave of profitability. RSI Precision: Detect
FX Trend MT5 NG
Daniel Stein
5 (4)
FX Trend NG: The Next Generation Multi-Market Trend Intelligence Overview FX Trend NG is a professional multi-timeframe trend and market monitoring tool designed to give you a complete structural overview of the market in seconds. Instead of switching between dozens of charts, you instantly see which symbols are trending, where momentum is fading, and where strong alignment exists across timeframes. This tool is part of the Stein Investments ecosystem - 18+ tools plus Max, your 1-on-1 AI tradi
First of all Its worth emphasizing here that this Trading Tool is Non Repainting , Non Redrawing and Non Lagging Indicator , Which makes it ideal for professional trading . [Online course] ,   and   [manual] The Smart Price Action Concepts Indicator is a very powerful tool for both new and experienced traders . It packs more than 20 useful indicators into one , combining advanced trading ideas like Inner Circle Trader Analysis and Smart Money Concepts Trading Strategies . This indicator focuses
This dashboard shows the latest available   harmonic patterns   for the selected symbols, so you will save time and be more efficient /   MT4 version . Free Indicator:   Basic Harmonic Pattern Comparison of "Basic Harmonic Pattern" vs. "Basic Harmonic Patterns Dashboard" Indicators Feature Basic Harmonic Pattern Basic Harmonic Patterns Dashboard Functionality Detects and displays harmonic patterns on a single chart Searches multiple symbols and timeframes for harmonic patterns, displays res
Atomic Analyst MT5
Issam Kassas
3.94 (31)
New Update of   Atomic Analyst MT5 For  2026 Market: If You Buy this Indicator you will Get my Professional   Trade Manager + EA  for   FREE . First of all Its worth emphasizing here that this Trading Indicator is   Non-Repainting   , Non Redrawing and Non Lagging Indicator   Indicator, Which makes it ideal from both manual and robot trading.  User manual: settings, inputs and strategy . The Atomic Analyst  is a PA Price Action Indicator that uses Strength and Momentum of the price to find a bet
KT Alpha Hunter Arrows MT5
KEENBASE SOFTWARE SOLUTIONS
Most arrow indicators give you a signal and leave you to figure out the rest. KT Alpha Hunter Arrows gives you the full trading plan. Every signal arrow prints with a full plan already drawn: entry line, stop-loss, four take-profit levels, and a live edge verdict telling you whether this symbol and time-frame is worth trading right now. An included Trade Manager EA handles the execution after you enter, so discipline stays intact when the market gets loud. Non-repaint. Closed-bar signals only. B
FX Power MT5 NG
Daniel Stein
5 (31)
FX Power: Analyze Currency Strength for Smarter Trading Decisions Overview FX Power is your go-to tool for understanding the real strength of currencies and Gold in any market condition. By identifying strong currencies to buy and weak ones to sell, FX Power simplifies trading decisions and uncovers high-probability opportunities. Whether you’re looking to follow trends or anticipate reversals using extreme delta values, this tool adapts seamlessly to your trading style. Don’t just trade—trade
Trend Screener Pro MT5
STE S.S.COMPANY
4.85 (104)
Trend Screener Indicator --Professional Trend Trading & Market Scanning System for MetaTrader Unlock the true power of trend trading with Trend Screener Indicator — a complete multi-currency, multi-timeframe trend analysis solution powered by Fuzzy Logic,Trend Pulse Technology  and advanced market structure algorithms.   Trend Screener transforms your MetaTrader platform into a professional-grade Trend Analyzer and Market Scanner, helping you identify high-probability trend opportunities, early
Grabber System MT5
Ihor Otkydach
4.83 (23)
Let me introduce you to an excellent technical indicator – Grabber, which works as a ready-to-use "All-Inclusive" trading strategy. Within a single code, it integrates powerful tools for technical market analysis, trading signals (arrows), alert functions, and push notifications. Every buyer of this indicator also receives the following for free: Grabber Utility for automatic management of open orders Step-by-step video guide: how to install, configure, and trade with the indicator Custom set fi
Top indicator for MT5   providing accurate signals to enter a trade without repainting! It can be applied to any financial assets:   forex, cryptocurrencies, metals, stocks, indices .  Watch  the video  (6:22) with an example of processing only one signal that paid off the indicator! MT4 version is here It will provide pretty accurate trading signals and tell you when it's best to open a trade and close it. Most traders improve their trading results during the first trading week with the help of
Market Structure Order Block Dashboard MT5 is an MT5 indicator designed for traders who want to read market structure and the main price reaction zones directly on the chart. It combines BOS, ChoCH, Order Blocks, Fair Value Gaps (FVG), Liquidity, Kill Zones, Volume Profile, and a compact dashboard for quick analysis. This indicator targets traders who use market structure, ICT and Smart Money concepts as a decision framework. It can help spot trend continuations, possible reversals, price imbala
RelicusRoad Pro MT5
Relicus LLC
4.96 (24)
RelicusRoad Pro: Quantitative Market Operating System 70% OFF LIFETIME ACCESS (LIMITED TIME) - JOIN 2,000+ TRADERS Why do most traders fail even with "perfect" indicators? Because they trade Single Concepts in a vacuum. A signal without context is a gamble. To win consistently, you need CONFLUENCE . RelicusRoad Pro is not a simple arrow indicator. It is a complete Quantitative Market Ecosystem . It maps the "Fair Value Road" price travels on, distinguishing between random noise and true structur
Trend Forecaster
Alexey Minkov
5 (7)
Trend Forecaster – Since 2023. The Trend Forecaster indicator utilizes a unique proprietary algorithm to determine entry points for a breakout trading strategy. The indicator identifies price clusters, analyzes price movement near levels, and provides a signal when the price breaks through a level. The Trend Forecaster indicator is suitable for all financial assets, including currencies (Forex), metals, stocks, indices, and cryptocurrencies. You can also adjust the indicator to work on any time
Btmm state engine pro
Garry James Goodchild
5 (4)
BTMM State Engine Pro is a MetaTrader 5 indicator for traders who use the Beat The Market Maker approach: Asian session context, kill zone timing, level progression, peak formation detection, and a multi-pair scanner from a single chart. It combines cycle state logic with a built-in scanner dashboard so you do not need the same tool on many charts at once. What it does Draws the Asian session range; session times can follow broker server offset or be set in inputs. Tracks level progression (L
Trend Lines PRO MT5
Roman Podpora
5 (1)
TREND LINES PRO  -   helps understand where the market is truly changing direction. The indicator shows real trend reversals and points where major players re-enter. You see   BOS lines   Trend changes and key levels on higher timeframes — without complex settings or unnecessary noise. Signals don't repaint and remain on the chart after the bar closes. MT4 VERSION   - Reveals its maximum potential when combined with the   RFI LEVELS PRO   indicator What the indicator shows: Real shifts   trend
Weltrade Spike Sentinel
Batsirayi L Marango
5 (1)
Introducing Indicator for PainX and GainX Indices Traders on Weltrade Get ready to experience the power of trading with our indicator, specifically designed for Weltrade   broker's PainX and GainX Indices.  Advanced Strategies for Unbeatable Insights Our indicator employs sophisticated strategies to analyze market trends, pinpointing optimal entry and exit points.  Optimized for Maximum Performance To ensure optimal results, our indicator is carefully calibrated for 5-minute timeframe charts on
RFI levels PRO MT5
Roman Podpora
3.67 (3)
The indicator accurately shows the reversal points and price return zones where the   Major players . You see where new trends are forming and make decisions with maximum precision, maintaining control over every trade. VERSION MT4     -    Reveals its maximum potential when combined with the   TREND LINES PRO   indicator What the indicator shows: Reversal structures and reversal levels with activation at the beginning of a new trend. Display of   TAKE PROFIT   and   STOP LOSS   levels with min
More from author
Trend BB MACD
Andres Felipe Carvajal Rodriguez
5 (3)
Trend BB MACD with ADX Filter The Trend BB MACD with ADX Filter is an advanced technical tool that combines Bollinger Bands (BB) , MACD , and the Average Directional Index (ADX) . It now incorporates a complete directional analysis system with +DI and -DI , as well as cross-confirmation options with MACD. This tool is designed to provide precise and filtered trading signals, optimized for scalping , intraday, and swing trading. It helps identify not only the direction but also the strength and r
FREE
StochWpR Momentum Oscillator
Andres Felipe Carvajal Rodriguez
5 (2)
StochW%R Momentum Oscillator – Your Smart Hybrid Momentum Indicator Precision. Noise Filtering. More Reliable. Tired of traditional oscillators generating false signals in volatile markets? The StochW%R Momentum Oscillator is the evolution in momentum analysis, combining the best of the Stochastic and Williams %R into one powerful, customizable indicator. Key Benefit: It reduces market noise and provides cleaner signals thanks to its intelligent fusion algorithm, with early alerts for trend chan
FREE
Theme Switcher
Andres Felipe Carvajal Rodriguez
Theme Switcher - Personalize Your Trading Terminal Description The Theme Switcher is an interactive panel that lets you quickly change the color scheme of your MetaTrader 5 chart. Designed for traders seeking a comfortable and personalized visual environment, This tool offers a variety of theme styles inspired by brands, movies, and professional designs. How to Use It Open the panel: Simply add the indicator to your chart, and a window with buttons for different themes will appear. Select a them
FREE
Correlation Nexus
Andres Felipe Carvajal Rodriguez
Correlation Nexus Correlation Nexus: Master the Direct or Inverse Relationship Between Pairs Correlation Nexus is an advanced technical indicator for MetaTrader 5 that detects trading opportunities based on the statistical correlation between two financial instruments. This system allows traders to profit from both positive (direct) correlations and negative (inverse) correlations , adapting dynamically to different currency pairs, indices, or commodities. Unlike conventional tools, this indicat
FREE
Projective SR
Andres Felipe Carvajal Rodriguez
Projective SR - Real-Time Projected Support and Resistance Projective SR is an advanced indicator that automatically detects key support and resistance points on the chart and projects them diagonally and dynamically into the future , anticipating potential areas where the price might react. Unlike traditional indicators that only show static, fixed levels, Projective SR analyzes price geometry , identifies the most relevant pivots, and draws sloping lines that adapt to market movement. These li
FREE
Adaptive Fibonacci Zones
Andres Felipe Carvajal Rodriguez
The Adaptive Fibonacci Zones is an enhanced, dynamic version of the classic MetaTrader 5 Fibonacci retracement. Its main difference from the native Fibonacci tool is that you don't need to manually draw the levels or subjectively decide where to measure the retracement from. The indicator does this work for you: it automatically detects relevant market swings (highs and lows) using fractals and an ATR-based volatility filter. This way, the Fibonacci adapts to the market in real time, displaying
FREE
Virtual Candle Blocks
Andres Felipe Carvajal Rodriguez
Virtual Candle Blocks – Visualize the market without limits Virtual Candle Blocks is an advanced indicator for MetaTrader 5 that allows you to create and visualize candles of any custom timeframe, including those not natively available on the platform. Key Features: Custom Timeframes: It groups base chart candles into blocks of your desired duration (e.g., 5h, 14h, 28h, 72h, etc.) to form a new virtual candle. This gives you access to exclusive timeframes found on premium platforms like TradingV
FREE
Laguerre RSI Classic
Andres Felipe Carvajal Rodriguez
Laguerre RSI: An Advanced Oscillator for Market Analysis The Laguerre RSI is an advanced oscillator based on digital filters, developed by John Ehlers. This indicator smooths price fluctuations using a technique called the Laguerre filter , allowing for more precise detection of overbought and oversold zones while reducing market noise. The Laguerre RSI oscillates between 0 and 1 , with standard levels set as follows: Overbought: above 0.75 Oversold: below 0.25 This indicator is ideal for detect
FREE
Smart Volume Flow
Andres Felipe Carvajal Rodriguez
Smart Volume Flow The Smart Volume Flow is a professional volume analysis tool that takes order flow interpretation to a higher level. It's designed to go beyond simple bar counting by combining hybrid volume , trend context , multi-timeframe filters , and directional strength validation (ADX and +DI/-DI) . Its goal is to dissect, weight, and contextualize market activity, transforming raw data into tactical information for more precise decision-making. What Makes It Different? Unlike MetaTrader
Pro MA 5
Andres Felipe Carvajal Rodriguez
Pro MA 5 – The Professional Moving Average Suite  The Most Complete Moving Average System for MetaTrader 5 Pro MA 5 revolutionizes technical analysis by offering a powerful, customizable, and efficient interface to detect trends with surgical precision .  What is Pro MA 5? It's an advanced indicator that integrates up to 5 configurable moving averages with intelligent alerts , an interactive panel , and an optimized design for trading on any instrument or timeframe. It's an all-in-one solution
FREE
Trading Exporter for AI Assistant
Andres Felipe Carvajal Rodriguez
Trading Exporter for AI Assistant is a professional indicator for MetaTrader 5 designed to export comprehensive and structured trading data in JSON format. Its purpose is to enable any Artificial Intelligence (AI) assistant—whether free or paid, such as ChatGPT, Gemini, Copilot, Claude, or DeepSeek—to analyze the information and provide personalized recommendations, strategies, and explanations. Special Recommendation: DeepSeek While this exporter works with any AI, DeepSeek is especially recomm
FREE
Advanced ADX Pro
Andres Felipe Carvajal Rodriguez
Advanced ADX Pro: Take Your ADX Analysis to the Next Level  The Advanced ADX Pro is an advanced trading tool designed to transform your experience with the traditional Average Directional Index (ADX) indicator. Created to offer greater convenience, control, and visual and auditory clarity, this indicator goes far beyond the capabilities of MetaTrader 5's (MT5) native ADX.  What is ADX and Why is it Crucial? The ADX is a vital technical indicator that measures the strength of the market trend . I
Trading Advisor a Helping Hand
Andres Felipe Carvajal Rodriguez
Trading Advisor - A Helping Hand This indicator is designed to advise and support traders in their operations, offering real-time quantitative market analysis. It is not an automated decision-making tool, but an intelligent assistant that provides: Market diagnosis (bullish/bearish trend, range, volatility) General recommendations (when to buy, sell, or wait) Suggested risk management (Stop Loss and Take Profit based on ATR) Psychological tips for maintaining discipline It's ideal for traders lo
FREE
Scalping Timer
Andres Felipe Carvajal Rodriguez
Scalping Timer – Real-Time Precision for Demanding Scalpers Scalping Timer is a compact visual indicator designed specifically for scalpers and day traders who rely on perfect timing and minimum transaction costs . This real-time panel displays two essential metrics for scalping: Exact countdown of the remaining time until the candle closes as set on the chart. Immediate visualization of the current symbol's spread. With this critical information at your fingertips, you can anticipate sharp move
FREE
LCD Laguerre Convergence Divergence
Andres Felipe Carvajal Rodriguez
LCD Laguerre Convergence Divergence: An Advanced MACD The LCD Laguerre Convergence Divergence is an advanced technical indicator designed to improve upon the classic MACD, offering faster, more sensitive, and adaptive momentum detection. Its key advantage is the use of Laguerre filters , which react more precisely to price changes than traditional moving averages. Key Advantages Higher Sensitivity & Less Lag: Laguerre filters generate earlier entry and exit signals, which is crucial in volatile
FREE
Pi Cycle Projections
Andres Felipe Carvajal Rodriguez
What is Pi Cycle Projections? Pi Cycle Projections is a comprehensive trading system for MetaTrader 5 that gives you a dual advantage: it not only identifies high-probability entry signals (Moving Average crossover) in the present but also charts a visual map of potential future market scenarios. Think of it as a two-in-one system: An Intelligent Signal Generator that tells you when to act (Pi moving average crosses). A Strategic Cycle Projector that shows you where the price could go. Both func
FREE
Hourly Bias Scanner
Andres Felipe Carvajal Rodriguez
Discover the secrets big players don't want you to see. Have you ever wondered if the market's "whales" always enter at the same time and in the same direction? This indicator shows you. It doesn't give entry signals, but it reveals historical patterns of movement by hour or day that would normally go unnoticed. For example, you could discover that on Thursdays at 3:00 PM, EURUSD has an 80% probability of moving upwards . It's ideal for traders who want to confirm hourly biases or identify high
FREE
Real Time Synthetic FX Rate
Andres Felipe Carvajal Rodriguez
Real-Time Synthetic FX Rate Real-Time Synthetic FX Rate is an advanced indicator designed to calculate a robust, synthetic exchange rate estimate for any currency pair available on your broker (including Majors, Minors, and Exotics). Its goal is to offer a dynamic reference that reflects price formation minute-by-minute , providing an orientational guide before the publication of official rates or institutional validations. How It Works: The Robust Hybrid Model The indicator generates its synthe
FREE
SOS Trader
Andres Felipe Carvajal Rodriguez
This indicator is an advanced loss position monitor, designed to help you react in time and protect your capital. It analyzes all open trades on the current symbol in real-time, calculates volatility using ATR on multiple timeframes, and determines how close the price is to your Stop Loss. It displays visual lines ( dynamic Stop Loss and Break-Even ) and a Bloomberg-style panel with key information for each trade: Loss percentage relative to your balance Distance to Stop Loss in pips and ATR mul
FREE
Alert Signal Chess King Trading Opening
Andres Felipe Carvajal Rodriguez
"The Chess Strategy Applied to Forex Trading" Imagine the market as a chessboard. Each technical indicator is a unique and powerful piece, with its own distinct function. This intelligent system combines six key "pieces" that work in harmony to detect high-probability entry signals: Pawn (EMA 50): Your nimble scout, detecting rapid changes in the short-term trend. Rook (EMA 200): A steadfast fortress, confirming the overarching major market trend. Knight (Bollinger Bands): Agile and unpredictab
DominoSync DoubleSix
Andres Felipe Carvajal Rodriguez
DominoSync DoubleSix: An Advanced Indicator for Confident Trading DominoSync DoubleSix is an advanced indicator that helps traders identify more reliable entry signals by analyzing multiple timeframes and filtering out low-volume or unusual range candles. The entry signals are displayed on the indicator's histogram, allowing for a clearer, less intrusive analysis on the price chart. What Makes DominoSync DoubleSix Unique? Multi-Timeframe Analysis Evaluates up to 20 timeframes (from M1 to W1). Ca
AUI Eagle Duel
Andres Felipe Carvajal Rodriguez
AUI Bot - Artificial Ultra Instinct ATTENTION: This bot is NOT for you if you're looking for daily, weekly, or monthly profits. This bot is designed solely for ANNUAL profitability . So, if you're not willing to let it work quietly for an entire year without intervention, it's not for you. How Does This Bot Work? The bot analyzes multiple market factors across different timeframes to make very strict decisions. It only enters an operation when it detects a perfect confluence of favorable conditi
TDI Laguerre
Andres Felipe Carvajal Rodriguez
TDI Laguerre The TDI Laguerre is an evolution of the popular Traders Dynamic Index (TDI) indicator. It replaces the classic RSI with a Laguerre filter , offering a smoother, more sensitive, and precise reading of price action. This advanced version combines elements of volatility, moving averages, and visual signal detection with configurable alerts.  What Does This Indicator Do? This indicator displays: A smoothed Laguerre line based on the closing price. A short-term EMA signal line overlaid
BB KC Hybrid Squeeze Band
Andres Felipe Carvajal Rodriguez
BB KC Hybrid Squeeze Band – Advanced Volatility and Compression Indicator The BB KC Hybrid Squeeze Band is a next-generation technical indicator that intelligently combines Bollinger Bands (BB) and the Keltner Channel (KC) into a single hybrid structure. Designed to provide a more accurate reading of market volatility, compression, and expansion environments, this indicator allows for the detection of key opportunity zones with greater anticipation and less noise. What Does It Do? Dynamic Hybrid
MarketCrack Whale Detector
Andres Felipe Carvajal Rodriguez
MarketCrack – Whale Detector: Aligning with Smart Money MarketCrack – Whale Detector is a professional indicator designed to visually and proactively detect the activity of large market participants, known as "whales." Its purpose is to identify key moments of significant institutional pressure, allowing traders to align with the direction of smart money and make strategic decisions with greater confidence. Functionality and Objective MarketCrack – Whale Detector analyzes price action and volume
GoGo Breaker The Master Candle Signal
Andres Felipe Carvajal Rodriguez
GoGo Breaker – The Master Candle Signal Smart Signals Based on Price Action with Advanced Filters GoGo Breaker is a powerful trading indicator that uses the "Master Candle" pattern to identify high-probability opportunities in real-time. Designed for traders seeking fast and precise entries , it is ideal for scalping, intraday, and swing trading . Automatically detects buy/sell signals with clear arrows. Works in all markets: Forex, indices, commodities, and cryptocurrencies. Flexible: Can be us
MultiFrame Momentum
Andres Felipe Carvajal Rodriguez
MultiFrame Momentum Indicator The MultiFrame Momentum is an advanced indicator that simultaneously analyzes multiple market timeframes to identify moments of directional convergence . Its unique design seeks momentum coincidences across different timeframes, generating clear visual signals via a line that changes between green (bullish) , red (bearish) , and gray (neutral) . Essential Configuration and Testing The indicator's effectiveness is entirely dependent on the customized timeframe config
Legion of Soldiers
Andres Felipe Carvajal Rodriguez
Legion of Soldiers – User Manual Main Focus The Legion of Soldiers is designed as an indicator for re-entries within established trend-following strategies . This indicator doesn't define the trend itself; instead, it is used to accompany and reinforce a pre-identified trend system . The direction of the trend must be confirmed beforehand using tools like: MarketCrack – Whale Detector (recommended) Or any other high-timeframe trend detection strategy the user employs. How to Use The user should
Oracle Oscillator
Andres Felipe Carvajal Rodriguez
Here is the coherent translation of the text into English: The Oracle Oscillator is a true revolution in technical analysis. Instead of forcing the trader to watch multiple oscillators at the same time—like RSI, Stochastic, Williams %R, DeMarker, and the Laguerre Filter—this indicator unifies the best of each into a single hybrid line (DodgerBlue color), perfectly calibrated to be reactive to real movements while filtering out market noise , thus avoiding the false impulses that confuse so many
Dragon Bands Z
Andres Felipe Carvajal Rodriguez
Dragon Bands Z: Visual Trend Analysis Indicator Dragon Bands Z is an indicator designed to simplify chart reading through the visual consolidation of multiple technical sources. Its objective is to provide a clear indication of market direction and strength, without the need for charts cluttered with numerous individual indicators. The indicator uses a hybrid color fill to translate price action into four primary visual states: Green: Indicates a predominant upward directional force. Red: Confir
Filter:
No reviews
Reply to review