Virtual Candle Blocks
- Indicators
-
Andres Felipe Carvajal Rodriguez
 I do not develop indicators to follow the market. I develop algorithms to understand it.
My goal is to transform price complexity into objective, robust, and efficient tools that help traders make decisions with greater precision, consistency, and risk control. - Version: 1.1
- Updated: 9 August 2025
Virtual Candle Blocks – Visualize the market without limits
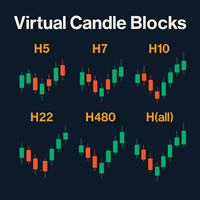
Virtual Candle Blocks is an advanced indicator for MetaTrader 5 that allows you to create and visualize candles of any custom timeframe, including those not natively available on the platform.
Key Features:
-
Custom Timeframes: It groups base chart candles into blocks of your desired duration (e.g., 5h, 14h, 28h, 72h, etc.) to form a new virtual candle. This gives you access to exclusive timeframes found on premium platforms like TradingView.
-
Clear Visualization: The indicator draws virtual candles with a body and wick directly on the chart. You can customize colors, body width, and choose whether to display wicks for a pure price action analysis.
-
Fully Customizable: It includes a minimalist panel that shows the selected virtual timeframe. The indicator is compatible with all MT5 drawing tools, allowing you to mark support, resistance, and trendlines on top of the virtual candles.
-
Advanced Analysis: Use the chart's native timeframe as a "zoom" function to inspect the internal structure of each virtual candle, enhancing your ability to detect patterns and trend changes.
Ideal for:
-
Price action traders who prefer a clean, distraction-free chart.
-
Technical analysts who use non-standard timeframes to gain a visual and conceptual edge.
Usage Recommendation:
For a clean, non-overlapping view, we suggest hiding the original MetaTrader candles by setting the chart colors to "None." This way, you will only see the virtual candles.
Important Note:
The price calculation for the virtual candles is always accurate. In some cases, if the virtual timeframe is not an exact multiple of the base chart's timeframe, the wick may appear slightly misaligned. This is a visual issue only and can be corrected by changing the base chart's timeframe.