Smart Volume Flow
- Indicators
-
Andres Felipe Carvajal Rodriguez
 I do not develop indicators to follow the market. I develop algorithms to understand it.
My goal is to transform price complexity into objective, robust, and efficient tools that help traders make decisions with greater precision, consistency, and risk control. - Version: 1.3
- Updated: 24 January 2026
- Activations: 12
Smart Volume Flow
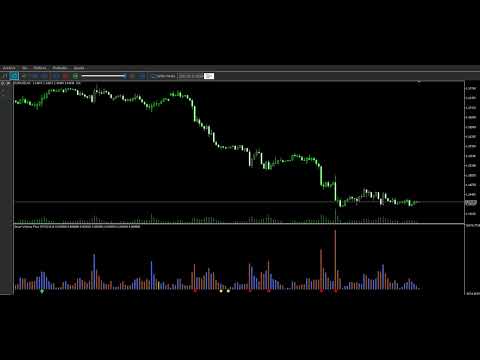
The Smart Volume Flow is a professional volume analysis tool that takes order flow interpretation to a higher level. It's designed to go beyond simple bar counting by combining hybrid volume, trend context, multi-timeframe filters, and directional strength validation (ADX and +DI/-DI).
Its goal is to dissect, weight, and contextualize market activity, transforming raw data into tactical information for more precise decision-making.
What Makes It Different?
Unlike MetaTrader 5's native volume indicator, which only shows the total volume per bar, the Smart Volume Flow analyzes how and where that volume occurs. It identifies institutional patterns like accumulation, distribution, climax, and absorption, confirming them with the trend's direction and strength.
Key Features
-
Weighted Hybrid Volume It combines real and tick volume, applying corrective factors based on:
-
Bar range (the relationship between price movement and its average range).
-
Intra-bar delta (the difference between the close and open). This helps to differentiate:
-
High volume in a small bar → possible absorption or accumulation.
-
High volume in a wide bar → possible movement climax.
-
-
Immediate Visual Classification (HISTOGRAM)
-
Bullish Volume – dominant buying pressure.
-
Bearish Volume – significant selling pressure.
-
Neutral Volume – equilibrium or indecision. Colors are fully customizable.
-
-
Automatic Detection of Key Events a) Volume Climax
-
Detects abnormally high volume spikes compared to the mean and standard deviation.
-
Continuation: Confirms the trend's direction (marked in DodgerBlue or OrangeRed).
-
Reversal: Alerts to exhaustion and a potential turnaround (marked in magenta). b) Absorption
-
Identifies candles with long wicks and small bodies in high-volume areas, signaling institutional absorption.
-
Marked with yellow circular dots.
-
-
Integrated Trend Context
-
Uses two EMAs (short and long) to measure trend direction and strength.
-
Filters out signals that go against the prevailing context.
-
Validation with ADX and +DI/-DI:
-
Only shows signals if there is sufficient trend strength.
-
Filters weak absorptions and climaxes.
-
-
-
Smart Multi-Timeframe (MTF) Filter
-
Synchronizes the analysis with the next higher timeframe.
-
Avoids trading against the dominant trend of larger timeframes.
-
Reduces false positives on smaller timeframes.
-
Maintains consistency with institutional flow from larger timeframes.
-
-
Color System
-
Bullish Continuation: Green
-
Bearish Continuation: Red
-
Reversal: Magenta
-
Absorption: Gold
-
Colors are fully customizable from the parameters panel.
-
-
Flexible Customization
-
Adjust thresholds, lookbacks, ADX filters, and enable/disable signals by type.
-
Adaptable for scalping, intraday, or swing trading.
-
Compatible with any asset and timeframe.
-
-
Signal Alert System
-
Detects key trading events through volume and price analysis, verifies conditions with MTF and ADX filters, and generates alerts via pop-up, email, or push notifications.
-
Recommended Timeframes
-
H1 and H4: Cleaner signals and clearer contexts.
-
M30 - M15: Recommended for intraday. Higher timeframes reduce noise and better show the institutional footprint.
-
M5: Fast trading.
Operational Advantages
-
Detects exhaustion and continuations early.
-
Highlights critical zones of accumulation/distribution.
-
Allows you to trade aligned with the dominant force and direction.
-
It turns volume into an x-ray of the market: From "how much was traded" to "what the trading means".