Dragon Bands Z
- Indicators
-
Andres Felipe Carvajal Rodriguez
 I do not develop indicators to follow the market. I develop algorithms to understand it.
My goal is to transform price complexity into objective, robust, and efficient tools that help traders make decisions with greater precision, consistency, and risk control. - Version: 1.0
- Activations: 12
Dragon Bands Z: Visual Trend Analysis Indicator
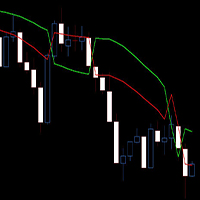
Dragon Bands Z is an indicator designed to simplify chart reading through the visual consolidation of multiple technical sources. Its objective is to provide a clear indication of market direction and strength, without the need for charts cluttered with numerous individual indicators.
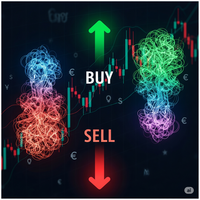
The indicator uses a hybrid color fill to translate price action into four primary visual states:
-
Green: Indicates a predominant upward directional force.
-
Red: Confirms a predominant downward directional force.
-
Yellow: Suggests a phase of low volatility or consolidation.
-
Gray: Signals market indecision, suggesting the need to wait for directional confirmation.
This methodology allows for a quick assessment of the current trend. Unlike analyzing several indicators separately, Dragon Bands Z merges the analysis for a unified view.
Key Features
-
Visual Clarity: Translates complex technical information into a simple color code.
-
Multi-Timeframe Analysis: Includes a panel to confirm the signal or trend across other timeframes, which helps align trades with the greater trend.
-
Versatility: It is suitable for analysis in both short timeframes (scalping) and long timeframes (swing trading), as its core functionality focuses on confirming directions.
Dragon Bands Z aims to be a support tool that enhances your current strategy, eliminating visual clutter to leave only the essential trend information.
Dragon Bands Z (Technical Information)
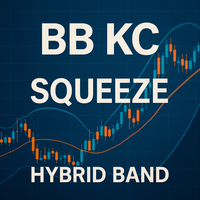
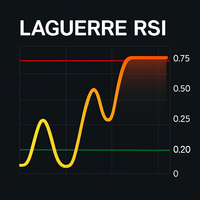
Dragon Bands Z was designed to enhance market interpretation through a three-layer hybrid architecture. The first layer, Hybrid Bands (Bollinger + Keltner + Envelopes), generates an adaptive channel that responds better to real volatility and avoids false breakouts typical of each system when used separately. The second layer, the Signal Engine (ADX + MACD + Stochastic), integrates trend direction and strength based on a tripartite consensus, reducing the subjectivity of isolated signals. The third layer, the Momentum Filter (RSI + Williams %R), validates that price acceleration accompanies the main direction, eliminating misleading divergences. All this information is translated into a simplified four-color visual output, where each tone represents the direct synthesis of technical consensus: bullish, bearish, compression, or conflict. The result is a tool that condenses the power of seven indicators into a single, clear, and actionable reading, maximizing precision and decision speed.