Adaptive Fibonacci Zones
- Indicators
- Andres Felipe Carvajal Rodriguez
- Version: 1.0
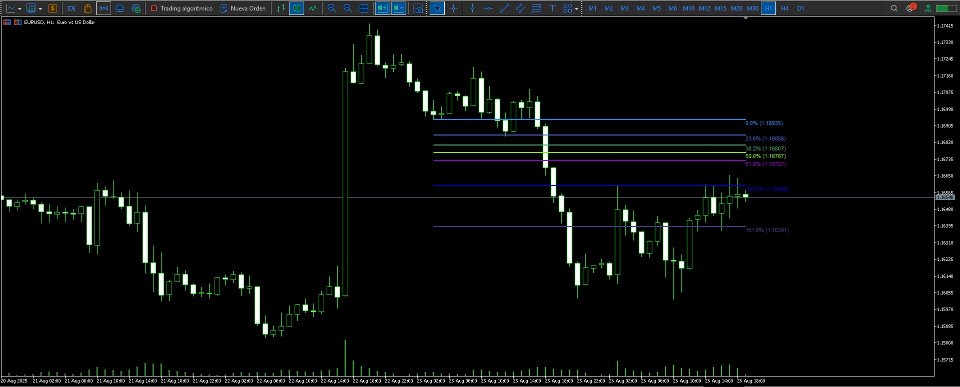
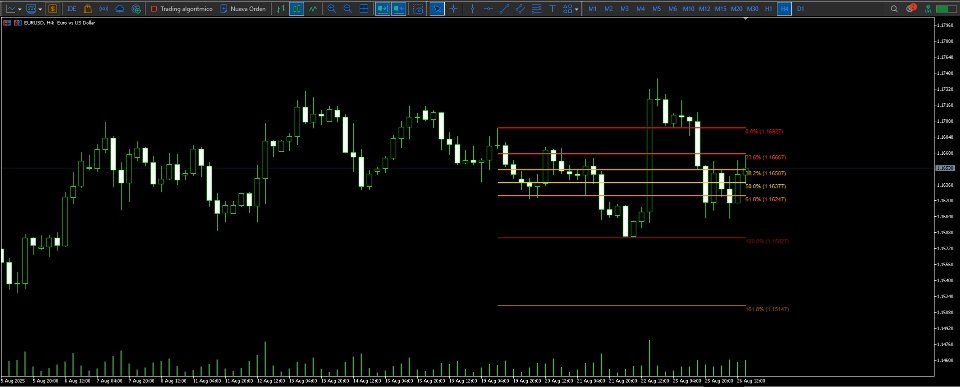
The Adaptive Fibonacci Zones is an enhanced, dynamic version of the classic MetaTrader 5 Fibonacci retracement. Its main difference from the native Fibonacci tool is that you don't need to manually draw the levels or subjectively decide where to measure the retracement from.
The indicator does this work for you: it automatically detects relevant market swings (highs and lows) using fractals and an ATR-based volatility filter. This way, the Fibonacci adapts to the market in real time, displaying more realistic and useful levels for identifying potential support and resistance zones.
Advantages Over the Native MT5 Fibonacci
-
Automatic and Adaptive: The native Fibonacci requires you to draw the levels manually. This indicator finds the most relevant swings automatically.
-
More Realistic: It filters out false swings using ATR (volatility), preventing levels from appearing during minor, irrelevant movements.
-
Dynamic Colors: The color scheme changes based on the trend direction (bullish or bearish).
-
Bullish → cool tones: blue, green, purple.
-
Bearish → warm tones: red, orange, gold.
-
-
Price Labels: Each level not only shows the Fibonacci percentage but also the exact real-time price.
Important: Lag and Repainting
Like any indicator based on fractals and retrospective data, this indicator repaints. This means the Fibonacci levels you see today may move in the future if the price forms a new higher or lower swing.
This is not an indicator error, but an inherent characteristic of fractal logic. The current swing is "valid" until a new fractal surpasses it.
Practical Implications:
-
Current levels can change retroactively.
-
It's not recommended for manual backtesting or entries on the current bar.
-
It's ideal as a visual analysis tool and for planning your trades.
-
"The indicator is excellent for detecting potential support and resistance zones but should not be used as the sole basis for a decision. It's best to confirm with price action or other indicators."
What Happens When the Fibonacci Appears Far Back on the Chart?
Sometimes, the detected swing is very far from the current price, causing the Fibonacci levels to appear very close together and not very useful. This happens because the market hasn't yet formed a new valid nearby swing, so the indicator continues to use an older swing as a reference.
Recommendation:
If you notice that the levels are too compressed and far from the current price:
-
Switch to a lower timeframe so the indicator can find more recent and relevant swings.
-
This will give you a Fibonacci that is more closely aligned with the current market movement.
If you don't change the timeframe, you must understand that the levels you see correspond to major reference zones but don't accurately reflect recent price behavior.
In Summary
-
It's an automatic and adaptive Fibonacci: it detects real swings, filters with ATR, and updates levels in real time.
-
It uses different colors for bullish (cool) and bearish (warm) trends.
-
It does repaint because it's based on fractals, but this makes it more dynamic and realistic for visual analysis.
-
If the Fibo is too far away and the lines look compressed, simply change the timeframe to get more useful levels.
It's an ideal tool for visualizing key market zones and planning trades, but it should always be used to complement other analysis techniques.
