Technische Indikatoren für den MetaTrader 4

Gann Made Easy ist ein professionelles und einfach zu bedienendes Forex-Handelssystem, das auf den besten Handelsprinzipien unter Verwendung der Theorie von Mr. basiert. W.D. Gann. Der Indikator liefert genaue KAUF- und VERKAUFSsignale, einschließlich Stop-Loss- und Take-Profit-Levels. Mit PUSH-Benachrichtigungen können Sie auch unterwegs handeln. BITTE KONTAKTIEREN SIE MICH NACH DEM KAUF, UM KOSTENLOS HANDELSTIPPS, BONUSSE UND DEN GANN MADE EASY EA ASSISTANT ZU ERHALTEN! Wahrscheinlich haben Si

NEUJAHRESVERKAUF 2026 PREIS FÜR NUR 99 DOLLAR Wenige Exemplare zu diesem Preis vom 10. Januar bis 20. Januar MITTERNACHT Letztes Angebot Sichern Sie sich Ihr Exemplar an diesem Silvesterabend Der Preis wird nach Ablauf des Angebotszeitraums auf 150 erhöht. Full Fledged EA und Alert plus für Warnungen werden auch in diesem Angebot zusammen mit dem Kauf von Indikator zur Verfügung gestellt werden. Begrenzte Kopien nur zu diesem Preis und Ea zu. Holen Sie sich Ihre Kopie bald Alert plus für Indikat

Derzeit 20% Rabatt!
Die beste Lösung für jeden Neueinsteiger oder Expert Händler!
Dieses Dashboard arbeitet mit 28 Währungspaaren. Es basiert auf 2 unserer Hauptindikatoren (Advanced Currency Strength 28 und Advanced Currency Impulse). Es bietet einen hervorragenden Überblick über den gesamten Forex-Markt. Es zeigt die Werte der Advanced Currency Strength, die Veränderungsrate der Währungen und die Signale für 28 Devisenpaare in allen (9) Zeitrahmen. Stellen Sie sich vor, wie sich Ihr Handel

Game Changer ist ein revolutionärer Trendindikator, der für jedes Finanzinstrument entwickelt wurde und Ihren Metatrader in einen leistungsstarken Trendanalysator verwandelt. Der Indikator zeichnet nicht neu und verzögert nicht. Er funktioniert in jedem Zeitrahmen und unterstützt die Trenderkennung, signalisiert potenzielle Umkehrungen, dient als Trailing-Stop-Mechanismus und liefert Echtzeit-Warnungen für schnelle Marktreaktionen. Egal, ob Sie erfahrener Trader, Profi oder Anfänger auf der Such

Ein exklusiver Indikator, der einen innovativen Algorithmus verwendet, um den Markttrend schnell und genau zu bestimmen. Der Indikator berechnet automatisch die Eröffnungs-, Schluss- und Gewinnniveaus und liefert detaillierte Handelsstatistiken. Mit diesen Funktionen können Sie das am besten geeignete Handelsinstrument für die aktuellen Marktbedingungen auswählen. Darüber hinaus können Sie ganz einfach Ihre eigenen Pfeilindikatoren in Scalper Inside Pro integrieren, um deren Statistiken und Rent

M1 SNIPER ist ein benutzerfreundliches Handelsindikatorsystem. Es handelt sich um einen Pfeilindikator, der für den M1-Zeitrahmen entwickelt wurde. Der Indikator kann als eigenständiges System für Scalping im M1-Zeitrahmen oder als Teil Ihres bestehenden Handelssystems verwendet werden. Obwohl dieses Handelssystem speziell für den M1-Zeitrahmen entwickelt wurde, kann es auch für andere Zeitrahmen verwendet werden. Ursprünglich habe ich diese Methode für den Handel mit XAUUSD und BTCUSD entwickel

Dieser Indikator ist eine hervorragende Kombination aus unseren 2 Produkten Advanced Currency IMPULSE with ALERT + Currency Strength Exotics .
Es funktioniert für alle Zeitrahmen und zeigt grafisch Impulse der Stärke oder Schwäche für die 8 wichtigsten Währungen plus ein Symbol!
Dieser Indikator ist darauf spezialisiert, die Beschleunigung der Währungsstärke für beliebige Symbole wie Gold, Exotische Paare, Rohstoffe, Indizes oder Futures anzuzeigen. Als erster seiner Art kann jedes Symbol

FX Volume: Erleben Sie den echten Marktüberblick aus der Sicht eines Brokers Kurzüberblick
Möchten Sie Ihre Handelsstrategie auf das nächste Level bringen? FX Volume liefert Ihnen Echtzeit-Einblicke in die Positionierung von Retail-Tradern und Brokern — lange bevor verzögerte Berichte wie der COT verfügbar sind. Ob Sie nach beständigen Gewinnen streben oder einfach einen tieferen Vorteil am Markt suchen, FX Volume hilft Ihnen, große Ungleichgewichte zu erkennen, Breakouts zu bestätigen und Ihr

Volatility Trend System – ein Handelssystem, das Signale für Einstiege gibt. Das Volatilitätssystem liefert lineare und punktuelle Signale in Richtung des Trends sowie Signale zum Verlassen des Trends, ohne Neuzeichnung und Verzögerungen. Der Trendindikator überwacht die Richtung des mittelfristigen Trends, zeigt die Richtung und deren Änderung an. Der Signalindikator basiert auf Änderungen der Volatilität und zeigt Markteintritte an.
Der Indikator ist mit mehreren Arten von Warnungen ausgestat

Currency Strength Wizard ist ein sehr leistungsstarker Indikator, der Ihnen eine Komplettlösung für erfolgreichen Handel bietet. Der Indikator berechnet die Stärke dieses oder jenes Forex-Paares anhand der Daten aller Währungen in mehreren Zeitrahmen. Diese Daten werden in Form von benutzerfreundlichen Währungsindizes und Währungsstärkelinien dargestellt, anhand derer Sie die Stärke dieser oder jener Währung erkennen können. Sie müssen lediglich den Indikator an das Diagramm anhängen, mit dem Si

Stärke von 8 Währungen plus EIN EXOTISCHES Paar oder Rohstoffe oder Indexe!
Jedes Produkt kann als 9. Linie hinzugefügt werden. Fügen Sie Rohstoffe, Indexes oder exotische Währungen hinzu (Gold, Silber, Öl, DAX, US30, MXN, TRY, CNH ...). Eine neue noch nie dagewesene TRADING STRATEGIE !!! Dieser Indikator ist einzigartig, weil wir eine Reihe von proprietäre Funktionen und neue Formeln eingebaut haben. Es funktioniert für alle Zeitrahmen. Basierend auf neuen zugrunde liegenden Algorithmen ist e

Miraculous Indicator – 100 % Nicht-Repaint Forex- und Binary-Tool basierend auf dem Gann-Quadrat der Neun Dieses Video stellt den Miraculous Indicator vor, ein hochpräzises und leistungsstarkes Trading-Tool, das speziell für Forex- und binäre Optionen-Trader entwickelt wurde. Was diesen Indikator einzigartig macht, ist seine Grundlage auf dem legendären Gann-Quadrat der Neun und Ganns Gesetz der Vibration , was ihn zu einem der präzisesten Prognose-Tools im modernen Trading macht. Der Miraculous

Trend Ai Indicator ist ein großartiges Tool, das die Marktanalyse eines Händlers verbessert, indem Trendidentifikation mit umsetzbaren Einstiegspunkten und Umkehrwarnungen kombiniert wird. Dieser Indikator ermöglicht es Benutzern, die Komplexität des Forex-Marktes mit Zuversicht und Präzision zu navigieren Über die primären Signale hinaus identifiziert der Trend Ai-Indikator sekundäre Einstiegspunkte, die bei Pullbacks oder Retracements auftreten, sodass Händler von Preiskorrekturen innerhalb d

TREND LINES PRO Hilft dabei zu verstehen, wo der Markt tatsächlich die Richtung ändert. Der Indikator zeigt echte Trendumkehrungen und Punkte an, an denen wichtige Marktteilnehmer wieder einsteigen.
Sie sehen BOS-Linien Trendwechsel und wichtige Kursniveaus in höheren Zeitrahmen – ohne komplexe Einstellungen oder unnötiges Rauschen. Signale werden nicht neu gezeichnet und bleiben nach dem Schließen des Balkens im Chart sichtbar. Was der Indikator anzeigt:
Reale Veränderungen Trend (B

Dynamic Forex28 Navigator – Das Forex-Handelstool der nächsten Generation AKTUELL 49 % RABATT. Dynamic Forex28 Navigator ist die Weiterentwicklung unserer seit langem beliebten Indikatoren und vereint die Leistung von drei in einem: Advanced Currency Strength28 Indicator (695 Bewertungen) + Advanced Currency IMPULSE mit ALERT (520 Bewertungen) + CS28 Combo Signals (Bonus) Details zum Indikator https://www.mql5.com/en/blogs/post/758844
Was bietet der Strength Indicator der nächsten Generation?

Derzeit 20% reduziert!
Dieses Dashboard ist eine sehr leistungsfähige Software, die mit mehreren Symbolen und bis zu 9 Zeitrahmen arbeitet. Es basiert auf unserem Hauptindikator (Beste Bewertungen: Advanced Supply Demand ).
Das Dashboard gibt einen guten Überblick. Es zeigt: Gefilterte Angebots- und Nachfragewerte einschließlich der Zonenstärkebewertung, Pips-Abstände zu/und innerhalb von Zonen, Es hebt verschachtelte Zonen hervor, Es gibt 4 Arten von Alarmen für die gewählten Symbole in al

Daily Candle Predictor ist ein Indikator, der den Schlusskurs einer Kerze vorhersagt. Der Indikator ist in erster Linie für die Verwendung in D1-Charts gedacht. Dieser Indikator eignet sich sowohl für den traditionellen Devisenhandel als auch für den Handel mit binären Optionen. Der Indikator kann als eigenständiges Handelssystem oder als Ergänzung zu Ihrem bestehenden Handelssystem verwendet werden. Dieser Indikator analysiert die aktuelle Kerze und berechnet bestimmte Stärkefaktoren innerhalb

Apollo SR Master ist ein Support/Resistance-Indikator mit besonderen Funktionen, der das Trading mit Support/Resistance-Zonen einfacher und zuverlässiger macht. Der Indikator berechnet Support/Resistance-Zonen in Echtzeit ohne Verzögerung, indem er lokale Kurshochs und -tiefs erkennt. Um die neu entstandene Support/Resistance-Zone zu bestätigen, zeigt der Indikator ein spezielles Signal an, das signalisiert, dass die Zone als Kauf- oder Verkaufssignal verwendet werden kann. In diesem Fall erhöht

FX Power: Analysieren Sie die Stärke von Währungen für intelligentere Handelsentscheidungen Übersicht
FX Power ist Ihr unverzichtbares Werkzeug, um die tatsächliche Stärke von Währungen und Gold unter allen Marktbedingungen zu verstehen. Indem Sie starke Währungen kaufen und schwache verkaufen, vereinfacht FX Power Ihre Handelsentscheidungen und deckt Chancen mit hoher Wahrscheinlichkeit auf. Ob Sie Trends folgen oder extreme Delta-Werte nutzen, um Umkehrungen zu prognostizieren, dieses Tool p

KATANA Skalierer für MT4 Produkt-Übersicht. KATANA Scalper für MT4 ist ein fortschrittlicher Indikator für die technische Analyse, der für die Plattform MetaTrader 4 optimiert wurde. Das Produkt wurde entwickelt, um gleichzeitig die schwierigsten Probleme im kurzfristigen Handel (Scalping und Daytrading) zu lösen: Preisrauschen und verzögerte Reaktion. Ein einzigartiger Signalverarbeitungsalgorithmus eliminiert oberflächliche Marktturbulenzen und extrahiert statistisch überlegene "Momentum-Kern

Wenn Sie diesen Indikator kaufen, erhalten Sie meinen professionellen Trade Manager + EA KOSTENLOS dazu.
Zunächst einmal ist es wichtig zu betonen, dass dieses Handelssystem ein Nicht-Repainting-, Nicht-Redrawing- und Nicht-Verzögerungsindikator ist, was es sowohl für manuelles als auch für automatisches Trading ideal macht. Online-Kurs, Handbuch und Vorlagen herunterladen. Das "Smart Trend Trading System MT5" ist eine umfassende Handelslösung, die für neue und erfahrene Trader maßgeschneide

FX Levels: Außerordentlich präzise Unterstützungs- und Widerstandszonen für alle Märkte Kurzüberblick
Suchen Sie eine verlässliche Methode, um Support- und Resistance-Level in jedem Markt zu identifizieren—egal ob Währungspaare, Indizes, Aktien oder Rohstoffe? FX Levels vereint die traditionelle „Lighthouse“-Methode mit einem modernen dynamischen Ansatz und bietet nahezu universelle Genauigkeit. Durch unsere Erfahrung mit echten Brokern sowie automatischen täglichen und Echtzeit-Updates hilft

Der Super Arrow Indicator liefert nicht nachzeichnende Kauf- und Verkaufssignale mit außergewöhnlicher Genauigkeit. Wichtigste Merkmale Kein Repainting - bestätigte Signale bleiben fixiert Klare visuelle Pfeile: grün für Kauf, rot für Verkauf Echtzeit-Warnungen per Pop-up, Ton und optionaler E-Mail Übersichtliche Chart-Ansicht ohne unnötigen Ballast Funktioniert auf allen Märkten: Forex, Gold, Öl, Indizes, Kryptowährungen Einstellbare Parameter Zeitrahmen Standard: "aktueller Zeitrahmen" Funktio

Adaptive Volatility Range [AVR] ist ein leistungsstarkes Instrument zur Identifizierung wichtiger Trendumkehrpunkte. AVR spiegelt die Average True Range (ATR) der Volatilität genau wider und berücksichtigt dabei den volumengewichteten Durchschnittspreis (VWAP). Der Indikator passt sich an jede Marktvolatilität an, indem er die durchschnittliche Volatilität über einen bestimmten Zeitraum berechnet und so eine stabile Rate an profitablen Trades gewährleistet. Sie erhalten nicht nur einen Indikato

Trendindikator, bahnbrechende, einzigartige Lösung für Trendhandel und -filterung mit allen wichtigen Trendfunktionen in einem Tool! Es handelt sich um einen 100 % nicht neu zu malenden Multi-Timeframe- und Multi-Währungs-Indikator, der für alle Symbole/Instrumente verwendet werden kann: Forex, Rohstoffe, Kryptowährungen, Indizes und Aktien. ZEITLICH BEGRENZTES ANGEBOT: Der Support- und Resistance-Screener-Indikator ist für nur 50 $ und lebenslang verfügbar. (Ursprünglicher Preis 250 $) (Angebot

SHOGUN Trade - Marktstruktur-Analysator & Multi-Timeframe Dashboard Produktkonzept: Strategischer Blick auf das Schlachtfeld aus der Vogelperspektive SHOGUN Trade wurde entwickelt, um die Perspektive des Händlers von "vorübergehenden Schwankungen" zum "Verständnis der gesamten Marktstruktur" zu bringen. Das System synchronisiert und scannt sieben Zeitrahmen (M1 bis D1) in Echtzeit und quantifiziert objektiv den Reifegrad des Marktes. So entsteht ein "strategisches Handelsumfeld", das emotionale

Dieses Dashboard zeigt die neuesten verfügbaren harmonischen Muster für die ausgewählten Symbole, so dass Sie Zeit sparen und effizienter sein werden / MT5-Version .
Kostenloser Indikator: Basic Harmonic Pattern
Spalten des Indikators Symbol: die ausgewählten Symbole werden angezeigt Trend: bullish oder bearish Pattern : Art des Musters (Gartley, Schmetterling, Fledermaus, Krabbe, Hai, Cypher oder ABCD) Entry : Einstiegskurs SL: Stop-Loss-Kurs TP1: 1. Take-Profit-Kurs TP2: 2. Gewinnmitnahme-

Zunächst einmal ist es erwähnenswert, dass dieser Handelsindikator nicht neu malt, nicht neu zeichnet und keine Verzögerung aufweist, was ihn sowohl für manuellen als auch für Roboterhandel ideal macht. Benutzerhandbuch: Einstellungen, Eingaben und Strategie. Der Atom-Analyst ist ein PA-Preisaktionsindikator, der die Stärke und das Momentum des Preises nutzt, um einen besseren Vorteil auf dem Markt zu finden. Ausgestattet mit fortschrittlichen Filtern, die helfen, Rauschen und falsche Signale z
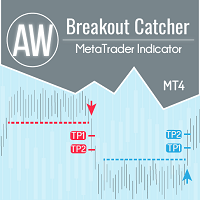
Aufschlüsselung der Preisniveaus, erweiterte Statistiken, TakeProfit-Berechnung und 3 Arten von Benachrichtigungen. Vorteile: Zeichnen Sie Ihre Ergebnisse nicht neu Signal ausschließlich am Ende der Kerze Filteralgorithmus für falsche Aufschlüsselung Es passt gut zu jeder Trendstrategie. Funktioniert mit allen Tools und Zeitreihen Handbuch und Anleitung -> HIER / Problemlösung -> HIER / MT5-Version -> HIER Wie man mit dem Indikator handelt Handeln Sie mit AW Breakout Catcher in nur dr

Dies ist eine einzigartige Gold-Indikator auf Kanal Handel Pullbacks und gibt genaue Einträge auf Gold und wichtige Fx Paare auf M15tf. Es hat die Fähigkeit, jede Prop Firma Challenge passieren und erhalten genaue Einträge auf Gold und wichtige fx Paare.
EA FÜR PROP FIRMA UND KANAL-INDIKATOR IST KOSTENLOS ZUSAMMEN MIT DIESEM LEISTUNGSSTARKEN INDIKATOR ZUSAMMEN MIT DEM BESTEN SET-DATEI FÜR DIE ERSTEN 25 BENUTZER. Strategie-Tester Bericht ist im Kommentarbereich. INDIKATOR-FUNKTIONEN: INDIKATOR I

Die ersten 25 Exemplare kosten $80, danach wird der Preis auf $149 erhöht.
Gold Signal Pro ist ein leistungsstarker MT4-Indikator, der Händlern helfen soll, starke Preisreaktionen auf dem Markt zu erkennen. Er konzentriert sich auf klare Dochtverwerfungen und zeigt an, wenn der Preis ein Niveau stark zurückweist und oft in dieselbe Richtung weitergeht. Gold Signal Pro wurde hauptsächlich für das Scalping von Gold (XAUUSD) entwickelt und funktioniert am besten auf niedrigeren Zeitrahmen wie M5

Wir stellen Ihnen den F-16 Plane Indicator vor, ein hochmodernes MT4-Tool, das Ihr Trading-Erlebnis revolutionieren wird. Inspiriert von der unvergleichlichen Geschwindigkeit und Präzision des F-16-Kampfflugzeugs kombiniert dieser Indikator fortschrittliche Algorithmen und modernste Technologie, um eine beispiellose Leistung auf den Finanzmärkten zu bieten. Mit dem F-16 Plane Indicator schweben Sie über der Konkurrenz, da er Echtzeit-Analysen liefert und äußerst präzise Trading-Signale generiert

Indikator im Voraus Bestimmt Marktumkehrpunkte und -zonen und ermöglicht es Ihnen, abzuwarten, bis der Preis zu diesem Niveau zurückkehrt, um am Anfang eines neuen Trends einzusteigen, anstatt an dessen Ende.
Er zeigt Umkehrniveaus wenn der Markt eine Richtungsänderung bestätigt und weitere Bewegungen ausbildet.
Der Indikator funktioniert ohne Nachzeichnen, ist für alle Instrumente optimiert und entfaltet sein volles Potenzial in Kombination mit dem TREND LINES PRO

Freunde, wir stellen Ihnen unseren neuen Forex Gump Laser Indikator vor. Da es in unserem Team keine Designer gibt, sondern hauptsächlich Mathematiker, Finanzexperten, Programmierer und Trader, haben wir keine besonderen Änderungen im Design des Indikators vorgenommen. Vom Aussehen her ähnelt er dem üblichen Forex Gump. Andererseits ist Forex Gump nicht nur der Name eines Indikators, sondern eine Marke geworden. Und wir versuchen, die Corporate Identity in all ihren Varianten zu bewahren. Die ga

Currency Strength Meter is the easiest way to identify strong and weak currencies. This indicator shows the relative strength of 8 major currencies + Gold: AUD, CAD, CHF, EUR, GBP, JPY, NZD, USD, XAU. Gold symbol can be changed to other symbols like XAG, XAU etc.
By default the strength value is normalised to the range from 0 to 100 for RSI algorithm: The value above 60 means strong currency; The value below 40 means weak currency;
This indicator needs the data of all 28 major currency pairs

Bei diesem Indikator handelt es sich um einen Indikator für die automatische Wellenanalyse, der sich perfekt für den praktischen Handel eignet! Fall...
Hinweis: Ich bin es nicht gewohnt, westliche Namen für die Welleneinstufung zu verwenden. Aufgrund des Einflusses der Namenskonvention von Tang Lun (Tang Zhong Shuo Zen) habe ich die Grundwelle als Stift und das sekundäre Wellenband als Segment bezeichnet Gleichzeitig hat das Segment die Trendrichtung benannt (diese Benennungsmeth

Das Prinzip dieses Indikators ist sehr einfach: Er erkennt den Trend mit dem gleitenden Durchschnitt, überwacht dann den Rückkehrpunkt des Graphen mit Hilfe der Kreuzung des Stochastik-Oszillators und sagt schließlich KAUF- und VERKAUFssignale mit Pfeilen, Warnungen und Benachrichtigungen voraus. Die Parameter sind festgelegt und werden automatisch für jeden Zeitrahmen berechnet. Beispiel: Wenn Sie den Indikator auf EURUSD, Zeitrahmen M5, installieren: der Indikator wird den Haupttrend mit dem g

DERZEIT 26% RABATT
Die beste Lösung für jeden Newbie oder Expert Trader!
Dieser Indikator ist ein einzigartiges, qualitativ hochwertiges und erschwingliches Trading-Tool, da wir eine Reihe von proprietären Funktionen und eine neue Formel integriert haben. Mit nur EINEM Chart können Sie die Währungsstärke für 28 Forex-Paare ablesen! Stellen Sie sich vor, wie sich Ihr Handel verbessern wird, weil Sie in der Lage sind, den genauen Auslösungspunkt eines neuen Trends oder einer Scalping-Gelegenhei

Derzeit 33% Rabatt! Die beste Lösung für jeden Anfänger oder erfahrenen Händler! Dieser Indikator ist ein einzigartiges, qualitativ hochwertiges und erschwingliches Trading-Tool, da wir eine Reihe von proprietären Funktionen und eine neue Formel integriert haben. Mit diesem Update werden Sie in der Lage sein, doppelte Zeitrahmenzonen anzuzeigen. Sie können nicht nur einen höheren TF (Zeitrahmen) anzeigen, sondern sowohl den Chart-TF als auch den höheren TF: SHOWING NESTED ZONES. Alle Supply Dema
Top Bottom Tracker ist ein auf hochentwickelten Algorithmen basierender Indikator, der den Markttrend analysiert und die Hochs und Tiefs des Trends erkennen kann / MT5 Version .
Der Preis wird schrittweise steigen, bis er 500$ erreicht. Nächster Preis --> $99
Eigenschaften Kein Repainting
Dieser Indikator ändert seine Werte nicht, wenn neue Daten eintreffen
Handelspaare
Alle Forex-Paare
Zeitrahmen
Alle Zeitrahmen
Parameter ==== Indikator-Konfiguration ====
Konfigurationsparameter //

Das Ein-Minuten-Gold ist ein volumen-, preis- und trendbasierter Einstiegssignal-Indikator mit Pfeilen, der Tradern hilft, die richtige Marktseite zu wählen und Chancen zu generieren. Warum Ein-Minuten-Gold wählen? TP-SL. Eingebaute Take-Profit- und Stop-Loss-Objekte erscheinen im Chart bei jedem Signal. Zwei Methoden: ATR TP-SL und feste Punkte TP-SL. Statistik-Panel. Zeigt Gewinn-/Verluststatistik über gewählte Historienkerzen, aktuelle Gewinnrate %, Gewinn-/Verlustserien und Nettoprofit. Hoc
FREE

3 Exemplare zu $65 übrig, nächster Preis ist $120
SMC Easy Signal wurde entwickelt, um die Verwirrung um das Smart-Money-Konzept zu beseitigen, indem es strukturelle Verschiebungen wie BOS (Break of Structure) und CHoCH (Change of Character) in einfache Kauf- und Verkaufssignale umwandelt. Es vereinfacht den Handel mit Marktstrukturen, indem es Ausbrüche und Umkehrungen automatisch identifiziert, sobald sie auftreten, so dass sich Händler auf die Ausführung statt auf die Analyse konzentrieren

Day Trader Master ist ein komplettes Handelssystem für Daytrader. Das System besteht aus zwei Indikatoren. Ein Indikator ist ein Pfeilsignal zum Kaufen und Verkaufen. Es ist die Pfeilanzeige, die Sie erhalten. Den zweiten Indikator stelle ich Ihnen kostenlos zur Verfügung. Der zweite Indikator ist ein Trendindikator, der speziell für die Verwendung in Verbindung mit diesen Pfeilen entwickelt wurde. INDIKATOREN WIEDERHOLEN SICH NICHT UND NICHT ZU SPÄT! Die Verwendung dieses Systems ist sehr einfa

Werden Sie Breaker Trader und profitieren Sie von Änderungen der Marktstruktur, wenn sich der Preis umkehrt.
Der Order Block Breaker Indikator zeigt an, wann sich eine Trend- oder Preisbewegung der Erschöpfung nähert und bereit ist, sich umzukehren. Es weist Sie auf Änderungen in der Marktstruktur hin, die normalerweise auftreten, wenn eine Umkehrung oder ein größerer Rückzug bevorsteht.
Der Indikator verwendet eine proprietäre Berechnung, die Ausbrüche und Preisdynamik identifiziert. Jedes M

Slayer Binary ist ein binärer Options-Ein-Kerzen-Strike-Pfeilindikator. Dieser Indikator ist nicht für diejenigen, die den Heiligen Gral suchen, da es ein unrealistischer Ansatz für den Handel im Allgemeinen ist. Der Indikator zeigt eine stabile Trefferquote an, und wenn er mit Geldmanagement und einem Tagesziel verwendet wird, ist er noch zuverlässiger. Der Indikator enthält viele Funktionen, die unten aufgeführt sind:
FEATURES KEIN UMLACKIEREN: Der Indikator lackiert seine Pfeile nicht live
Der Market Steps-Indikator wurde auf der Grundlage von Gann-Zeit/Kurs-Korrelationen entwickelt und durch Price Action-spezifische Regeln für den Devisenmarkt optimiert. Er nutzt die Konzepte des Market Order Flow, um potenzielle Preiszonen für ein hohes Auftragsvolumen vorherzusagen.
Indicator Levels kann für den Handel selbst oder als Kombination zum Filtern von falschen Signalen anderer Strategien/Indikatoren verwendet werden. Jeder Trader braucht ein solch leistungsstarkes Tool, um Multi-T

Pips Forex ist ein fertiges Handelssystem. Dieser Indikator zeigt mit Pfeilen im Diagramm an, wann und in welche Richtung Sie eine Order eröffnen müssen. Wenn der Pfeil grün ist, eröffnen wir ein Kaufgeschäft, und wenn der Pfeil rot ist, eröffnen wir ein Verkaufsgeschäft. Alles ist sehr einfach und sehr effektiv. TakeProfit setzt 15-25 Punkte. StopLoss auf Punktniveau eingestellt. Wenn sich die Punkte bewegen, überschreiben wir sofort den StopLoss. Empfohlener Zeitrahmen für den Handel mit M1 u

Eine Intraday-Strategie, die auf zwei Grundprinzipien des Marktes basiert. Der Algorithmus basiert auf der Analyse von Volumina und Preiswellen mit zusätzlichen Filtern. Der intelligente Algorithmus des Indikators gibt nur dann ein Signal, wenn sich zwei Marktfaktoren zu einem vereinen. Der Indikator berechnet Wellen eines bestimmten Bereichs auf dem M1-Diagramm unter Verwendung der Daten des höheren Zeitrahmens. Und um die Welle zu bestätigen, verwendet der Indikator eine Volumenanalyse. Dieser

Symbole: USDCHF, USDJPY, XAUUSD, GBPUSD, EURUSD, AUDUSD, GBPJPY ( Ich liebe USDCHF_H1 )
Zeitrahmen: H1, H4, D1
Wichtige Merkmale: Kein Repainting, keine Verzögerung, Richtungssignal, mehrere Bestätigungen
Sicherheit: Signale enthalten Stop-Loss, Take-Profit und folgen der Risiko-Ertrags-Regel
Enthält: Kostenloser Multi-Time-Frame-Scanner (Nach dem Kauf dieses Produkts senden Sie mir einfach einen Screenshot per privater Nachricht, und ich sende Ihnen die Screener-Datei persönlich zu.)
Ko
[ MT5 Version ]
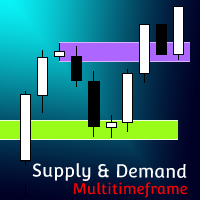
Angebot und Nachfrage Multitimeframe Supply and Demand Multitimeframe ist der erste Indikator auf dem Markt, der mehrere Aspekte wie Handelsvolumen, Preisstruktur und Momentum kombiniert, um Angebots- und Nachfragezonen für jedes Asset zu identifizieren. Der Supply and Demand Indikator analysiert gleichzeitig bis zu 4 verschiedene TFs und stellt deren Informationen im aktuellen Diagramm dar. Seine interaktive Benutzeroberfläche hebt jedes Mal hervor, wenn der Preis in eine Angeb
MT5-Version hier verfügbar: https://www.mql5.com/en/market/product/50255
Telegram-Kanal & Gruppe: https://t.me/bluedigitsfx
VIP-Gruppenzugang: Senden Sie Zahlungsnachweis an unseren Posteingang
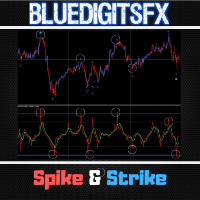
Empfohlener Broker: https://bit.ly/BlueDigitsFxStarTrader BlueDigitsFx Spike And Strike Reversal — Leistungsstarker Misch-Oszillator zur genauen Marktumkehr-Erkennung BlueDigitsFx Spike And Strike Reversal ist ein zusammengesetzter Oszillator, der mehrere Indikatorsignale kombiniert, um Ihnen zu helfen

Gold Channel ist ein volatilitätsbasierter Indikator, der mit einem speziellen Timing-Algorithmus für das Paar XAUUSD entwickelt wurde, der darin besteht, mögliche Korrekturen auf dem Markt zu erkennen.
Dieser Indikator zeigt zwei äußere Linien, eine innere Linie (Retracement-Linie) und ein Pfeilzeichen, wobei die Theorie des Kanals darin besteht, überkaufte und überverkaufte Bedingungen auf dem Markt zu erkennen.
Der Marktpreis wird im Allgemeinen zwischen den Grenzen des Kanals fallen. Wenn

MT5 Version hier verfügbar:
https://www.mql5.com/en/market/product/50048 Telegram Kanal & Gruppe:
https://t.me/bluedigitsfx V.I.P Gruppen-Zugang:
Sende Zahlungsnachweis für eines unserer kostenpflichtigen Produkte an unseren Posteingang Empfohlener Broker:
https://bit.ly/BlueDigitsFxStarTrader BlueDigitsFx Easy 123 System — Leistungsstarke Umkehr- und Ausbruchserkennung für MT4 Ein All-in-One Non-Repaint Indikator, der dir hilft, Marktstrukturveränderungen, Ausbrüche und Trendwenden einfach

Dies ist ein Indikator für MT4, der genaue Signale für den Einstieg in einen Handel ohne Repainting (Neuzeichnen) liefert. Er kann auf alle Finanzwerte angewendet werden: Forex, Kryptowährungen, Metalle, Aktien, Indizes. Er liefert ziemlich genaue Schätzungen und sagt Ihnen, wann es am besten ist, eine Position zu eröffnen und zu schließen. Sehen Sie sich das Video (6:22) mit einem Beispiel für die Verarbeitung nur eines Signals an, das sich für den Indikator gelohnt hat! Die meisten Händler ver

Hören Sie auf zu raten. Beginnen Sie mit einem statistischen Vorteil zu handeln. Aktienindizes werden nicht wie Forex gehandelt. Sie haben definierte Sitzungen, Overnight-Gaps und folgen vorhersehbaren statistischen Mustern. Dieser Indikator liefert Ihnen die Wahrscheinlichkeitsdaten, die Sie benötigen, um Indizes wie den DAX, S&P 500 und Dow Jones mit Zuversicht zu handeln. Was ihn anders macht Die meisten Indikatoren zeigen Ihnen, was passiert ist. Dieser zeigt Ihnen, was wahrscheinlich als nä
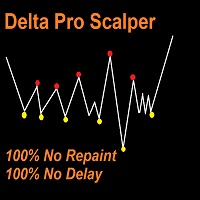
Delta Pro Scalper - Ihre ultimative Lösung für den Trendhandel, Delta Pro Scalper ist ein TREND-Indikator, der den Markt automatisch analysiert und Informationen über den Trend ohne Neuzeichnung oder Verzögerung liefert.
Der Indikator verwendet Candlestick OHLC Daten und analysiert diese, um einen Aufwärts- oder Abwärtstrend zu bestimmen. Sie MÜSSEN bis zur Schlusskerze warten, sobald der Punkt erscheint, können Sie eine Kauf- oder Verkaufsposition eröffnen.
Roter Punkt = Bearish Trend (Open SE

In monatelanger Arbeit haben wir mit Hilfe von Neuronalen Netzen das ultimative Tool entwickelt, das Sie zur Identifizierung von wichtigen Kursniveaus (Unterstützungen und Widerstände) sowie von Angebots- und Nachfragezonen benötigen. Perfekt geeignet, um Ihre Trades auszulösen, Ihre zukünftigen Aktionen festzulegen, Ihre Take Profit- und Stop Loss-Niveaus zu bestimmen und die Marktrichtung zu bestätigen. Der Preis wird sich immer zwischen diesen Niveaus bewegen, abprallen oder brechen; von eine

Dieser Indikator bietet die Möglichkeit, das SMC-Muster zu erkennen, im Wesentlichen eine verkürzte Version des Wyckoff-Modells. Sobald das Muster von RTO bestätigt wird, stellt es eine bedeutende Investitionsmöglichkeit dar. Es gibt zahlreiche Indikatoren, die sich auf SMC über den Markt hinaus beziehen, aber dies ist der erste Indikator, der Muster nutzt, um spezifische Aktionen von BigBoy zu identifizieren, um den Markt zu steuern. Aktualisierung 2024-03-08: Hinzufügen der Funktion TP by RR.

Die bahnbrechende Lösung für Trend Trading und Filtering mit allen wichtigen Funktionen in einem einzigen Tool! Der intelligente Algorithmus von Trend PRO erkennt den Trend, filtert Marktgeräusche heraus und gibt Einstiegssignale mit Ausstiegslevels. Die neuen Funktionen mit verbesserten Regeln für die statistische Berechnung haben die Gesamtleistung dieses Indikators verbessert.
Wichtige Informationen aufgedeckt Um das Potenzial von Trend Pro zu maximieren, besuchen Sie bitte www.mql5.com/en
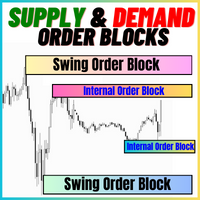
Die Supply and Demand Order Blocks:
Der Indikator "Supply and Demand Order Blocks" ist ein anspruchsvolles Tool, das auf den Konzepten des Smart Money basiert und für die technische Analyse im Devisenhandel unerlässlich ist. Er konzentriert sich darauf, Angebot und Nachfrage Zonen zu identifizieren, entscheidende Bereiche, in denen institutionelle Händler deutliche Spuren hinterlassen. Die Angebotszone, die Verkaufsaufträge anzeigt, und die Nachfragezone, die Kaufaufträge anzeigt, helfen Händl
FREE

Crystal Volume Profile Auto POC (MT4) — Volumenprofil mit automatischer POC-Erkennung Überblick
Crystal Volume Profile Auto POC ist ein leichtgewichtiger, optimierter Indikator für MetaTrader 4. Er zeigt die Volumenverteilung auf verschiedenen Preisniveaus an und hebt automatisch den Point of Control (POC) hervor — das Niveau mit dem größten Handelsvolumen. Damit lassen sich verdeckte Unterstützungs-/Widerstandsbereiche, Akkumulations- und Distributionszonen sowie institutionelle Handelsaktivi
FREE

Verfügbar für MT4 und MT5 . Tritt dem Market Structure Patterns Kanal bei, um Studienmaterialien und/oder zusätzliche Informationen herunterzuladen.
Verwandte Beiträge: Market Structure Patterns - Einführung Jetzt mit 50 % Rabatt sichern | Vorheriger Preis 90 $ | Angebot gültig bis 31. Dezember | Ein großes Upgrade steht kurz bevor und der ursprüngliche Preis wird angepasst.
Market Structure Patterns ist ein Indikator, basierend auf den Smart Money Concepts , der die SMC/ICT E

TW Trend Sniper: Die beste Trendstrategie
Der TW Trend Sniper-Indikator verwendet eine intelligente Kombination aus fortschrittlichen technischen Analysetechniken und hilft Ihnen, Markttrends genau zu erkennen und rechtzeitig Signale für profitable Trades zu erhalten. Die proprietäre Formel von Trade Wizards liefert Ihnen zusammen mit der Price Action-Analyse, Fibonacci-Levels und anderen technischen Analysetools präzise und zuverlässige Handelssignale. Dieser Indikator ist das Ergebnis der Zu

Apollo Trend Rider ist ein benutzerfreundlicher Pfeilindikator, der Kauf- und Verkaufssignale liefert. Der Indikator wird nicht neu gezeichnet und bietet Ihnen somit die Möglichkeit, ihn zu testen und an jedes Handelsinstrument und jeden gewünschten Zeitrahmen anzupassen. Der Indikator bietet alle Arten von Alarmen, einschließlich PUSH-Benachrichtigungen. Dieser Indikator basiert auf der Kombination mehrerer Strategien, darunter Trend-, Ausbruchs- und Umkehrstrategien. Der Indikator kann auch al

Der Stratos Pali-Indikator ist ein revolutionäres Instrument zur Verbesserung Ihrer Handelsstrategie durch die genaue Erkennung von Markttrends. Dieser hochentwickelte Indikator verwendet einen einzigartigen Algorithmus, um ein vollständiges Histogramm zu erstellen, das aufzeichnet, wann der Trend Long oder Short ist. Bei einer Trendumkehr erscheint ein Pfeil, der die neue Richtung des Trends anzeigt.
Wichtige Informationen aufgedeckt Hinterlassen Sie eine Bewertung und kontaktieren Sie mich p
** Alle Symbole x Alle Timeframes scannen durch Drücken der Scanner-Taste ** Nach 18 Jahren Erfahrung an den Märkten und in der Programmierung ist der Winner-Indikator fertig. Ich würde gerne mit Ihnen teilen! *** Kontaktieren Sie mich , um Ihnen eine Anleitung zu schicken und Sie in die "123 scanner group" aufzunehmen, damit Sie Ihre Erfahrungen mit anderen Nutzern austauschen und sehen können. Einführung Der 123 Pattern Scanner Indikator mit einem speziellen verbesserten Algorithmus ist ein si
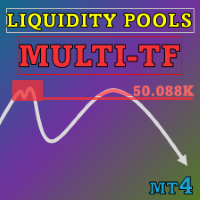
Special offer : ALL TOOLS , just $35 each! New tools will be $30 for the first week or the first 3 purchases ! Trading Tools Channel on MQL5 : Join my MQL5 channel to update the latest news from me Der Liquidity Pools -Indikator ist ein fortschrittliches Werkzeug, das potenzielle Liquiditätszonen im Chart erkennt und markiert, indem er Bereiche mit häufigen Dochtberührungen, die Anzahl der Wiederholungen und das gehandelte Volumen in jeder Zone analysiert. Dieses Tool bietet Trader

Oni Strength Pro - Multi-Asset Trendanalyse Dashboard MT5 https://www.mql5.com/en/market/product/161591?
Produktübersicht Oni Strength Pro ist das ultimative Trendanalyseprogramm für MT4, das die Analyse der Währungsstärke mit der Überwachung von Multi-Assets verbindet. Das größte Highlight des neuesten Updates v15.00 ist die "Vollautomatische Symbolauswahl". Das System scannt alle überwachten Symbole in Echtzeit und wählt automatisch die "Top 3 Kauf"- und "Top 3 Verkauf"-K andidaten aus - d

Trend Reversal Zone and Alert Multi-Timeframe Supply & Demand Zonen + Präzise Trendwendesignale Trend Reversal Zone and Alert ist ein professioneller, nicht nachzeichnender (Non-Repainting) Marktstruktur-Indikator, entwickelt für Trader, die hochwahrscheinliche Trendwenden an institutionellen Schlüsselbereichen erkennen möchten. Der Indikator kombiniert intelligent Supply- und Demand-Zonen auf höheren Zeitrahmen (H4 & D1) mit präzisen Ablehnungssignalen an Tageshochs und -tiefs , sodass exakte
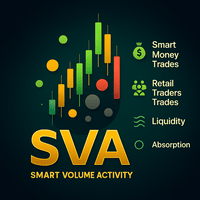
Smart Volume Activity [SVA] ist ein fortschrittlicher analytischer Indikator, der für MetaTrader-Plattformen entwickelt wurde. Er zeigt auf, wie institutionelle (Smart Money) und private Händler agieren , indem er das Volumenverhalten über mehrere Zeitrahmen hinweg analysiert. Im Gegensatz zu gewöhnlichen Volumen-Tools passt sich SVA automatisch an jeden Chart-Zeitrahmen an und hebt Zonen der Absorption hervor - Momente, in denen große Marktteilnehmer Liquidität aus schwächeren Händen absorbiere
123456789101112131415161718192021222324252627282930313233343536373839404142434445464748495051525354555657585960616263646566676869707172737475767778798081828384858687888990919293949596979899100101102103104105106107108109110111112113114115116117118119120121122123124125126127128129130131132133134135136137138139140141142143144145146147148149150151152153154155156157158159
MetaTrader Market - Handelsroboter und technische Indikatoren stehen Ihnen direkt im Kundenterminal zur Verfügung.
Das MQL5.community Zahlungssystem wurde für die Services der MetaTrader Plattform entwickelt und steht allen registrierten Nutzern der MQL5.com Webseite zur Verfügung. Man kann Geldmittel durch WebMoney, PayPal und Bankkarten einzahlen und sich auszahlen lassen.
Sie verpassen Handelsmöglichkeiten:
- Freie Handelsapplikationen
- Über 8.000 Signale zum Kopieren
- Wirtschaftsnachrichten für die Lage an den Finanzmärkte
Registrierung
Einloggen
Wenn Sie kein Benutzerkonto haben, registrieren Sie sich
Erlauben Sie die Verwendung von Cookies, um sich auf der Website MQL5.com anzumelden.
Bitte aktivieren Sie die notwendige Einstellung in Ihrem Browser, da Sie sich sonst nicht einloggen können.