在 MQL5 中自动化交易策略(第 13 部分):构建头肩形态交易算法

引言
在我们的上一篇文章(第 12 部分)中,我们在 MetaQuotes Language 5 (MQL5) 中实现了缓解订单块策略,以利用机构价格区域进行交易。现在,在第 13 部分中,我们将重点转向构建一个头肩形态交易算法,自动化一个经典的反转形态,以精确捕捉市场转折点。我们将涵盖以下主题:
在本文结束时,您将拥有一个功能齐全的EA,可以交易头肩形态——让我们开始吧!
理解头肩形态的架构
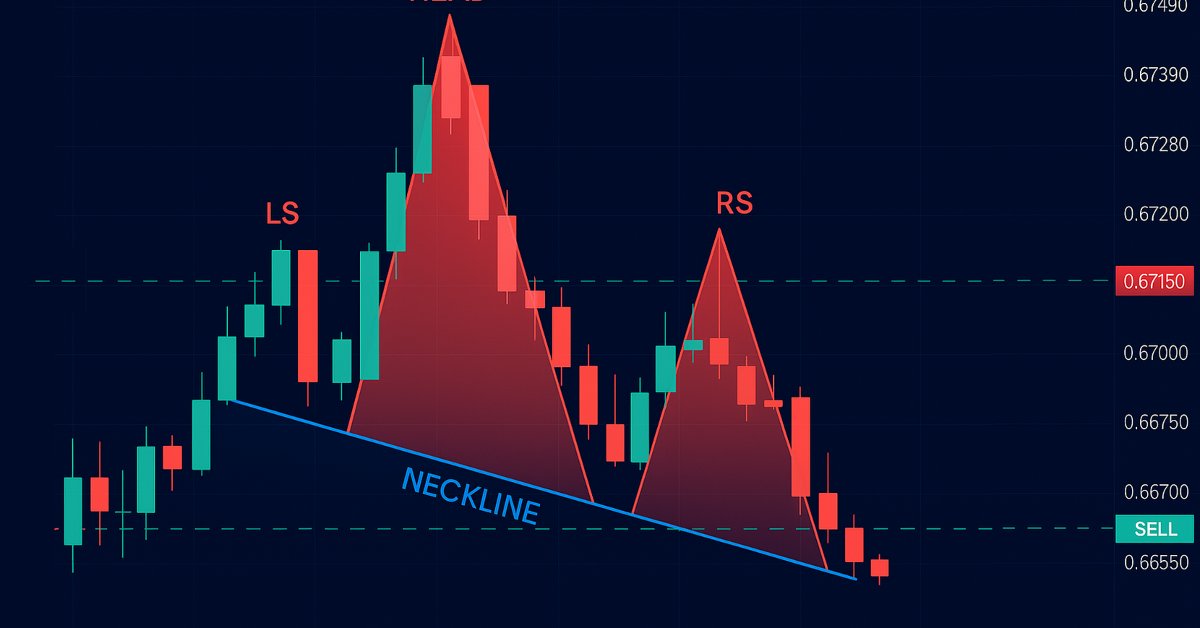
头肩形态是技术分析中广泛认可的一种经典图表形态,用于预测趋势反转,它同时出现在标准(看跌)和反向(看涨)两种变体中,每种变体都由一系列独特的价格峰值或谷底序列定义。在我们的程序中,对于标准形态,上升趋势将形成三个峰值:左肩确立一个高点,头部作为趋势的顶点将明显高于两肩(显著超过左右两肩),右肩形成的高度低于头部但接近左肩,所有这些都由一条连接两个谷底的颈线串联起来——一旦价格跌破此线,我们将在突破点建立空头交易,将止损设置在右肩上方,并通过将头部到颈线的高度向下投射来设定止盈目标,如下图所示。

对于反向形态,下降趋势将形成三个谷底:左肩标记一个低点,头部将显著下探更深(低于两肩),右肩将与左肩的高度对齐,一条颈线横跨两个峰值——价格向上突破颈线将触发多头入场,止损设在右肩下方,止盈则通过颈线到头部的距离向上延伸,所有这些都基于头部的突出高度和两肩的接近对称性,作为我们的指导规则。这是其图示。

至于风险管理,我们将集成一个可选的移动止损功能,以锁定利润并最大化收益。让我们开始吧。
在MQL5中的实现
要在 MQL5 中创建程序,请打开MetaEditor,转到“导航器”窗口,找到“指标”文件夹,点击“新建”选项卡,然后按照提示创建文件。文件创建完成后,在代码编环境下,我们需要声明一些将在整个程序中使用的全局变量。
//+------------------------------------------------------------------+
//|                                  Head & Shoulders Pattern EA.mq5 |
//|                           Copyright 2025, Allan Munene Mutiiria. |
//|                                   https://t.me/Forex_Algo_Trader |
//+------------------------------------------------------------------+
#property copyright "Copyright 2025, Allan Munene Mutiiria."
#property link      "https://youtube.com/@ForexAlgo-Trader?"
#property version   "1.00"

#include <Trade\Trade.mqh>                    //--- Include the Trade.mqh library for trading functions
CTrade obj_Trade;                            //--- Trade object for executing and managing trades

// Input Parameters
input int LookbackBars = 50;                   // Number of historical bars to analyze for pattern detection
input double ThresholdPoints = 70.0;           // Minimum price movement in points to identify a reversal
input double ShoulderTolerancePoints = 15.0;   // Maximum allowable price difference between left and right shoulders
input double TroughTolerancePoints = 30.0;     // Maximum allowable price difference between neckline troughs or peaks
input double BufferPoints = 10.0;              // Additional points added to stop-loss for safety buffer
input double LotSize = 0.1;                    // Volume of each trade in lots
input ulong MagicNumber = 123456;              // Unique identifier for trades opened by this EA
input int MaxBarRange = 30;                    // Maximum number of bars allowed between key pattern points
input int MinBarRange = 5;                     // Minimum number of bars required between key pattern points
input double BarRangeMultiplier = 2.0;         // Maximum multiple of the smallest bar range for pattern uniformity
input int ValidationBars = 3;                  // Number of bars after right shoulder to validate breakout
input double PriceTolerance = 5.0;             // Price tolerance in points for matching traded patterns
input double RightShoulderBreakoutMultiplier = 1.5; // Maximum multiple of pattern range for right shoulder to breakout distance
input int MaxTradedPatterns = 20;              // Maximum number of patterns stored in traded history
input bool UseTrailingStop = false;             // Toggle to enable or disable trailing stop functionality
input int MinTrailPoints = 50;                 // Minimum profit in points before trailing stop activates
input int TrailingPoints = 30;                 // Distance in points to maintain behind current price when trailing
在这里,我们以 "#include <Trade\Trade.mqh>" 和一个 “CTrade” 对象 “obj_Trade” 开始,以便包含用于交易管理的额外交易文件。我们设置了一些输入参数,例如用于历史分析的 “LookbackBars”(默认 50)、用于确认反转的 “ThresholdPoints”(默认 70.0),以及用于对称性判断的 “ShoulderTolerancePoints”(默认 15.0)和 “TroughTolerancePoints”(默认 30.0)。其余的输入参数不言自明。我们添加了详细的注释以便于理解。接下来,我们需要定义一些结构体,用于寻找形态和管理已考虑的交易。
// Structure to store peaks and troughs
struct Extremum {
   int bar;           //--- Bar index where extremum occurs
   datetime time;     //--- Timestamp of the bar
   double price;      //--- Price at extremum (high for peak, low for trough)
   bool isPeak;       //--- True if peak (high), false if trough (low)
};

// Structure to store traded patterns
struct TradedPattern {
   datetime leftShoulderTime;  //--- Timestamp of the left shoulder
   double leftShoulderPrice;   //--- Price of the left shoulder
};
我们使用 struct 关键字设置了两个关键的结构体来驱动我们的头肩形态交易算法:“Extremum” 将存储峰值和谷底,包含 “bar”(索引)、“time”(时间戳)、“price”(值)和 “isPeak”(峰值为 true,谷底为 false)以精确定位形态的组成部分;而 “TradedPattern” 将使用 “leftShoulderTime” 和 “leftShoulderPrice” 来跟踪已执行的交易,以防止重复交易。为确保我们每根 K 线只交易一次并跟踪正在进行的交易,我们声明了一个变量和一个数组,如下所示。
// Global Variables
static datetime lastBarTime = 0;         //--- Tracks the timestamp of the last processed bar to avoid reprocessing
TradedPattern tradedPatterns[];          //--- Array to store details of previously traded patterns
至此,我们准备就绪。但是,由于我们需要在图表上显示该形态,我们将需要获取图表架构和 K 线组成部分,以确保它能适应形态的要求。
int chart_width         = (int)ChartGetInteger(0, CHART_WIDTH_IN_PIXELS);        //--- Width of the chart in pixels for visualization
int chart_height        = (int)ChartGetInteger(0, CHART_HEIGHT_IN_PIXELS);       //--- Height of the chart in pixels for visualization
int chart_scale         = (int)ChartGetInteger(0, CHART_SCALE);                  //--- Zoom level of the chart (0-5)
int chart_first_vis_bar = (int)ChartGetInteger(0, CHART_FIRST_VISIBLE_BAR);      //--- Index of the first visible bar on the chart
int chart_vis_bars      = (int)ChartGetInteger(0, CHART_VISIBLE_BARS);           //--- Number of visible bars on the chart
double chart_prcmin     = ChartGetDouble(0, CHART_PRICE_MIN, 0);                 //--- Minimum price visible on the chart
double chart_prcmax     = ChartGetDouble(0, CHART_PRICE_MAX, 0);                 //--- Maximum price visible on the chart

//+------------------------------------------------------------------+
//| Converts the chart scale property to bar width/spacing           |
//+------------------------------------------------------------------+
int BarWidth(int scale) { return (int)pow(2, scale); }                           //--- Calculates bar width in pixels based on chart scale (zoom level)

//+------------------------------------------------------------------+
//| Converts the bar index (as series) to x in pixels                |
//+------------------------------------------------------------------+
int ShiftToX(int shift) { return (chart_first_vis_bar - shift) * BarWidth(chart_scale) - 1; } //--- Converts bar index to x-coordinate in pixels on the chart

//+------------------------------------------------------------------+
//| Converts the price to y in pixels                                |
//+------------------------------------------------------------------+
int PriceToY(double price) {                                                     //--- Function to convert price to y-coordinate in pixels
   if (chart_prcmax - chart_prcmin == 0.0) return 0;                             //--- Return 0 if price range is zero to avoid division by zero
   return (int)round(chart_height * (chart_prcmax - price) / (chart_prcmax - chart_prcmin) - 1); //--- Calculate y-pixel position based on price and chart dimensions
}
我们通过使用 ChartGetInteger 函数定义 “chart_width” 和 “chart_height” 等变量来获取图表尺寸,使用 “chart_scale” 获取缩放比例,使用 “chart_first_vis_bar” 和 “chart_vis_bars” 获取 K 线详情,并通过 ChartGetDouble 获取 “chart_prcmin” 和 “chart_prcmax” 以得到价格范围,从而为程序准备并配备可视化功能。我们使用带有 pow 函数的 “BarWidth” 函数,根据 “chart_scale” 计算 K 线间距;使用 “ShiftToX” 函数,通过 “chart_first_vis_bar” 和 “chart_scale” 将 K 线索引转换为 x 坐标;并使用带有 round 函数的 “PriceToY” 函数,基于 “chart_height”、“chart_prcmax” 和 “chart_prcmin” 将价格映射到 y 坐标,从而实现精确的形态显示。我们现在已完全准备就绪。可以继续在 OnInit 事件处理程序中初始化程序了。
//+------------------------------------------------------------------+
//| Expert initialization function                                   |
//+------------------------------------------------------------------+
int OnInit() {                                                           //--- Expert Advisor initialization function
   obj_Trade.SetExpertMagicNumber(MagicNumber);                          //--- Set the magic number for trades opened by this EA
   ArrayResize(tradedPatterns, 0);                                       //--- Initialize tradedPatterns array with zero size
   return(INIT_SUCCEEDED);                                               //--- Return success code to indicate successful initialization
}
在 OnInit 中,我们在 “obj_Trade” 对象上使用 “SetExpertMagicNumber” 方法,将 “MagicNumber” 指定为所有交易的唯一标识符,以确保我们程序的持仓是可区分的;同时调用 ArrayResize 函数将 “tradedPatterns” 数组的大小设置为零,以清除任何先前的数据,从而实现全新的开始。然后,我们通过返回 INIT_SUCCEEDED 来结束,以确认设置成功,为EA有效检测和交易该形态做好准备。现在我们可以继续处理 OnTick 事件处理程序,并确保我们每根 K 线只分析一次。
//+------------------------------------------------------------------+
//| Expert tick function                                             |
//+------------------------------------------------------------------+
void OnTick() {                                                          //--- Main tick function executed on each price update
   datetime currentBarTime = iTime(_Symbol, _Period, 0);                 //--- Get the timestamp of the current bar
   if (currentBarTime == lastBarTime) return;                            //--- Exit if the current bar has already been processed

   lastBarTime = currentBarTime;                                         //--- Update the last processed bar time

   // Update chart properties
   chart_width         = (int)ChartGetInteger(0, CHART_WIDTH_IN_PIXELS); //--- Update chart width in pixels
   chart_height        = (int)ChartGetInteger(0, CHART_HEIGHT_IN_PIXELS); //--- Update chart height in pixels
   chart_scale         = (int)ChartGetInteger(0, CHART_SCALE);           //--- Update chart zoom level
   chart_first_vis_bar = (int)ChartGetInteger(0, CHART_FIRST_VISIBLE_BAR); //--- Update index of the first visible bar
   chart_vis_bars      = (int)ChartGetInteger(0, CHART_VISIBLE_BARS);    //--- Update number of visible bars
   chart_prcmin        = ChartGetDouble(0, CHART_PRICE_MIN, 0);          //--- Update minimum visible price on chart
   chart_prcmax        = ChartGetDouble(0, CHART_PRICE_MAX, 0);          //--- Update maximum visible price on chart

   // Skip pattern detection if a position is already open
   if (PositionsTotal() > 0) return;                                     //--- Exit function if there are open positions to avoid multiple trades
}
在 OnTick 事件处理程序中(该程序在每次价格更新时激活,以监控和响应市场变化),我们使用 iTime 函数获取最新 K 线的 “currentBarTime”,并将其与 “lastBarTime” 进行比较以避免重复处理,仅在新 K 线出现时才更新 “lastBarTime”;然后,我们通过调用 ChartGetInteger 来刷新图表视觉效果,更新 “chart_width”、“chart_height”、“chart_scale”、“chart_first_vis_bar” 和 “chart_vis_bars”,并调用 ChartGetDouble 来更新 “chart_prcmin” 和 “chart_prcmax”。我们还使用 PositionsTotal 函数检查是否有未平仓的交易,如果存在任何持仓则提前退出,以防止持仓重叠,为形态检测和交易做好准备。然后,我们可以定义一个函数来寻找极值点或关键的形态点。
//+------------------------------------------------------------------+
//| Find extrema in the last N bars                                  |
//+------------------------------------------------------------------+
void FindExtrema(Extremum &extrema[], int lookback) {                    //--- Function to identify peaks and troughs in price history
   ArrayFree(extrema);                                                   //--- Clear the extrema array to start fresh
   int bars = Bars(_Symbol, _Period);                                    //--- Get total number of bars available
   if (lookback >= bars) lookback = bars - 1;                            //--- Adjust lookback if it exceeds available bars

   double highs[], lows[];                                               //--- Arrays to store high and low prices
   ArraySetAsSeries(highs, true);                                        //--- Set highs array as time series (newest first)
   ArraySetAsSeries(lows, true);                                         //--- Set lows array as time series (newest first)
   CopyHigh(_Symbol, _Period, 0, lookback + 1, highs);                   //--- Copy high prices for lookback period
   CopyLow(_Symbol, _Period, 0, lookback + 1, lows);                     //--- Copy low prices for lookback period

   bool isUpTrend = highs[lookback] < highs[lookback - 1];               //--- Determine initial trend based on first two bars
   double lastHigh = highs[lookback];                                    //--- Initialize last high price
   double lastLow = lows[lookback];                                      //--- Initialize last low price
   int lastExtremumBar = lookback;                                       //--- Initialize last extremum bar index

   for (int i = lookback - 1; i >= 0; i--) {                             //--- Loop through bars from oldest to newest
      if (isUpTrend) {                                                   //--- If currently in an uptrend
         if (highs[i] > lastHigh) {                                      //--- Check if current high exceeds last high
            lastHigh = highs[i];                                         //--- Update last high price
            lastExtremumBar = i;                                         //--- Update last extremum bar index
         } else if (lows[i] < lastHigh - ThresholdPoints * _Point) {     //--- Check if current low indicates a reversal (trough)
            int size = ArraySize(extrema);                               //--- Get current size of extrema array
            ArrayResize(extrema, size + 1);                              //--- Resize array to add new extremum
            extrema[size].bar = lastExtremumBar;                         //--- Store bar index of the peak
            extrema[size].time = iTime(_Symbol, _Period, lastExtremumBar); //--- Store timestamp of the peak
            extrema[size].price = lastHigh;                              //--- Store price of the peak
            extrema[size].isPeak = true;                                 //--- Mark as a peak
            //Print("Extrema added: Bar ", lastExtremumBar, ", Time ", TimeToString(extrema[size].time), ", Price ", DoubleToString(lastHigh, _Digits), ", IsPeak true"); //--- Log new peak
            isUpTrend = false;                                           //--- Switch trend to downtrend
            lastLow = lows[i];                                           //--- Update last low price
            lastExtremumBar = i;                                         //--- Update last extremum bar index
         }
      } else {                                                        //--- If currently in a downtrend
         if (lows[i] < lastLow) {                                     //--- Check if current low is below last low
            lastLow = lows[i];                                        //--- Update last low price
            lastExtremumBar = i;                                      //--- Update last extremum bar index
         } else if (highs[i] > lastLow + ThresholdPoints * _Point) {  //--- Check if current high indicates a reversal (peak)
            int size = ArraySize(extrema);                            //--- Get current size of extrema array
            ArrayResize(extrema, size + 1);                           //--- Resize array to add new extremum
            extrema[size].bar = lastExtremumBar;                      //--- Store bar index of the trough
            extrema[size].time = iTime(_Symbol, _Period, lastExtremumBar); //--- Store timestamp of the trough
            extrema[size].price = lastLow;                            //--- Store price of the trough
            extrema[size].isPeak = false;                             //--- Mark as a trough
            //Print("Extrema added: Bar ", lastExtremumBar, ", Time ", TimeToString(extrema[size].time), ", Price ", DoubleToString(lastLow, _Digits), ", IsPeak false"); //--- Log new trough
            isUpTrend = true;                                         //--- Switch trend to uptrend
            lastHigh = highs[i];                                      //--- Update last high price
            lastExtremumBar = i;                                      //--- Update last extremum bar index
         }
      }
   }
}
在这里,我们通过实现 “FindExtrema” 函数来精确定义我们头肩形态的峰值和谷底,该函数分析最近的 “lookback” 根 K 线,以构建一个包含关键价格点的 “extrema” 数组。我们首先使用 ArrayFree 函数重置 “extrema” 数组,以确保一个干净的状态;然后使用 “Bars” 函数获取可用的 K 线总数,如果 “lookback” 超过此限制,则对其进行封顶,以保证我们始终在图表的数据范围内。接下来,我们准备 “highs” 和 “lows” 数组来存放价格数据,使用 ArraySetAsSeries 函数将它们设置为时间序列(最新的在前),并使用 CopyHigh 和 CopyLow 函数填充它们,以提取 “lookback + 1” 根 K 线的最高价和最低价。
在一个从最旧 K 线到最新 K 线的循环中,我们根据初始价格变动用 “isUpTrend” 来确定趋势,然后跟踪 “lastHigh” 或 “lastLow” 及其 “lastExtremumBar”;当反转超过 “ThresholdPoints” 时,我们使用 ArrayResize 函数扩展 “extrema” 数组,存储诸如 “bar”、“time”(通过 “iTime” 获取)、“price” 和 “isPeak”(峰值为 true,谷底为 false)等详细信息,并切换趋势,从而实现精确的形态识别。现在,我们可以获取已识别的价格水平并将其保存以供进一步使用。
Extremum extrema[];                                                   //--- Array to store identified peaks and troughs
FindExtrema(extrema, LookbackBars);                                   //--- Find extrema in the last LookbackBars bars
在这里,我们声明一个 “Extremum” 类型的 “extrema” 数组来存放已识别的峰值和谷底,该数组将存储形态的肩部和头部。然后,我们调用 “FindExtrema” 函数,将 “extrema” 和 “LookbackBars” 作为参数传递,以扫描最近的 “LookbackBars” 根 K 线,并用关键的极值点填充该数组,为形态识别和后续的交易决策奠定基础。当我们使用 ArrayPrint 函数打印数组值时,会得到如下所示的结构。

这证实了我们拥有必要的数据点。因此,我们可以继续进行形态组成部分的识别。为了使代码模块化,我们采用了函数。
//+------------------------------------------------------------------+
//| Detect standard Head and Shoulders pattern                       |
//+------------------------------------------------------------------+
bool DetectHeadAndShoulders(Extremum &extrema[], int &leftShoulderIdx, int &headIdx, int &rightShoulderIdx, int &necklineStartIdx, int &necklineEndIdx) { //--- Function to detect standard H&S pattern
   int size = ArraySize(extrema);                                        //--- Get the size of the extrema array
   if (size < 6) return false;                                           //--- Return false if insufficient extrema for pattern (need at least 6 points)

   for (int i = size - 6; i >= 0; i--) {                                 //--- Loop through extrema to find H&S pattern (start at size-6 to ensure enough points)
      if (!extrema[i].isPeak && extrema[i+1].isPeak && !extrema[i+2].isPeak && //--- Check sequence: trough, peak (LS), trough
          extrema[i+3].isPeak && !extrema[i+4].isPeak && extrema[i+5].isPeak) { //--- Check sequence: peak (head), trough, peak (RS)
         double leftShoulder = extrema[i+1].price;                       //--- Get price of left shoulder
         double head = extrema[i+3].price;                               //--- Get price of head
         double rightShoulder = extrema[i+5].price;                      //--- Get price of right shoulder
         double trough1 = extrema[i+2].price;                            //--- Get price of first trough (neckline start)
         double trough2 = extrema[i+4].price;                            //--- Get price of second trough (neckline end)

         bool isHeadHighest = true;                                      //--- Flag to verify head is the highest peak in range
         for (int j = MathMax(0, i - 5); j < MathMin(size, i + 10); j++) { //--- Check surrounding bars (5 before, 10 after) for higher peaks
            if (extrema[j].isPeak && extrema[j].price > head && j != i + 3) { //--- If another peak is higher than head
               isHeadHighest = false;                                    //--- Set flag to false
               break;                                                    //--- Exit loop as head is not highest
            }
         }

         int lsBar = extrema[i+1].bar;                                   //--- Get bar index of left shoulder
         int headBar = extrema[i+3].bar;                                 //--- Get bar index of head
         int rsBar = extrema[i+5].bar;                                   //--- Get bar index of right shoulder
         int lsToHead = lsBar - headBar;                                 //--- Calculate bars from left shoulder to head
         int headToRs = headBar - rsBar;                                 //--- Calculate bars from head to right shoulder

         if (lsToHead < MinBarRange || lsToHead > MaxBarRange || headToRs < MinBarRange || headToRs > MaxBarRange) continue; //--- Skip if bar ranges are out of bounds

         int minRange = MathMin(lsToHead, headToRs);                     //--- Get the smaller of the two ranges for uniformity check
         if (lsToHead > minRange * BarRangeMultiplier || headToRs > minRange * BarRangeMultiplier) continue; //--- Skip if ranges exceed uniformity multiplier

         bool rsValid = false;                                           //--- Flag to validate right shoulder breakout
         int rsBarIndex = extrema[i+5].bar;                              //--- Get bar index of right shoulder for validation
         for (int j = rsBarIndex - 1; j >= MathMax(0, rsBarIndex - ValidationBars); j--) { //--- Check bars after right shoulder for breakout
            if (iLow(_Symbol, _Period, j) < rightShoulder - ThresholdPoints * _Point) { //--- Check if price drops below RS by threshold
               rsValid = true;                                           //--- Set flag to true if breakout confirmed
               break;                                                    //--- Exit loop once breakout is validated
            }
         }
         if (!rsValid) continue;                                         //--- Skip if right shoulder breakout not validated

         if (isHeadHighest && head > leftShoulder && head > rightShoulder && //--- Verify head is highest and above shoulders
             MathAbs(leftShoulder - rightShoulder) < ShoulderTolerancePoints * _Point && //--- Check shoulder price difference within tolerance
             MathAbs(trough1 - trough2) < TroughTolerancePoints * _Point) { //--- Check trough price difference within tolerance
            leftShoulderIdx = i + 1;                                     //--- Set index for left shoulder
            headIdx = i + 3;                                             //--- Set index for head
            rightShoulderIdx = i + 5;                                    //--- Set index for right shoulder
            necklineStartIdx = i + 2;                                    //--- Set index for neckline start (first trough)
            necklineEndIdx = i + 4;                                      //--- Set index for neckline end (second trough)
            Print("Bar Ranges: LS to Head = ", lsToHead, ", Head to RS = ", headToRs); //--- Log bar ranges for debugging
            return true;                                                 //--- Return true to indicate pattern found
         }
      }
   }
   return false;                                                         //--- Return false if no pattern detected
}
在这里,我们通过 “DetectHeadAndShoulders” 函数来识别标准形态,该函数检查 “extrema” 数组以寻找一个由六个点组成的有效序列:一个谷底、一个峰值(左肩)、一个谷底、一个峰值(头部)、一个谷底和一个峰值(右肩),这要求至少有六个条目,通过 ArraySize 函数进行检查。我们从 “size - 6” 开始遍历 “extrema”,验证形态的峰-谷交替结构,然后提取 “leftShoulder”(左肩)、“head”(头部)、“rightShoulder”(右肩)以及颈线谷底(“trough1”、“trough2”)的价格;一个嵌套循环使用 MathMax 和 MathMin 函数确保头部在某个范围内是最高的峰值,同时点与点之间的 K 线距离受到 “MinBarRange” 和 “MaxBarRange” 的约束,并通过 “BarRangeMultiplier” 来保证其均匀性。
我们通过在 “ValidationBars” 根 K 线上,使用 iLow 函数检查价格是否跌破 “ThresholdPoints” 来确认右肩的突破,如果头部高于两肩且满足容差要求(“ShoulderTolerancePoints”、“TroughTolerancePoints”),我们就分配 “leftShoulderIdx”、“headIdx” 和 “necklineStartIdx” 等索引,使用 Print 函数记录 K 线范围以便调试,并返回 true 来表示检测到形态,否则返回 false。我们使用相同的逻辑来寻找相反的形态。
//+------------------------------------------------------------------+
//| Detect inverse Head and Shoulders pattern                        |
//+------------------------------------------------------------------+
bool DetectInverseHeadAndShoulders(Extremum &extrema[], int &leftShoulderIdx, int &headIdx, int &rightShoulderIdx, int &necklineStartIdx, int &necklineEndIdx) { //--- Function to detect inverse H&S pattern
   int size = ArraySize(extrema);                                        //--- Get the size of the extrema array
   if (size < 6) return false;                                           //--- Return false if insufficient extrema for pattern (need at least 6 points)

   for (int i = size - 6; i >= 0; i--) {                                 //--- Loop through extrema to find inverse H&S pattern
      if (extrema[i].isPeak && !extrema[i+1].isPeak && extrema[i+2].isPeak && //--- Check sequence: peak, trough (LS), peak
          !extrema[i+3].isPeak && extrema[i+4].isPeak && !extrema[i+5].isPeak) { //--- Check sequence: trough (head), peak, trough (RS)
         double leftShoulder = extrema[i+1].price;                       //--- Get price of left shoulder
         double head = extrema[i+3].price;                               //--- Get price of head
         double rightShoulder = extrema[i+5].price;                      //--- Get price of right shoulder
         double peak1 = extrema[i+2].price;                              //--- Get price of first peak (neckline start)
         double peak2 = extrema[i+4].price;                              //--- Get price of second peak (neckline end)

         bool isHeadLowest = true;                                       //--- Flag to verify head is the lowest trough in range
         int headBar = extrema[i+3].bar;                                 //--- Get bar index of head for range check
         for (int j = MathMax(0, headBar - 5); j <= MathMin(Bars(_Symbol, _Period) - 1, headBar + 5); j++) { //--- Check 5 bars before and after head
            if (iLow(_Symbol, _Period, j) < head) {                      //--- If any low is below head
               isHeadLowest = false;                                     //--- Set flag to false
               break;                                                    //--- Exit loop as head is not lowest
            }
         }

         int lsBar = extrema[i+1].bar;                                   //--- Get bar index of left shoulder
         int rsBar = extrema[i+5].bar;                                   //--- Get bar index of right shoulder
         int lsToHead = lsBar - headBar;                                 //--- Calculate bars from left shoulder to head
         int headToRs = headBar - rsBar;                                 //--- Calculate bars from head to right shoulder

         if (lsToHead < MinBarRange || lsToHead > MaxBarRange || headToRs < MinBarRange || headToRs > MaxBarRange) continue; //--- Skip if bar ranges are out of bounds

         int minRange = MathMin(lsToHead, headToRs);                     //--- Get the smaller of the two ranges for uniformity check
         if (lsToHead > minRange * BarRangeMultiplier || headToRs > minRange * BarRangeMultiplier) continue; //--- Skip if ranges exceed uniformity multiplier

         bool rsValid = false;                                           //--- Flag to validate right shoulder breakout
         int rsBarIndex = extrema[i+5].bar;                              //--- Get bar index of right shoulder for validation
         for (int j = rsBarIndex - 1; j >= MathMax(0, rsBarIndex - ValidationBars); j--) { //--- Check bars after right shoulder for breakout
            if (iHigh(_Symbol, _Period, j) > rightShoulder + ThresholdPoints * _Point) { //--- Check if price rises above RS by threshold
               rsValid = true;                                           //--- Set flag to true if breakout confirmed
               break;                                                    //--- Exit loop once breakout is validated
            }
         }
         if (!rsValid) continue;                                         //--- Skip if right shoulder breakout not validated

         if (isHeadLowest && head < leftShoulder && head < rightShoulder && //--- Verify head is lowest and below shoulders
             MathAbs(leftShoulder - rightShoulder) < ShoulderTolerancePoints * _Point && //--- Check shoulder price difference within tolerance
             MathAbs(peak1 - peak2) < TroughTolerancePoints * _Point) { //--- Check peak price difference within tolerance
            leftShoulderIdx = i + 1;                                     //--- Set index for left shoulder
            headIdx = i + 3;                                             //--- Set index for head
            rightShoulderIdx = i + 5;                                    //--- Set index for right shoulder
            necklineStartIdx = i + 2;                                    //--- Set index for neckline start (first peak)
            necklineEndIdx = i + 4;                                      //--- Set index for neckline end (second peak)
            Print("Bar Ranges: LS to Head = ", lsToHead, ", Head to RS = ", headToRs); //--- Log bar ranges for debugging
            return true;                                                 //--- Return true to indicate pattern found
         }
      }
   }
   return false;                                                         //--- Return false if no pattern detected
}
我们定义 “DetectInverseHeadAndShoulders” 函数来识别反向形态,该函数筛选 “extrema” 数组以定位一个由六个点组成的序列——峰值、谷底(左肩)、峰值、谷底(头部)、峰值、谷底(右肩)——这需要至少六个条目,由 ArraySize 函数验证。我们从 “size - 6” 开始向下迭代,确认形态的峰-谷交替,然后提取 “leftShoulder”(左肩)、“head”(头部)、“rightShoulder”(右肩)以及颈线峰值(“peak1”、“peak2”)的价格;一个嵌套循环使用 MathMax、MathMin 和 iLow 函数检查头部是否是 “headBar” K 线周围五根 K 线范围内的最低谷底,同时 “Bars” 函数确保我们不超出图表限制。
我们使用 “MinBarRange” 和 “MaxBarRange” 来强制执行 K 线间距,使用 MathMin 函数和 “BarRangeMultiplier” 计算均匀性,并通过在 “ValidationBars” 根 K 线上使用 iHigh 函数对照 “ThresholdPoints” 来验证右肩的突破;如果 “head” 低于两肩且满足容差要求(“ShoulderTolerancePoints”、“TroughTolerancePoints”),我们就设置 “leftShoulderIdx” 和 “necklineStartIdx” 等索引,记录范围,并返回 true,否则返回 false。现在有了这两个函数,我们可以按如下方式识别形态。
int leftShoulderIdx, headIdx, rightShoulderIdx, necklineStartIdx, necklineEndIdx; //--- Indices for pattern components

// Standard Head and Shoulders (Sell)
if (DetectHeadAndShoulders(extrema, leftShoulderIdx, headIdx, rightShoulderIdx, necklineStartIdx, necklineEndIdx)) { //--- Check for standard H&S pattern
   double closePrice = iClose(_Symbol, _Period, 1);                   //--- Get the closing price of the previous bar
   double necklinePrice = extrema[necklineEndIdx].price;              //--- Get the price of the neckline end point

   if (closePrice < necklinePrice) {                                  //--- Check if price has broken below the neckline (sell signal)
      datetime lsTime = extrema[leftShoulderIdx].time;                //--- Get the timestamp of the left shoulder
      double lsPrice = extrema[leftShoulderIdx].price;                //--- Get the price of the left shoulder

      //---
   }
}
在这里,我们通过声明变量 “leftShoulderIdx”、“headIdx”、“rightShoulderIdx”、“necklineStartIdx” 和 “necklineEndIdx” 来存储形态组成部分的索引,然后使用 “DetectHeadAndShoulders” 函数检查 “extrema” 数组中是否存在标准形态,并将这些索引作为引用传递。如果检测到,我们使用 iClose 函数获取前一根 K 线的 “closePrice”(收盘价),并从 “extrema[necklineEndIdx].price” 获取 “necklinePrice”(颈线价格),如果 “closePrice” 跌破 “necklinePrice”,则触发卖出信号;然后我们从 “extrema[leftShoulderIdx]” 中提取 “lsTime”(左肩时间)和 “lsPrice”(左肩价格),为基于左肩位置执行交易做准备。此时,我们需要确保该形态尚未被交易。我们定义一个函数来执行此检查。
//+------------------------------------------------------------------+
//| Check if pattern has already been traded                         |
//+------------------------------------------------------------------+
bool IsPatternTraded(datetime lsTime, double lsPrice) {                  //--- Function to check if a pattern has already been traded
   int size = ArraySize(tradedPatterns);                                 //--- Get the current size of the tradedPatterns array
   for (int i = 0; i < size; i++) {                                      //--- Loop through all stored traded patterns
      if (tradedPatterns[i].leftShoulderTime == lsTime &&                //--- Check if left shoulder time matches
          MathAbs(tradedPatterns[i].leftShoulderPrice - lsPrice) < PriceTolerance * _Point) { //--- Check if left shoulder price is within tolerance
         Print("Pattern already traded: Left Shoulder Time ", TimeToString(lsTime), ", Price ", DoubleToString(lsPrice, _Digits)); //--- Log that pattern was previously traded
         return true;                                                    //--- Return true to indicate pattern has been traded
      }
   }
   return false;                                                         //--- Return false if no match found
}
在这里,我们通过实现 “IsPatternTraded” 函数来确保我们的程序避免重复交易,该函数检查一个由 “lsTime” 和 “lsPrice” 标识的形态是否已存在于 “tradedPatterns” 数组中。我们使用 ArraySize 函数获取数组的 “size”(大小),然后遍历该数组,通过 MathAbs 函数,在 “PriceTolerance”(价格容差)范围内,将每个条目的 “leftShoulderTime” 与 “lsTime” 以及 “leftShoulderPrice” 与 “lsPrice” 进行比较;如果找到匹配项,我们使用 Print函数将其记录下来,并使用 TimeToString 和 DoubleToString 函数增强可读性,然后返回 true;否则返回 false,以允许进行新的交易。然后,我们调用该函数进行检查,如果未找到匹配项,则继续执行。
if (IsPatternTraded(lsTime, lsPrice)) return;                   //--- Exit if this pattern has already been traded

datetime breakoutTime = iTime(_Symbol, _Period, 1);             //--- Get the timestamp of the breakout bar (previous bar)
int lsBar = extrema[leftShoulderIdx].bar;                       //--- Get the bar index of the left shoulder
int headBar = extrema[headIdx].bar;                             //--- Get the bar index of the head
int rsBar = extrema[rightShoulderIdx].bar;                      //--- Get the bar index of the right shoulder
int necklineStartBar = extrema[necklineStartIdx].bar;           //--- Get the bar index of the neckline start
int necklineEndBar = extrema[necklineEndIdx].bar;               //--- Get the bar index of the neckline end
int breakoutBar = 1;                                            //--- Set breakout bar index (previous bar)

int lsToHead = lsBar - headBar;                                 //--- Calculate number of bars from left shoulder to head
int headToRs = headBar - rsBar;                                 //--- Calculate number of bars from head to right shoulder
int rsToBreakout = rsBar - breakoutBar;                         //--- Calculate number of bars from right shoulder to breakout
int lsToNeckStart = lsBar - necklineStartBar;                   //--- Calculate number of bars from left shoulder to neckline start
double avgPatternRange = (lsToHead + headToRs) / 2.0;           //--- Calculate average bar range of the pattern for uniformity check

if (rsToBreakout > avgPatternRange * RightShoulderBreakoutMultiplier) { //--- Check if breakout distance exceeds allowed range
   Print("Pattern rejected: Right Shoulder to Breakout (", rsToBreakout,
         ") exceeds ", RightShoulderBreakoutMultiplier, "x average range (", avgPatternRange, ")"); //--- Log rejection due to excessive breakout range
   return;                                                      //--- Exit function if pattern is invalid
}

double necklineStartPrice = extrema[necklineStartIdx].price;    //--- Get the price of the neckline start point
double necklineEndPrice = extrema[necklineEndIdx].price;        //--- Get the price of the neckline end point
datetime necklineStartTime = extrema[necklineStartIdx].time;    //--- Get the timestamp of the neckline start point
datetime necklineEndTime = extrema[necklineEndIdx].time;        //--- Get the timestamp of the neckline end point
int barDiff = necklineStartBar - necklineEndBar;                //--- Calculate bar difference between neckline points for slope
double slope = (necklineEndPrice - necklineStartPrice) / barDiff; //--- Calculate the slope of the neckline (price change per bar)
double breakoutNecklinePrice = necklineStartPrice + slope * (necklineStartBar - breakoutBar); //--- Calculate neckline price at breakout point

// Extend neckline backwards
int extendedBar = necklineStartBar;                             //--- Initialize extended bar index with neckline start
datetime extendedNecklineStartTime = necklineStartTime;         //--- Initialize extended neckline start time
double extendedNecklineStartPrice = necklineStartPrice;         //--- Initialize extended neckline start price
bool foundCrossing = false;                                     //--- Flag to track if neckline crosses a bar within range

for (int i = necklineStartBar + 1; i < Bars(_Symbol, _Period); i++) { //--- Loop through bars to extend neckline backwards
   double checkPrice = necklineStartPrice - slope * (i - necklineStartBar); //--- Calculate projected neckline price at bar i
   if (NecklineCrossesBar(checkPrice, i)) {                     //--- Check if neckline intersects the bar's high-low range
      int distance = i - necklineStartBar;                      //--- Calculate distance from neckline start to crossing bar
      if (distance <= avgPatternRange * RightShoulderBreakoutMultiplier) { //--- Check if crossing is within uniformity range
         extendedBar = i;                                       //--- Update extended bar index
         extendedNecklineStartTime = iTime(_Symbol, _Period, i); //--- Update extended neckline start time
         extendedNecklineStartPrice = checkPrice;              //--- Update extended neckline start price
         foundCrossing = true;                                  //--- Set flag to indicate crossing found
         Print("Neckline extended to first crossing bar within uniformity: Bar ", extendedBar); //--- Log successful extension
         break;                                                 //--- Exit loop after finding valid crossing
      } else {                                                  //--- If crossing exceeds uniformity range
         Print("Crossing bar ", i, " exceeds uniformity (", distance, " > ", avgPatternRange * RightShoulderBreakoutMultiplier, ")"); //--- Log rejection of crossing
         break;                                                 //--- Exit loop as crossing is too far
      }
   }
}

if (!foundCrossing) {                                           //--- If no valid crossing found within range
   int barsToExtend = 2 * lsToNeckStart;                        //--- Set fallback extension distance as twice LS to neckline start
   extendedBar = necklineStartBar + barsToExtend;               //--- Calculate extended bar index
   if (extendedBar >= Bars(_Symbol, _Period)) extendedBar = Bars(_Symbol, _Period) - 1; //--- Cap extended bar at total bars if exceeded
   extendedNecklineStartTime = iTime(_Symbol, _Period, extendedBar); //--- Update extended neckline start time
   extendedNecklineStartPrice = necklineStartPrice - slope * (extendedBar - necklineStartBar); //--- Update extended neckline start price
   Print("Neckline extended to fallback (2x LS to Neckline Start): Bar ", extendedBar, " (no crossing within uniformity)"); //--- Log fallback extension
}

Print("Standard Head and Shoulders Detected:");                 //--- Log detection of standard H&S pattern
Print("Left Shoulder: Bar ", lsBar, ", Time ", TimeToString(lsTime), ", Price ", DoubleToString(lsPrice, _Digits)); //--- Log left shoulder details
Print("Head: Bar ", headBar, ", Time ", TimeToString(extrema[headIdx].time), ", Price ", DoubleToString(extrema[headIdx].price, _Digits)); //--- Log head details
Print("Right Shoulder: Bar ", rsBar, ", Time ", TimeToString(extrema[rightShoulderIdx].time), ", Price ", DoubleToString(extrema[rightShoulderIdx].price, _Digits)); //--- Log right shoulder details
Print("Neckline Start: Bar ", necklineStartBar, ", Time ", TimeToString(necklineStartTime), ", Price ", DoubleToString(necklineStartPrice, _Digits)); //--- Log neckline start details
Print("Neckline End: Bar ", necklineEndBar, ", Time ", TimeToString(necklineEndTime), ", Price ", DoubleToString(necklineEndPrice, _Digits)); //--- Log neckline end details
Print("Close Price: ", DoubleToString(closePrice, _Digits));    //--- Log closing price at breakout
Print("Breakout Time: ", TimeToString(breakoutTime));           //--- Log breakout timestamp
Print("Neckline Price at Breakout: ", DoubleToString(breakoutNecklinePrice, _Digits)); //--- Log neckline price at breakout
Print("Extended Neckline Start: Bar ", extendedBar, ", Time ", TimeToString(extendedNecklineStartTime), ", Price ", DoubleToString(extendedNecklineStartPrice, _Digits)); //--- Log extended neckline start details
Print("Bar Ranges: LS to Head = ", lsToHead, ", Head to RS = ", headToRs, ", RS to Breakout = ", rsToBreakout, ", LS to Neckline Start = ", lsToNeckStart); //--- Log bar ranges for pattern analysis
在这里,我们通过验证检测到的标准形态并设置一笔卖出交易来增强形态检测功能:首先使用 “IsPatternTraded” 函数检查 “lsTime” 和 “lsPrice” 是否与 “tradedPatterns” 中的先前交易匹配,如果匹配则退出,以避免重复交易。然后,我们使用 iTime 函数将 “breakoutTime” 赋值为前一根 K 线的时间戳,并从 “extrema” 中获取 “lsBar”、“headBar”、“rsBar”、“necklineStartBar” 和 “necklineEndBar” 等 K 线索引,计算 “lsToHead”、“headToRs” 和 “rsToBreakout” 等范围;如果 “rsToBreakout” 超过 “avgPatternRange” 乘以 “RightShoulderBreakoutMultiplier”,我们拒绝该形态,并使用 Print 函数记录日志。
接下来,我们通过 “necklineStartPrice” 和 “necklineEndPrice” 在 “barDiff” 上的差值来确定颈线的 “slope”(斜率),计算 “breakoutNecklinePrice”,并通过一个循环向后延伸颈线,使用 “NecklineCrossesBar” 函数在 “avgPatternRange * RightShoulderBreakoutMultiplier” 范围内寻找交叉点,更新 “extendedBar”、“extendedNecklineStartTime”(通过 “iTime” 获取)和 “extendedNecklineStartPrice”;如果没有找到合适的交叉点,则回退使用 “2 * lsToNeckStart”,上限为 “Bars” 总数,并使用 Print、TimeToString 和 DoubleToString 函数记录所有详细信息——包括 K 线索引、价格和范围——以便完整存档。该自定义函数的代码片段如下。
//+------------------------------------------------------------------+
//| Check if neckline crosses a bar's high-low range                 |
//+------------------------------------------------------------------+
bool NecklineCrossesBar(double necklinePrice, int barIndex) {            //--- Function to check if neckline price intersects a bar's range
   double high = iHigh(_Symbol, _Period, barIndex);                      //--- Get the high price of the specified bar
   double low = iLow(_Symbol, _Period, barIndex);                        //--- Get the low price of the specified bar
   return (necklinePrice >= low && necklinePrice <= high);               //--- Return true if neckline price is within bar's high-low range
}
该函数检查 “necklinePrice”(颈线价格)是否在 “barIndex”(K 线索引)处与 K 线的价格范围相交,以确保颈线延伸的准确性。我们使用 iHigh 函数获取该 K 线的 “high”(最高价),使用 “iLow” 函数获取其 “low”(最低价),然后如果 “necklinePrice” 介于 “low” 和 “high” 之间,则返回 true,从而确认颈线穿过该 K 线的范围,以完成形态验证。如果形态得到验证,我们就在图表上将其图形化。我们将需要函数来绘制它并进行标注。
//+------------------------------------------------------------------+
//| Draw a trend line for visualization                              |
//+------------------------------------------------------------------+
void DrawTrendLine(string name, datetime timeStart, double priceStart, datetime timeEnd, double priceEnd, color lineColor, int width, int style) { //--- Function to draw a trend line on the chart
   if (ObjectCreate(0, name, OBJ_TREND, 0, timeStart, priceStart, timeEnd, priceEnd)) { //--- Create a trend line object if possible
      ObjectSetInteger(0, name, OBJPROP_COLOR, lineColor);               //--- Set the color of the trend line
      ObjectSetInteger(0, name, OBJPROP_STYLE, style);                   //--- Set the style (e.g., solid, dashed) of the trend line
      ObjectSetInteger(0, name, OBJPROP_WIDTH, width);                   //--- Set the width of the trend line
      ObjectSetInteger(0, name, OBJPROP_BACK, true);                     //--- Set the line to draw behind chart elements
      ChartRedraw();                                                     //--- Redraw the chart to display the new line
   } else {                                                              //--- If line creation fails
      Print("Failed to create line: ", name, ". Error: ", GetLastError()); //--- Log the error with the object name and error code
   }
}

//+------------------------------------------------------------------+
//| Draw a filled triangle for visualization                         |
//+------------------------------------------------------------------+
void DrawTriangle(string name, datetime time1, double price1, datetime time2, double price2, datetime time3, double price3, color fillColor) { //--- Function to draw a filled triangle on the chart
   if (ObjectCreate(0, name, OBJ_TRIANGLE, 0, time1, price1, time2, price2, time3, price3)) { //--- Create a triangle object if possible
      ObjectSetInteger(0, name, OBJPROP_COLOR, fillColor);               //--- Set the fill color of the triangle
      ObjectSetInteger(0, name, OBJPROP_STYLE, STYLE_SOLID);             //--- Set the border style to solid
      ObjectSetInteger(0, name, OBJPROP_WIDTH, 1);                       //--- Set the border width to 1 pixel
      ObjectSetInteger(0, name, OBJPROP_FILL, true);                     //--- Enable filling of the triangle
      ObjectSetInteger(0, name, OBJPROP_BACK, true);                     //--- Set the triangle to draw behind chart elements
      ChartRedraw();                                                     //--- Redraw the chart to display the new triangle
   } else {                                                              //--- If triangle creation fails
      Print("Failed to create triangle: ", name, ". Error: ", GetLastError()); //--- Log the error with the object name and error code
   }
}

//+------------------------------------------------------------------+
//| Draw text label for visualization                                |
//+------------------------------------------------------------------+
void DrawText(string name, datetime time, double price, string text, color textColor, bool above, double angle = 0) { //--- Function to draw a text label on the chart
   int chartscale = (int)ChartGetInteger(0, CHART_SCALE);                //--- Get the current chart zoom level
   int dynamicFontSize = 5 + int(chartscale * 1.5);                      //--- Calculate font size based on zoom level for visibility
   double priceOffset = (above ? 10 : -10) * _Point;                     //--- Set price offset above or below the point for readability
   if (ObjectCreate(0, name, OBJ_TEXT, 0, time, price + priceOffset)) {  //--- Create a text object if possible
      ObjectSetString(0, name, OBJPROP_TEXT, text);                      //--- Set the text content of the label
      ObjectSetInteger(0, name, OBJPROP_COLOR, textColor);               //--- Set the color of the text
      ObjectSetInteger(0, name, OBJPROP_FONTSIZE, dynamicFontSize);      //--- Set the font size based on chart scale
      ObjectSetInteger(0, name, OBJPROP_ANCHOR, ANCHOR_CENTER);          //--- Center the text at the specified point
      ObjectSetDouble(0, name, OBJPROP_ANGLE, angle);                    //--- Set the rotation angle of the text in degrees
      ObjectSetInteger(0, name, OBJPROP_BACK, false);                    //--- Set the text to draw in front of chart elements
      ChartRedraw();                                                     //--- Redraw the chart to display the new text
      Print("Text created: ", name, ", Angle: ", DoubleToString(angle, 2)); //--- Log successful creation of the text with its angle
   } else {                                                              //--- If text creation fails
      Print("Failed to create text: ", name, ". Error: ", GetLastError()); //--- Log the error with the object name and error code
   }
}
在这里,我们通过可视化工具来丰富程序,以便在图表上突出显示形态。首先,我们使用 “DrawTrendLine” 函数,该函数利用 ObjectCreate 函数绘制一条从 “timeStart” 和 “priceStart” 到 “timeEnd” 和 “priceEnd” 的线条,通过 ObjectSetInteger 设置 “lineColor”(线条颜色)、“style”(样式)和 “width”(宽度)等属性,使用 OBJPROP_BACK 将其绘制在 K 线后方,并使用 ChartRedraw 函数刷新显示,如果需要,使用 “Print” 和 GetLastError 记录失败信息。
接着,我们实现 “DrawTriangle” 函数来为形态的结构添加阴影,该函数调用 “ObjectCreate” 函数并传入三个点(“time1”、“price1” 等),使用 ObjectSetInteger 应用 “fillColor”(填充颜色)和实线边框,通过 OBJPROP_FILL 对其进行填充,将其置于图表后方,并使用 ChartRedraw 更新视图,同样在创建失败时使用 “Print” 记录错误。
最后,我们添加 “DrawText” 函数来标注关键点,该函数使用 ChartGetInteger 函数根据 “chartscale”(图表缩放比例)调整 “dynamicFontSize”(动态字体大小),通过 “ObjectCreate” 在 “time” 和 “price” 加上偏移量的位置放置文本,使用 “ObjectSetString” 自定义 “text”(文本),使用 “ObjectSetInteger” 设置 “textColor”(文本颜色)和 “FONTSIZE”(字体大小),使用 “ObjectSetDouble” 设置 “angle”(角度),使用 ChartRedraw 将其绘制在前方,并使用 “Print” 和 “DoubleToString” 确认创建或记录错误。现在我们可以调用这些函数来添加可视化功能,我们首先要做的是按如下方式添加线条。
string prefix = "HS_" + TimeToString(extrema[headIdx].time, TIME_MINUTES); //--- Create unique prefix for chart objects based on head time
// Lines
DrawTrendLine(prefix + "_LeftToNeckStart", lsTime, lsPrice, necklineStartTime, necklineStartPrice, clrRed, 3, STYLE_SOLID); //--- Draw line from left shoulder to neckline start
DrawTrendLine(prefix + "_NeckStartToHead", necklineStartTime, necklineStartPrice, extrema[headIdx].time, extrema[headIdx].price, clrRed, 3, STYLE_SOLID); //--- Draw line from neckline start to head
DrawTrendLine(prefix + "_HeadToNeckEnd", extrema[headIdx].time, extrema[headIdx].price, necklineEndTime, necklineEndPrice, clrRed, 3, STYLE_SOLID); //--- Draw line from head to neckline end
DrawTrendLine(prefix + "_NeckEndToRight", necklineEndTime, necklineEndPrice, extrema[rightShoulderIdx].time, extrema[rightShoulderIdx].price, clrRed, 3, STYLE_SOLID); //--- Draw line from neckline end to right shoulder
DrawTrendLine(prefix + "_Neckline", extendedNecklineStartTime, extendedNecklineStartPrice, breakoutTime, breakoutNecklinePrice, clrBlue, 2, STYLE_SOLID); //--- Draw neckline from extended start to breakout
DrawTrendLine(prefix + "_RightToBreakout", extrema[rightShoulderIdx].time, extrema[rightShoulderIdx].price, breakoutTime, breakoutNecklinePrice, clrRed, 3, STYLE_SOLID); //--- Draw line from right shoulder to breakout
DrawTrendLine(prefix + "_ExtendedToLeftShoulder", extendedNecklineStartTime, extendedNecklineStartPrice, lsTime, lsPrice, clrRed, 3, STYLE_SOLID); //--- Draw line from extended neckline to left shoulder
在这里,我们通过创建一个基于头部时间戳的唯一前缀(使用 TimeToString 函数),并使用 “DrawTrendLine” 函数绘制趋势线,来图形化地映射标准形态:我们将左肩连接到颈线起点、颈线起点连接到头部、头部连接到颈线终点、颈线终点连接到右肩,这些线条均为红色,宽度为 3;而从其延伸起点到突破点的颈线则使用蓝色,宽度为 2;此外,还有额外的红色实线将右肩连接到突破点,并将延伸的颈线连接回左肩,所有线条均为实线样式,以便在图表上显示该形态。编译完成后,我们得到了以下结果。

要添加三角形,我们使用 “DrawTriangle” 函数。从技术上讲,我们在肩部和头部之间构建它。
// Triangles
DrawTriangle(prefix + "_LeftShoulderTriangle", lsTime, lsPrice, necklineStartTime, necklineStartPrice, extendedNecklineStartTime, extendedNecklineStartPrice, clrLightCoral); //--- Draw triangle for left shoulder area
DrawTriangle(prefix + "_HeadTriangle", extrema[headIdx].time, extrema[headIdx].price, necklineStartTime, necklineStartPrice, necklineEndTime, necklineEndPrice, clrLightCoral); //--- Draw triangle for head area
DrawTriangle(prefix + "_RightShoulderTriangle", extrema[rightShoulderIdx].time, extrema[rightShoulderIdx].price, necklineEndTime, necklineEndPrice, breakoutTime, breakoutNecklinePrice, clrLightCoral); //--- Draw triangle for right shoulder area
在这里,我们通过使用 “DrawTriangle” 函数来增强视觉效果,用浅珊瑚色为关键区域添加阴影:我们为左肩构建一个三角形,其顶点为左肩点、颈线起点和延伸颈线起点;为头部构建另一个三角形,其顶点为头部点、颈线起点和颈线终点;再为右肩构建第三个三角形,其顶点为右肩点、颈线终点和突破点,从而在图表上突出显示该形态的结构。编译完成后,我们得到了以下结果。

最后,我们需要为形态添加标签,使其在视觉上更具吸引力且能一目了然。
// Text Labels
DrawText(prefix + "_LS_Label", lsTime, lsPrice, "LS", clrRed, true); //--- Draw "LS" label above left shoulder
DrawText(prefix + "_Head_Label", extrema[headIdx].time, extrema[headIdx].price, "HEAD", clrRed, true); //--- Draw "HEAD" label above head
DrawText(prefix + "_RS_Label", extrema[rightShoulderIdx].time, extrema[rightShoulderIdx].price, "RS", clrRed, true); //--- Draw "RS" label above right shoulder
datetime necklineMidTime = extendedNecklineStartTime + (breakoutTime - extendedNecklineStartTime) / 2; //--- Calculate midpoint time of the neckline
double necklineMidPrice = extendedNecklineStartPrice + slope * (iBarShift(_Symbol, _Period, extendedNecklineStartTime) - iBarShift(_Symbol, _Period, necklineMidTime)); //--- Calculate midpoint price of the neckline
// Calculate angle in pixel space
int x1 = ShiftToX(iBarShift(_Symbol, _Period, extendedNecklineStartTime)); //--- Convert extended neckline start to x-pixel coordinate
int y1 = PriceToY(extendedNecklineStartPrice);                          //--- Convert extended neckline start price to y-pixel coordinate
int x2 = ShiftToX(iBarShift(_Symbol, _Period, breakoutTime));           //--- Convert breakout time to x-pixel coordinate
int y2 = PriceToY(breakoutNecklinePrice);                               //--- Convert breakout price to y-pixel coordinate
double pixelSlope = (y2 - y1) / (double)(x2 - x1);                     //--- Calculate slope in pixel space (rise over run)
double necklineAngle = -atan(pixelSlope) * 180 / M_PI;                  //--- Calculate neckline angle in degrees, negated for visual alignment
Print("Pixel X1: ", x1, ", Y1: ", y1, ", X2: ", x2, ", Y2: ", y2, ", Pixel Slope: ", DoubleToString(pixelSlope, 4), ", Neckline Angle: ", DoubleToString(necklineAngle, 2)); //--- Log pixel coordinates and angle
DrawText(prefix + "_Neckline_Label", necklineMidTime, necklineMidPrice, "NECKLINE", clrBlue, false, necklineAngle); //--- Draw "NECKLINE" label at midpoint with calculated angle
最后,我们通过使用 “DrawText” 函数来标注该形态,在左肩、头部和右肩点各自的时间和价格位置上方,分别放置红色的 “LS”、“HEAD” 和 “RS” 标签,以增强图表的可读性。然后,我们通过平均 “extendedNecklineStartTime” 和 “breakoutTime” 来计算颈线的中点时间 “necklineMidTime”,并通过 iBarShift 函数使用 “slope”(斜率)和 K 线差值调整 “extendedNecklineStartPrice” 来获得 “necklineMidPrice”(颈线中点价格);为了对齐标签,我们使用 “ShiftToX” 函数将时间转换为 x 像素,使用 “PriceToY” 函数将价格转换为 y 像素(在颈线起点和突破点处),计算出一个 “pixelSlope”(像素斜率),并使用 atan 函数和 “M_PI” 推导出以度为单位的 “necklineAngle”(颈线角度),同时使用 “Print” 函数和 DoubleToString 函数记录这些值以供验证。
接着,我们使用 “DrawText” 函数在中点绘制一个蓝色的 “NECKLINE” 标签,将其放置在下方并根据 “necklineAngle” 进行旋转,以确保标注与颈线的倾斜度保持一致。结果如下。

从图像中,我们可以看到该形态已被完全图形化。现在我们需要检测其突破,基本上就是那条延伸线,开一个卖出仓位,并将延伸范围修改到突破 K 线。轻而易举。我们通过以下代码来实现这一点。
double entryPrice = 0;                                                  //--- Set entry price to 0 for market order (uses current price)
double sl = extrema[rightShoulderIdx].price + BufferPoints * _Point;    //--- Calculate stop-loss above right shoulder with buffer
double patternHeight = extrema[headIdx].price - necklinePrice;          //--- Calculate pattern height from head to neckline
double tp = closePrice - patternHeight;                                 //--- Calculate take-profit below close by pattern height
if (sl > closePrice && tp < closePrice) {                               //--- Validate trade direction (SL above, TP below for sell)
   if (obj_Trade.Sell(LotSize, _Symbol, entryPrice, sl, tp, "Head and Shoulders")) { //--- Attempt to open a sell trade
      AddTradedPattern(lsTime, lsPrice);                                //--- Add pattern to traded list
      Print("Sell Trade Opened: SL ", DoubleToString(sl, _Digits), ", TP ", DoubleToString(tp, _Digits)); //--- Log successful trade opening
   }
}
一旦形态得到确认,我们通过以下方式执行一笔卖出交易:将 “entryPrice” 设为 0 以市价单成交,使用 “BufferPoints” 在右肩价格上方计算 “sl”(止损价),将 “patternHeight”(形态高度)确定为头部与颈线价格之间的差值,并在 “closePrice”(收盘价)下方减去 “patternHeight” 来设置 “tp”(止盈价)。
在使用 “obj_Trade” 对象的 “Sell” 函数以 “LotSize”(手数)、“sl”、“tp” 和注释来开仓之前,我们会验证交易方向——确保 “sl” 在 “closePrice” 之上,“tp” 在其之下;如果交易成功,我们调用 “AddTradedPattern” 函数并传入 “lsTime” 和 “lsPrice” 来记录该形态,同时使用 Print 函数和 DoubleToString 函数来记录 “sl” 和 “tp” 的详细信息。用于将该形态标记为已交易的自定义函数代码片段如下。
//+------------------------------------------------------------------+
//| Add pattern to traded list with size management                  |
//+------------------------------------------------------------------+
void AddTradedPattern(datetime lsTime, double lsPrice) {                 //--- Function to add a new traded pattern to the list
   int size = ArraySize(tradedPatterns);                                 //--- Get the current size of the tradedPatterns array
   if (size >= MaxTradedPatterns) {                                      //--- Check if array size exceeds maximum allowed
      for (int i = 0; i < size - 1; i++) {                               //--- Shift all elements left to remove the oldest
         tradedPatterns[i] = tradedPatterns[i + 1];                      //--- Copy next element to current position
      }
      ArrayResize(tradedPatterns, size - 1);                            //--- Reduce array size by 1
      size--;                                                           //--- Decrement size variable
      Print("Removed oldest traded pattern to maintain max size of ", MaxTradedPatterns); //--- Log removal of oldest pattern
   }
   ArrayResize(tradedPatterns, size + 1);                                //--- Increase array size to add new pattern
   tradedPatterns[size].leftShoulderTime = lsTime;                       //--- Store the left shoulder time of the new pattern
   tradedPatterns[size].leftShoulderPrice = lsPrice;                     //--- Store the left shoulder price of the new pattern
   Print("Added traded pattern: Left Shoulder Time ", TimeToString(lsTime), ", Price ", DoubleToString(lsPrice, _Digits)); //--- Log addition of new pattern
}
我们定义 “AddTradedPattern” 函数来跟踪已交易的形态设置。该函数使用 “lsTime” 和 “lsPrice” 来记录左肩的详细信息,因为左肩不会重绘。我们使用 ArraySize 函数检查 “tradedPatterns” 数组的大小。如果它达到了 “MaxTradedPatterns”(最大已交易形态数),我们就将元素向左移动以丢弃最旧的条目。我们使用 “ArrayResize” 函数调整 “tradedPatterns” 的大小以将其缩小。我们记录此操作,然后使用 ArrayResize 函数扩展 “tradedPatterns” 以便添加新条目。我们将 “leftShoulderTime” 设置为 “lsTime”,将 “leftShoulderPrice” 设置为 “lsPrice”。我们使用 Print 函数、TimeToString 函数和 DoubleToString 函数记录此次添加。编译完成后,我们得到了以下结果。

从图像中,我们可以看到我们不仅可视化了该设置,还相应地进行了交易。倒头肩形态的识别、图形化和交易操作采用相同的逻辑,只是方式相反。以下是代码逻辑。
// Inverse Head and Shoulders (Buy)
if (DetectInverseHeadAndShoulders(extrema, leftShoulderIdx, headIdx, rightShoulderIdx, necklineStartIdx, necklineEndIdx)) { //--- Check for inverse H&S pattern
   double closePrice = iClose(_Symbol, _Period, 1);                   //--- Get the closing price of the previous bar
   double necklinePrice = extrema[necklineEndIdx].price;              //--- Get the price of the neckline end point

   if (closePrice > necklinePrice) {                                  //--- Check if price has broken above the neckline (buy signal)
      datetime lsTime = extrema[leftShoulderIdx].time;                //--- Get the timestamp of the left shoulder
      double lsPrice = extrema[leftShoulderIdx].price;                //--- Get the price of the left shoulder

      if (IsPatternTraded(lsTime, lsPrice)) return;                   //--- Exit if this pattern has already been traded

      datetime breakoutTime = iTime(_Symbol, _Period, 1);             //--- Get the timestamp of the breakout bar (previous bar)
      int lsBar = extrema[leftShoulderIdx].bar;                       //--- Get the bar index of the left shoulder
      int headBar = extrema[headIdx].bar;                             //--- Get the bar index of the head
      int rsBar = extrema[rightShoulderIdx].bar;                      //--- Get the bar index of the right shoulder
      int necklineStartBar = extrema[necklineStartIdx].bar;           //--- Get the bar index of the neckline start
      int necklineEndBar = extrema[necklineEndIdx].bar;               //--- Get the bar index of the neckline end
      int breakoutBar = 1;                                            //--- Set breakout bar index (previous bar)

      int lsToHead = lsBar - headBar;                                 //--- Calculate number of bars from left shoulder to head
      int headToRs = headBar - rsBar;                                 //--- Calculate number of bars from head to right shoulder
      int rsToBreakout = rsBar - breakoutBar;                         //--- Calculate number of bars from right shoulder to breakout
      int lsToNeckStart = lsBar - necklineStartBar;                   //--- Calculate number of bars from left shoulder to neckline start
      double avgPatternRange = (lsToHead + headToRs) / 2.0;           //--- Calculate average bar range of the pattern for uniformity check

      if (rsToBreakout > avgPatternRange * RightShoulderBreakoutMultiplier) { //--- Check if breakout distance exceeds allowed range
         Print("Pattern rejected: Right Shoulder to Breakout (", rsToBreakout,
               ") exceeds ", RightShoulderBreakoutMultiplier, "x average range (", avgPatternRange, ")"); //--- Log rejection due to excessive breakout range
         return;                                                      //--- Exit function if pattern is invalid
      }

      double necklineStartPrice = extrema[necklineStartIdx].price;    //--- Get the price of the neckline start point
      double necklineEndPrice = extrema[necklineEndIdx].price;        //--- Get the price of the neckline end point
      datetime necklineStartTime = extrema[necklineStartIdx].time;    //--- Get the timestamp of the neckline start point
      datetime necklineEndTime = extrema[necklineEndIdx].time;        //--- Get the timestamp of the neckline end point
      int barDiff = necklineStartBar - necklineEndBar;                //--- Calculate bar difference between neckline points for slope
      double slope = (necklineEndPrice - necklineStartPrice) / barDiff; //--- Calculate the slope of the neckline (price change per bar)
      double breakoutNecklinePrice = necklineStartPrice + slope * (necklineStartBar - breakoutBar); //--- Calculate neckline price at breakout point

      // Extend neckline backwards
      int extendedBar = necklineStartBar;                             //--- Initialize extended bar index with neckline start
      datetime extendedNecklineStartTime = necklineStartTime;         //--- Initialize extended neckline start time
      double extendedNecklineStartPrice = necklineStartPrice;         //--- Initialize extended neckline start price
      bool foundCrossing = false;                                     //--- Flag to track if neckline crosses a bar within range

      for (int i = necklineStartBar + 1; i < Bars(_Symbol, _Period); i++) { //--- Loop through bars to extend neckline backwards
         double checkPrice = necklineStartPrice - slope * (i - necklineStartBar); //--- Calculate projected neckline price at bar i
         if (NecklineCrossesBar(checkPrice, i)) {                     //--- Check if neckline intersects the bar's high-low range
            int distance = i - necklineStartBar;                      //--- Calculate distance from neckline start to crossing bar
            if (distance <= avgPatternRange * RightShoulderBreakoutMultiplier) { //--- Check if crossing is within uniformity range
               extendedBar = i;                                       //--- Update extended bar index
               extendedNecklineStartTime = iTime(_Symbol, _Period, i); //--- Update extended neckline start time
               extendedNecklineStartPrice = checkPrice;              //--- Update extended neckline start price
               foundCrossing = true;                                  //--- Set flag to indicate crossing found
               Print("Neckline extended to first crossing bar within uniformity: Bar ", extendedBar); //--- Log successful extension
               break;                                                 //--- Exit loop after finding valid crossing
            } else {                                                  //--- If crossing exceeds uniformity range
               Print("Crossing bar ", i, " exceeds uniformity (", distance, " > ", avgPatternRange * RightShoulderBreakoutMultiplier, ")"); //--- Log rejection of crossing
               break;                                                 //--- Exit loop as crossing is too far
            }
         }
      }

      if (!foundCrossing) {                                           //--- If no valid crossing found within range
         int barsToExtend = 2 * lsToNeckStart;                        //--- Set fallback extension distance as twice LS to neckline start
         extendedBar = necklineStartBar + barsToExtend;               //--- Calculate extended bar index
         if (extendedBar >= Bars(_Symbol, _Period)) extendedBar = Bars(_Symbol, _Period) - 1; //--- Cap extended bar at total bars if exceeded
         extendedNecklineStartTime = iTime(_Symbol, _Period, extendedBar); //--- Update extended neckline start time
         extendedNecklineStartPrice = necklineStartPrice - slope * (extendedBar - necklineStartBar); //--- Update extended neckline start price
         Print("Neckline extended to fallback (2x LS to Neckline Start): Bar ", extendedBar, " (no crossing within uniformity)"); //--- Log fallback extension
      }

      Print("Inverse Head and Shoulders Detected:");                  //--- Log detection of inverse H&S pattern
      Print("Left Shoulder: Bar ", lsBar, ", Time ", TimeToString(lsTime), ", Price ", DoubleToString(lsPrice, _Digits)); //--- Log left shoulder details
      Print("Head: Bar ", headBar, ", Time ", TimeToString(extrema[headIdx].time), ", Price ", DoubleToString(extrema[headIdx].price, _Digits)); //--- Log head details
      Print("Right Shoulder: Bar ", rsBar, ", Time ", TimeToString(extrema[rightShoulderIdx].time), ", Price ", DoubleToString(extrema[rightShoulderIdx].price, _Digits)); //--- Log right shoulder details
      Print("Neckline Start: Bar ", necklineStartBar, ", Time ", TimeToString(necklineStartTime), ", Price ", DoubleToString(necklineStartPrice, _Digits)); //--- Log neckline start details
      Print("Neckline End: Bar ", necklineEndBar, ", Time ", TimeToString(necklineEndTime), ", Price ", DoubleToString(necklineEndPrice, _Digits)); //--- Log neckline end details
      Print("Close Price: ", DoubleToString(closePrice, _Digits));    //--- Log closing price at breakout
      Print("Breakout Time: ", TimeToString(breakoutTime));           //--- Log breakout timestamp
      Print("Neckline Price at Breakout: ", DoubleToString(breakoutNecklinePrice, _Digits)); //--- Log neckline price at breakout
      Print("Extended Neckline Start: Bar ", extendedBar, ", Time ", TimeToString(extendedNecklineStartTime), ", Price ", DoubleToString(extendedNecklineStartPrice, _Digits)); //--- Log extended neckline start details
      Print("Bar Ranges: LS to Head = ", lsToHead, ", Head to RS = ", headToRs, ", RS to Breakout = ", rsToBreakout, ", LS to Neckline Start = ", lsToNeckStart); //--- Log bar ranges for pattern analysis

      string prefix = "IHS_" + TimeToString(extrema[headIdx].time, TIME_MINUTES); //--- Create unique prefix for chart objects based on head time
      // Lines
      DrawTrendLine(prefix + "_LeftToNeckStart", lsTime, lsPrice, necklineStartTime, necklineStartPrice, clrGreen, 2, STYLE_SOLID); //--- Draw line from left shoulder to neckline start
      DrawTrendLine(prefix + "_NeckStartToHead", necklineStartTime, necklineStartPrice, extrema[headIdx].time, extrema[headIdx].price, clrGreen, 2, STYLE_SOLID); //--- Draw line from neckline start to head
      DrawTrendLine(prefix + "_HeadToNeckEnd", extrema[headIdx].time, extrema[headIdx].price, necklineEndTime, necklineEndPrice, clrGreen, 2, STYLE_SOLID); //--- Draw line from head to neckline end
      DrawTrendLine(prefix + "_NeckEndToRight", necklineEndTime, necklineEndPrice, extrema[rightShoulderIdx].time, extrema[rightShoulderIdx].price, clrGreen, 2, STYLE_SOLID); //--- Draw line from neckline end to right shoulder
      DrawTrendLine(prefix + "_Neckline", extendedNecklineStartTime, extendedNecklineStartPrice, breakoutTime, breakoutNecklinePrice, clrBlue, 2, STYLE_SOLID); //--- Draw neckline from extended start to breakout
      DrawTrendLine(prefix + "_RightToBreakout", extrema[rightShoulderIdx].time, extrema[rightShoulderIdx].price, breakoutTime, breakoutNecklinePrice, clrGreen, 2, STYLE_SOLID); //--- Draw line from right shoulder to breakout
      DrawTrendLine(prefix + "_ExtendedToLeftShoulder", extendedNecklineStartTime, extendedNecklineStartPrice, lsTime, lsPrice, clrGreen, 2, STYLE_SOLID); //--- Draw line from extended neckline to left shoulder
      // Triangles
      DrawTriangle(prefix + "_LeftShoulderTriangle", lsTime, lsPrice, necklineStartTime, necklineStartPrice, extendedNecklineStartTime, extendedNecklineStartPrice, clrLightGreen); //--- Draw triangle for left shoulder area
      DrawTriangle(prefix + "_HeadTriangle", extrema[headIdx].time, extrema[headIdx].price, necklineStartTime, necklineStartPrice, necklineEndTime, necklineEndPrice, clrLightGreen); //--- Draw triangle for head area
      DrawTriangle(prefix + "_RightShoulderTriangle", extrema[rightShoulderIdx].time, extrema[rightShoulderIdx].price, necklineEndTime, necklineEndPrice, breakoutTime, breakoutNecklinePrice, clrLightGreen); //--- Draw triangle for right shoulder area
      // Text Labels
      DrawText(prefix + "_LS_Label", lsTime, lsPrice, "LS", clrGreen, false); //--- Draw "LS" label below left shoulder
      DrawText(prefix + "_Head_Label", extrema[headIdx].time, extrema[headIdx].price, "HEAD", clrGreen, false); //--- Draw "HEAD" label below head
      DrawText(prefix + "_RS_Label", extrema[rightShoulderIdx].time, extrema[rightShoulderIdx].price, "RS", clrGreen, false); //--- Draw "RS" label below right shoulder
      datetime necklineMidTime = extendedNecklineStartTime + (breakoutTime - extendedNecklineStartTime) / 2; //--- Calculate midpoint time of the neckline
      double necklineMidPrice = extendedNecklineStartPrice + slope * (iBarShift(_Symbol, _Period, extendedNecklineStartTime) - iBarShift(_Symbol, _Period, necklineMidTime)); //--- Calculate midpoint price of the neckline
      // Calculate angle in pixel space
      int x1 = ShiftToX(iBarShift(_Symbol, _Period, extendedNecklineStartTime)); //--- Convert extended neckline start to x-pixel coordinate
      int y1 = PriceToY(extendedNecklineStartPrice);                          //--- Convert extended neckline start price to y-pixel coordinate
      int x2 = ShiftToX(iBarShift(_Symbol, _Period, breakoutTime));           //--- Convert breakout time to x-pixel coordinate
      int y2 = PriceToY(breakoutNecklinePrice);                               //--- Convert breakout price to y-pixel coordinate
      double pixelSlope = (y2 - y1) / (double)(x2 - x1);                     //--- Calculate slope in pixel space (rise over run)
      double necklineAngle = -atan(pixelSlope) * 180 / M_PI;                  //--- Calculate neckline angle in degrees, negated for visual alignment
      Print("Pixel X1: ", x1, ", Y1: ", y1, ", X2: ", x2, ", Y2: ", y2, ", Pixel Slope: ", DoubleToString(pixelSlope, 4), ", Neckline Angle: ", DoubleToString(necklineAngle, 2)); //--- Log pixel coordinates and angle
      DrawText(prefix + "_Neckline_Label", necklineMidTime, necklineMidPrice, "NECKLINE", clrBlue, true, necklineAngle); //--- Draw "NECKLINE" label at midpoint with calculated angle

      double entryPrice = 0;                                                  //--- Set entry price to 0 for market order (uses current price)
      double sl = extrema[rightShoulderIdx].price - BufferPoints * _Point;    //--- Calculate stop-loss below right shoulder with buffer
      double patternHeight = necklinePrice - extrema[headIdx].price;          //--- Calculate pattern height from neckline to head
      double tp = closePrice + patternHeight;                                 //--- Calculate take-profit above close by pattern height
      if (sl < closePrice && tp > closePrice) {                               //--- Validate trade direction (SL below, TP above for buy)
         if (obj_Trade.Buy(LotSize, _Symbol, entryPrice, sl, tp, "Inverse Head and Shoulders")) { //--- Attempt to open a buy trade
            AddTradedPattern(lsTime, lsPrice);                                //--- Add pattern to traded list
            Print("Buy Trade Opened: SL ", DoubleToString(sl, _Digits), ", TP ", DoubleToString(tp, _Digits)); //--- Log successful trade opening
         }
      }
   }
}
现在剩下的是通过应用移动止损逻辑来管理已开仓位,以实现利润最大化。我们创建一个函数来处理移动止损逻辑,如下所示。
//+------------------------------------------------------------------+
//| Apply trailing stop with minimum profit threshold                |
//+------------------------------------------------------------------+
void ApplyTrailingStop(int minTrailPoints, int trailingPoints, CTrade &trade_object, ulong magicNo = 0) { //--- Function to apply trailing stop to open positions
   double bid = SymbolInfoDouble(_Symbol, SYMBOL_BID);                           //--- Get current bid price
   double ask = SymbolInfoDouble(_Symbol, SYMBOL_ASK);                           //--- Get current ask price

   for (int i = PositionsTotal() - 1; i >= 0; i--) {                             //--- Loop through all open positions from last to first
      ulong ticket = PositionGetTicket(i);                                       //--- Retrieve position ticket number
      if (ticket > 0 && PositionSelectByTicket(ticket)) {                        //--- Check if ticket is valid and select the position
         if (PositionGetString(POSITION_SYMBOL) == _Symbol &&                    //--- Verify position is for the current symbol
             (magicNo == 0 || PositionGetInteger(POSITION_MAGIC) == magicNo)) {  //--- Check if magic number matches or no magic filter applied
            double openPrice = PositionGetDouble(POSITION_PRICE_OPEN);           //--- Get position opening price
            double currentSL = PositionGetDouble(POSITION_SL);                   //--- Get current stop-loss price
            double currentProfit = PositionGetDouble(POSITION_PROFIT) / (LotSize * SymbolInfoDouble(_Symbol, SYMBOL_TRADE_TICK_VALUE)); //--- Calculate profit in points

            if (PositionGetInteger(POSITION_TYPE) == POSITION_TYPE_BUY) {         //--- Check if position is a Buy
               double profitPoints = (bid - openPrice) / _Point;                 //--- Calculate profit in points for Buy position
               if (profitPoints >= minTrailPoints + trailingPoints) {            //--- Check if profit exceeds minimum threshold for trailing
                  double newSL = NormalizeDouble(bid - trailingPoints * _Point, _Digits); //--- Calculate new stop-loss price
                  if (newSL > openPrice && (newSL > currentSL || currentSL == 0)) { //--- Ensure new SL is above open price and better than current SL
                     if (trade_object.PositionModify(ticket, newSL, PositionGetDouble(POSITION_TP))) { //--- Attempt to modify position with new SL
                        Print("Trailing Stop Updated: Ticket ", ticket, ", New SL: ", DoubleToString(newSL, _Digits)); //--- Log successful SL update
                     }
                  }
               }
            } else if (PositionGetInteger(POSITION_TYPE) == POSITION_TYPE_SELL) { //--- Check if position is a Sell
               double profitPoints = (openPrice - ask) / _Point;                 //--- Calculate profit in points for Sell position
               if (profitPoints >= minTrailPoints + trailingPoints) {            //--- Check if profit exceeds minimum threshold for trailing
                  double newSL = NormalizeDouble(ask + trailingPoints * _Point, _Digits); //--- Calculate new stop-loss price
                  if (newSL < openPrice && (newSL < currentSL || currentSL == 0)) { //--- Ensure new SL is below open price and better than current SL
                     if (trade_object.PositionModify(ticket, newSL, PositionGetDouble(POSITION_TP))) { //--- Attempt to modify position with new SL
                        Print("Trailing Stop Updated: Ticket ", ticket, ", New SL: ", DoubleToString(newSL, _Digits)); //--- Log successful SL update
                     }
                  }
               }
            }
         }
      }
   }
}
在这里,我们通过 “ApplyTrailingStop” 函数添加了移动止损功能。该函数使用 “minTrailPoints”(最小移动点数)和 “trailingPoints”(移动点数)来调整已开仓位。我们使用 SymbolInfoDouble 函数获取 “bid”(买入价)和 “ask”(卖出价)。我们使用 PositionsTotal 函数遍历所有持仓。对于每个持仓,我们使用 PositionGetTicket 函数获取其 “ticket”(订单号),并使用 PositionSelectByTicket 函数选中它。我们使用 “PositionGetString” 和 “PositionGetInteger” 函数验证交易品种和 “magicNo”(魔术数字)。我们使用 PositionGetDouble 函数获取 “openPrice”(开仓价)、“currentSL”(当前止损价)和 “currentProfit”(当前盈亏)。
对于买单(Buy),我们使用 “bid” 计算利润,并检查其是否满足 “minTrailPoints” 加上 “trailingPoints” 的条件。如果满足,我们使用 NormalizeDouble 函数设置新的 “newSL”(新止损价),并通过 “trade_object” 对象的 “PositionModify” 方法来更新它。对于卖单(Sell),我们则使用 “ask” 并相应地在下方调整 “newSL”。成功的价格修改将被记录下来。然后,我们可以在 OnTick 事件处理程序中调用此函数。
// Apply trailing stop if enabled and positions exist
if (UseTrailingStop && PositionsTotal() > 0) {                        //--- Check if trailing stop is enabled and there are open positions
   ApplyTrailingStop(MinTrailPoints, TrailingPoints, obj_Trade, MagicNumber); //--- Apply trailing stop to positions with specified parameters
}
使用输入参数调用该函数,就是我们启用移动止损所需要做的全部工作。现在剩下的是,在程序不再使用时释放数组,并删除我们绘制的图形对象。我们在 OnDeinit 事件处理程序中处理这些。
//+------------------------------------------------------------------+
//| Expert deinitialization function                                 |
//+------------------------------------------------------------------+
void OnDeinit(const int reason) {                                        //--- Expert Advisor deinitialization function
   ArrayFree(tradedPatterns);                                            //--- Free memory used by tradedPatterns array
   ObjectsDeleteAll(0, "HS_");                                           //--- Delete all chart objects with "HS_" prefix (standard H&S)
   ObjectsDeleteAll(0, "IHS_");                                          //--- Delete all chart objects with "IHS_" prefix (inverse H&S)
   ChartRedraw();                                                        //--- Redraw the chart to remove deleted objects
}
在 OnDeinit 事件处理程序中(该程序在智能交易系统关闭时运行),我们会清理程序及其所附加的图表。我们使用 ArrayFree 函数释放 “tradedPatterns” 数组占用的内存。然后,我们移除所有图表对象。ObjectsDeleteAll 函数会清除所有带有 “HS_” 前缀的标准形态对象。它也会清除所有带有 “IHS_” 前缀的反向形态对象。最后,我们刷新图表。ChartRedraw 函数会更新显示,以在完全关闭前反映这些更改。编译完成后,我们得到了以下结果。

从图像中,我们可以看到对已交易应用了移动止损,从而实现了我们的目标。剩下的事情就是对该程序进行回测,这将在下一节中处理。
回测
经过彻底的回测后,我们得到以下结果。
回测结果图形:

回测报告:

结论
总之,我们已经成功地在 MQL5 中构建了一个头肩形态交易算法。它具备精确的形态检测、详细的可视化以及针对经典反转信号的自动化交易执行功能。通过使用验证规则、颈线绘制和移动止损,我们的智能交易系统能够有效地适应市场变化。您可以将本文中制作的图示作为垫脚石,通过参数调整或高级风险控制等额外步骤来增强它。另外,请注意,这是一种较为罕见的形态设置。
免责声明:本文仅用于教学目的。交易涉及重大的财务风险,市场状况可能不可预测。在实盘部署前,充分的回测和风险管理至关重要。
有了这个基础,您可以精进自己的交易技巧并改进此算法。不断测试和优化,以取得成功。祝您好运!
本文由MetaQuotes Ltd译自英文
原文地址: https://www.mql5.com/en/articles/17618
注意: MetaQuotes Ltd.将保留所有关于这些材料的权利。全部或部分复制或者转载这些材料将被禁止。
本文由网站的一位用户撰写,反映了他们的个人观点。MetaQuotes Ltd 不对所提供信息的准确性负责,也不对因使用所述解决方案、策略或建议而产生的任何后果负责。
